Product development plans tools and techniques powerpoint presentation slides
Product Development Plans Tools And Techniques PowerPoint Presentation slides to go through the number of stages of product development. Incorporate product life cycle PPT templates to plan a strategy on the product development based on research and changes in the market. This professionally designed Product Development Plans Tools And Techniques PPT presentation slideshow comprises of slides on product idea screening, new product introduction, product overview, product roadmap, product analysis and more. Use product development tools and techniques such as BCG matrix, Ansoff matrix, Kano map and more. Conduct market analysis, market segmentation, product market mapping to strategically place your product in the market. Evaluate competitive strategies to know where you stand in the market along with your competitors. Create a marketing launch plan to buzz about the newly developed product. This content-ready new product development presentation PPT covers every aspect of the product development and introduction. Download this professionally designed product development steps complete presentation to develop new product and improve the existing ones. Achieve far beyond the dream you have with our Product Development Plans Tools And Techniques Powerpoint Presentation Slides. They enable you to blow past your goals.
- Google Slides is a new FREE Presentation software from Google.
- All our content is 100% compatible with Google Slides.
- Just download our designs, and upload them to Google Slides and they will work automatically.
- Amaze your audience with SlideTeam and Google Slides.
-
Want Changes to This PPT Slide? Check out our Presentation Design Services
- WideScreen Aspect ratio is becoming a very popular format. When you download this product, the downloaded ZIP will contain this product in both standard and widescreen format.
-

- Some older products that we have may only be in standard format, but they can easily be converted to widescreen.
- To do this, please open the SlideTeam product in Powerpoint, and go to
- Design ( On the top bar) -> Page Setup -> and select "On-screen Show (16:9)” in the drop down for "Slides Sized for".
- The slide or theme will change to widescreen, and all graphics will adjust automatically. You can similarly convert our content to any other desired screen aspect ratio.
Compatible With Google Slides

Get This In WideScreen
You must be logged in to download this presentation.
PowerPoint presentation slides
Presenting product development plans tools and techniques presentation slides. This deck comprises of total of 68 slides. Each slide includes professional visuals with an appropriate content. These templates have been designed keeping the customers requirement in mind. This complete presentation covers all the design elements such as layout, diagrams, icons, and more. This deck has been crafted after an extensive research. You can easily customize each template. Edit the colour, text, icon, and font size as per your requirement. Easy to download. Compatible with all screen types and monitors. Supports Google Slides. Premium Customer Support available.
People who downloaded this PowerPoint presentation also viewed the following :
Content of this Powerpoint Presentation
Slide 1: This slide introduces Product Development Plans, Tools & Techniques. State Your company name and begin.
Slide 2: This slide is for Agenda. You can use it for your company agenda.
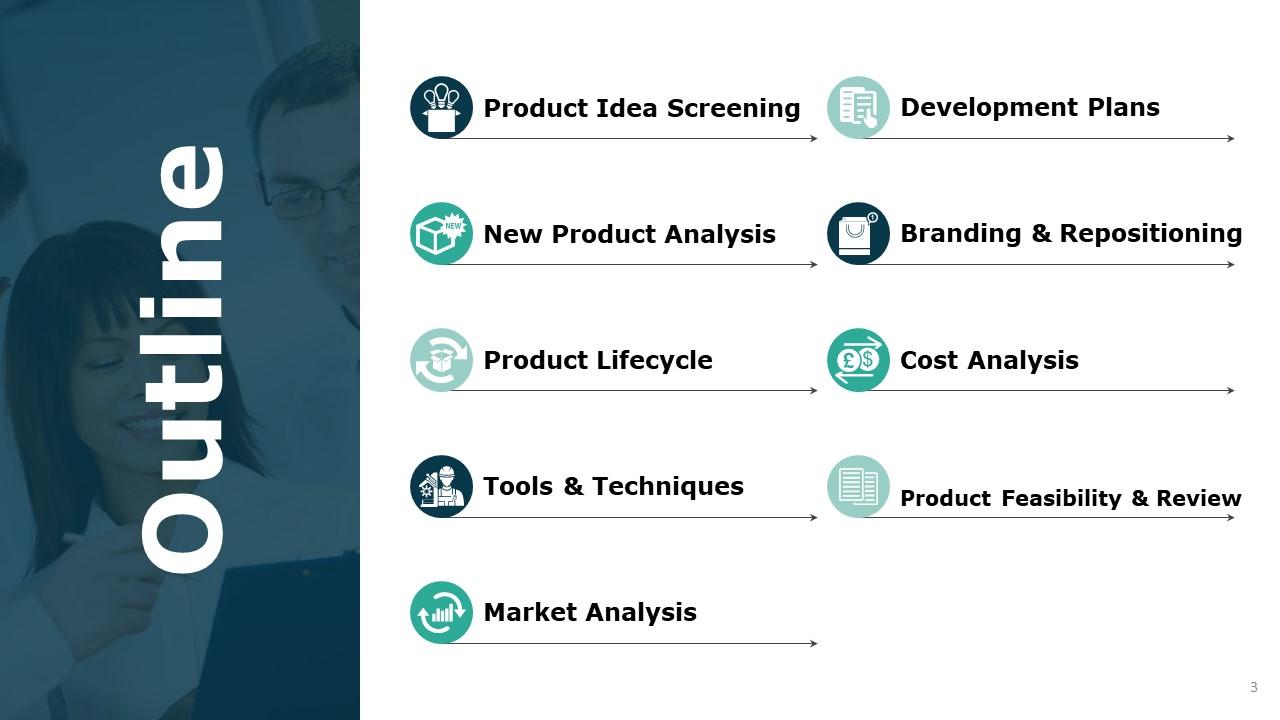
Slide 3: This slide shows Outline with these points - Development Plans, Branding & Repositioning, Product Feasibility & Review, Cost Analysis, Market Analysis, Product Idea Screening, New Product Analysis, Tools & Techniques, Product Lifecycle.
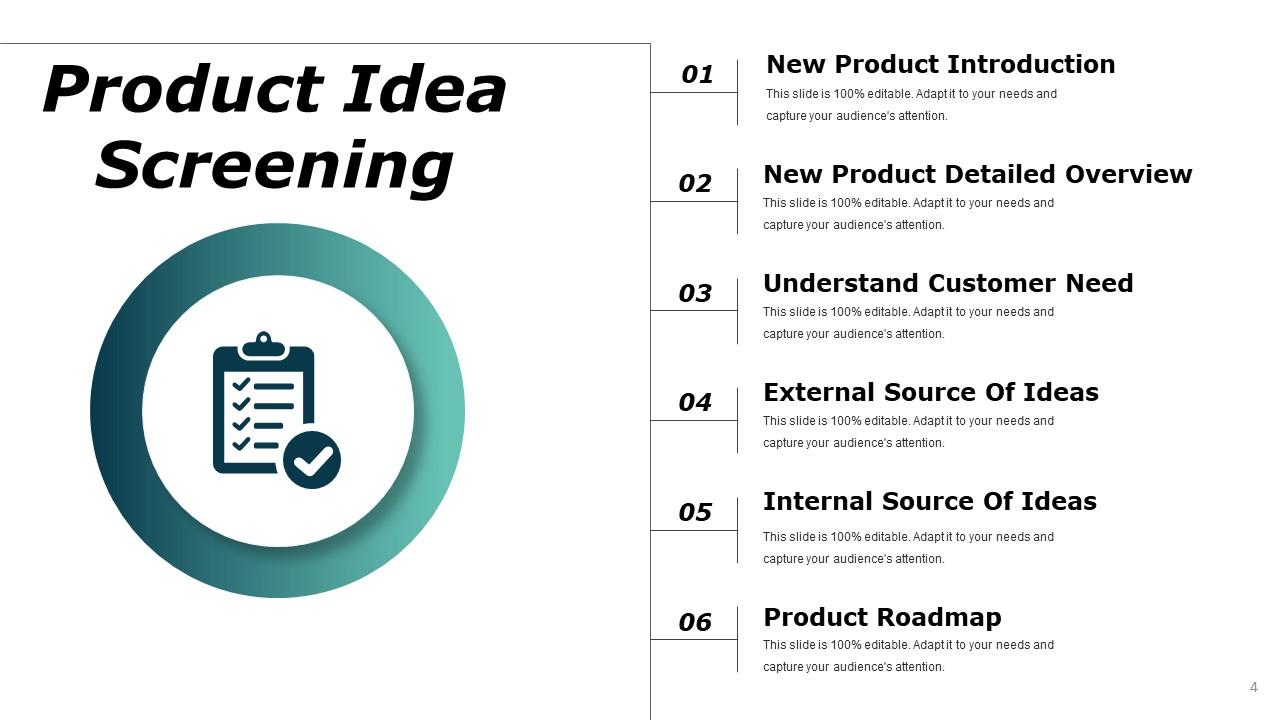
Slide 4: This slide shows Product Idea Screening with these six parameters- New Product Detailed Overview, Understand Customer Need, External Source Of Ideas, Internal Source Of Ideas, Product Roadmap, New Product Introduction.
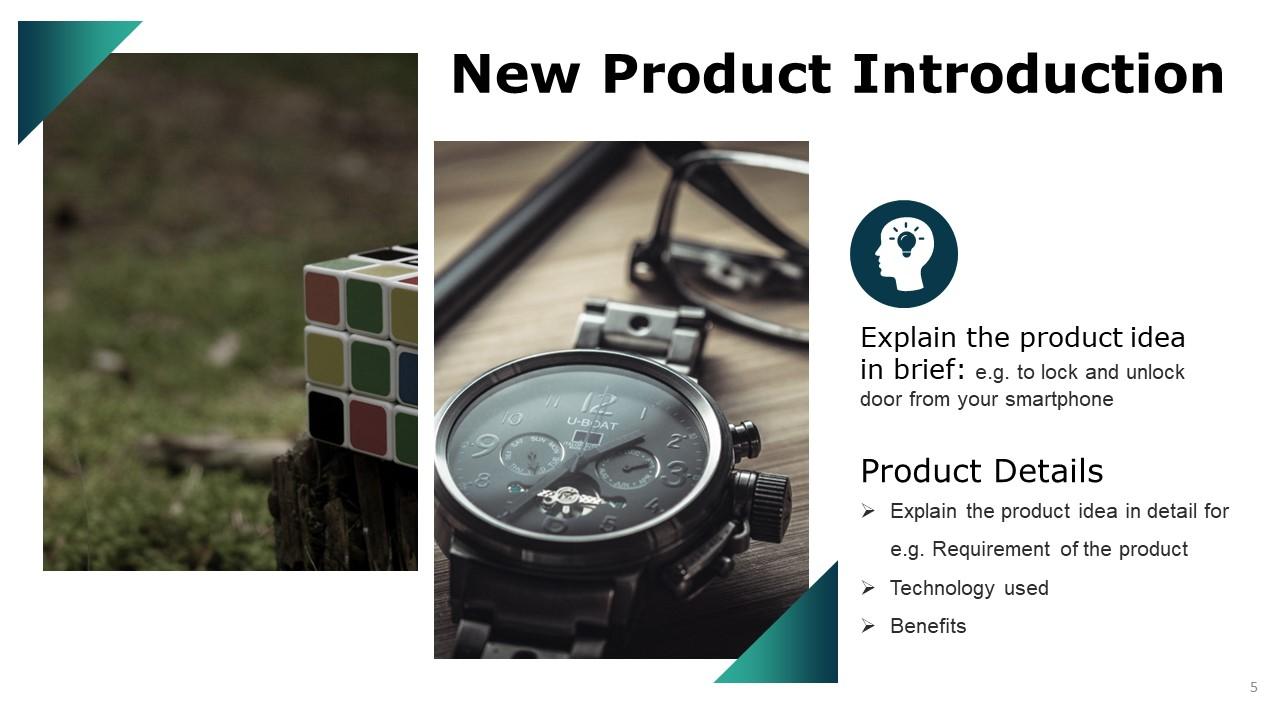
Slide 5: This slide shows New Product Introduction which further help you about the product ides brief.
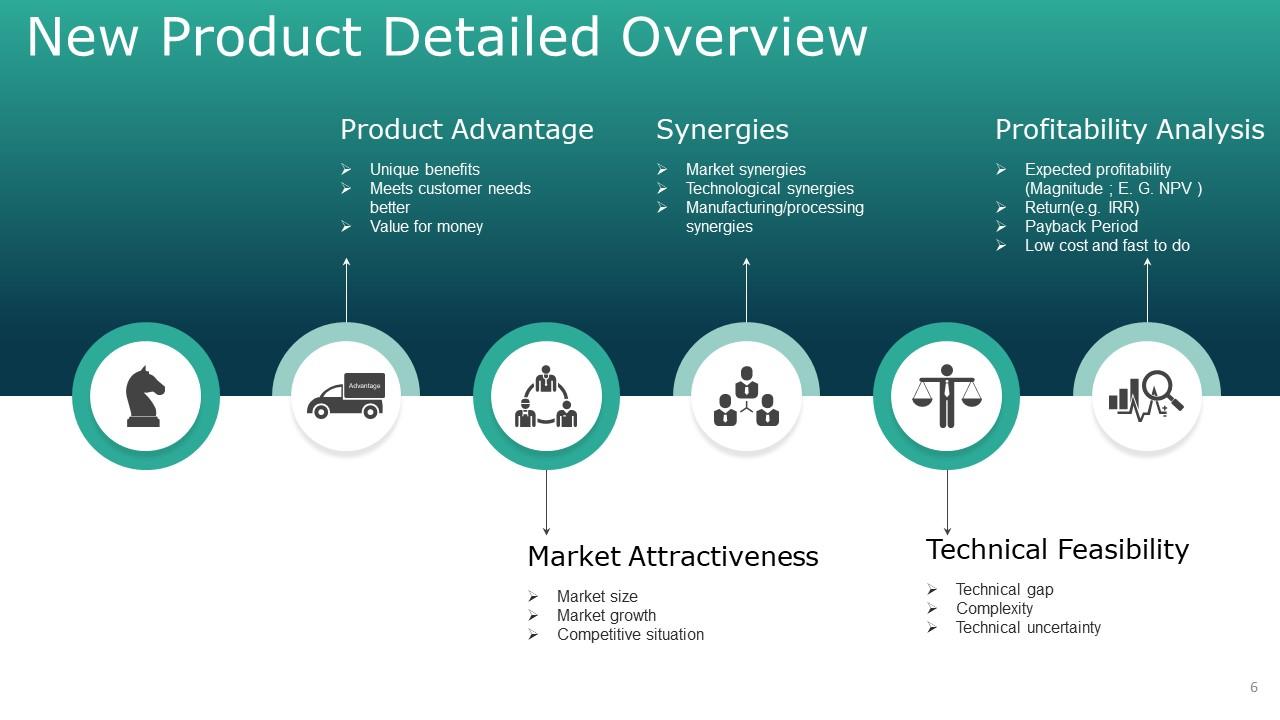
Slide 6: This slide showcases New Product Detailed Overview with these parameters- Profitability Analysis, Expected profitability (Magnitude ; E. G. NPV ), Return(e.g. IRR), Payback Period, Low cost and fast to do, Synergies, Market synergies, Technological synergies, Manufacturing/processing synergies, Product Advantage, Unique benefits, Meets customer needs better, Value for money, Technical Feasibility, Technical gap, Complexity, Technical uncertainty, Market Attractiveness, Market size, Market growth, Competitive situation.
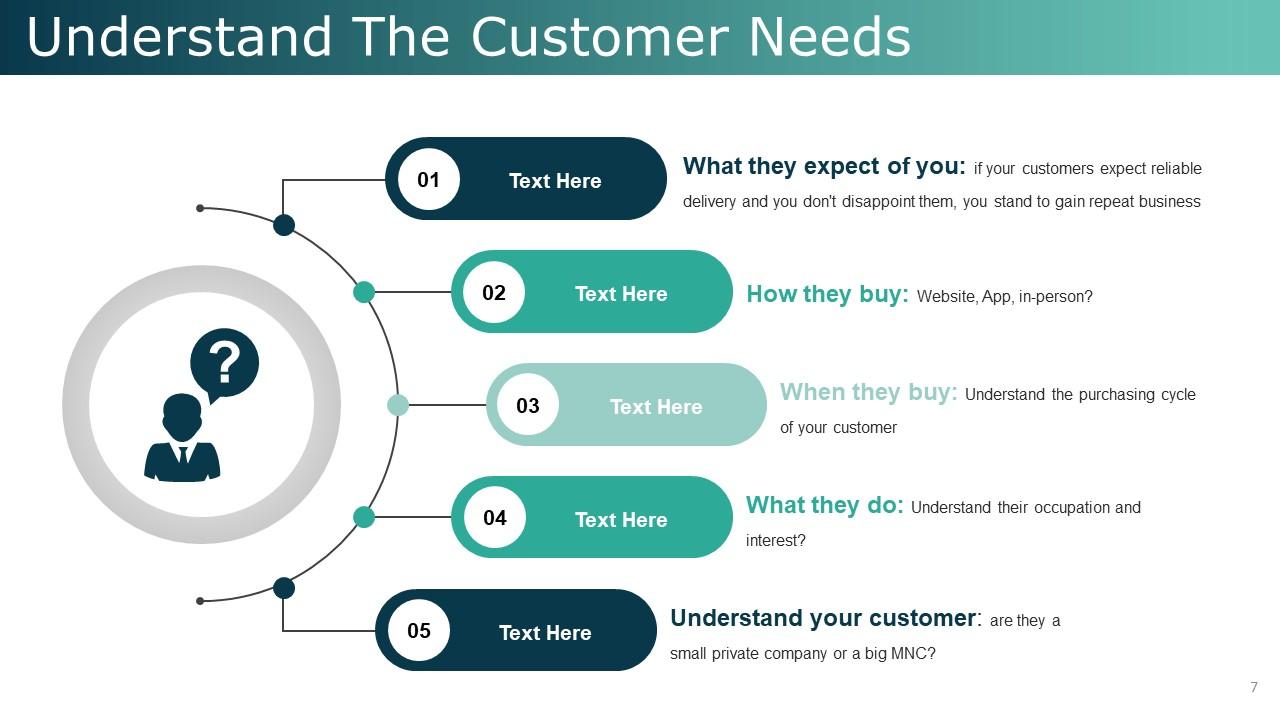
Slide 7: This slide is for Understand The Customer Needs with these parameters- What they expect of you: if your customers expect reliable delivery and you don't disappoint them, you stand to gain repeat business, How they buy: Website, App, in-person, When they buy: Understand the purchasing cycle of your customer, What they do: Understand their occupation and interest, Understand your customer: are they a small private company or a big MNC.
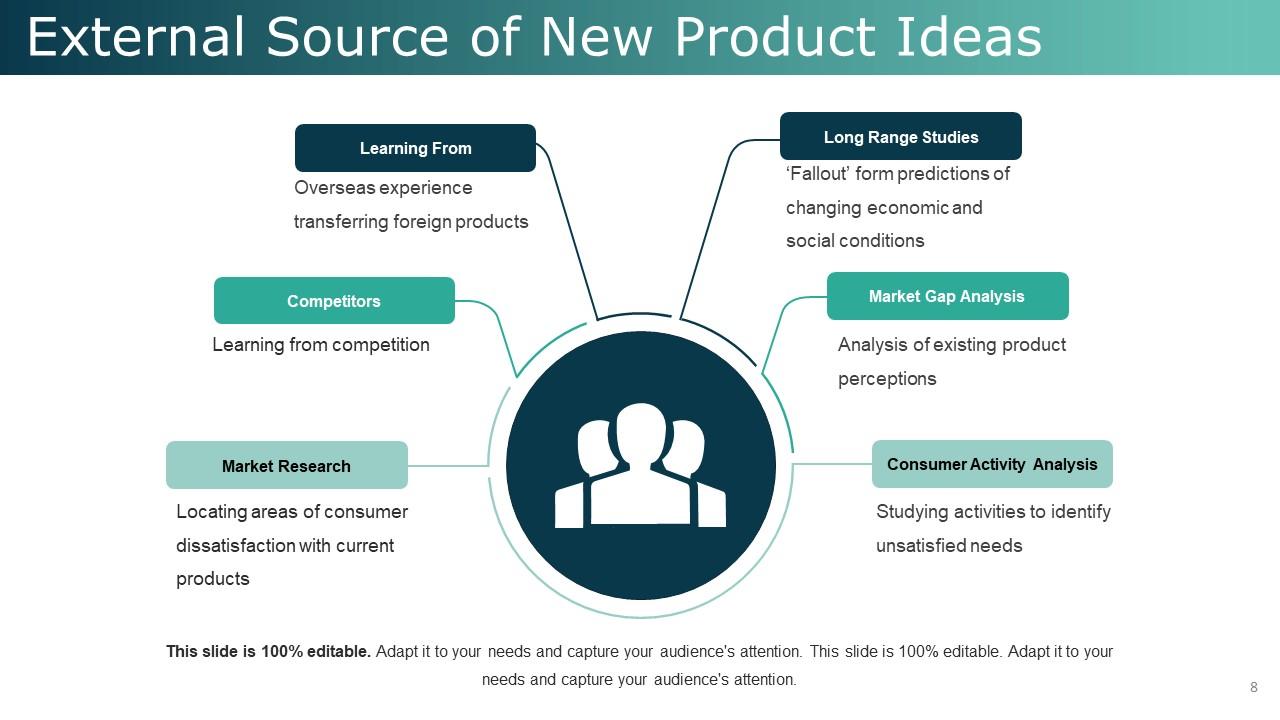
Slide 8: This slide showcases External Source of New Product Ideas with these six factors- Market Research, Competitors, Learning From, Long Range Studies, Market Gap Analysis, Consumer Activity Analysis.
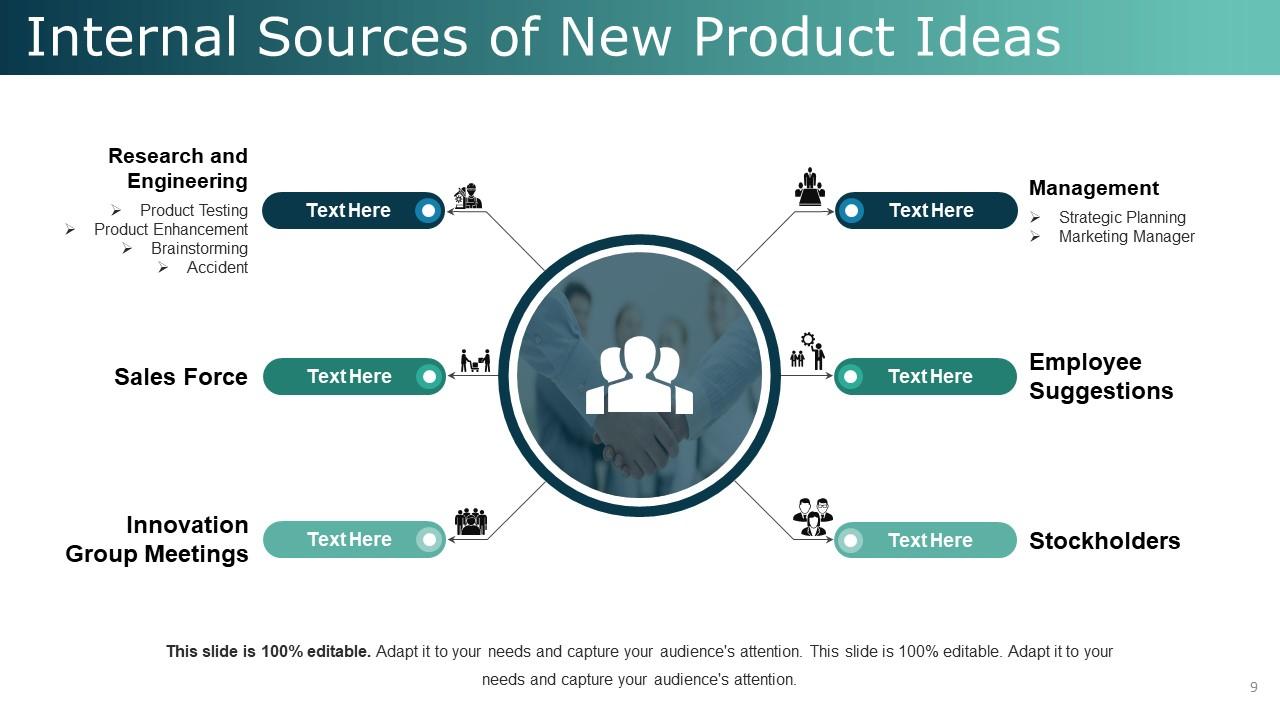
Slide 9: This slide showcases Internal Sources of New Product Ideas with these parameters- Stockholders, Employee Suggestions, Management, Sales Force, Innovation Group Meetings, Research and Engineering.
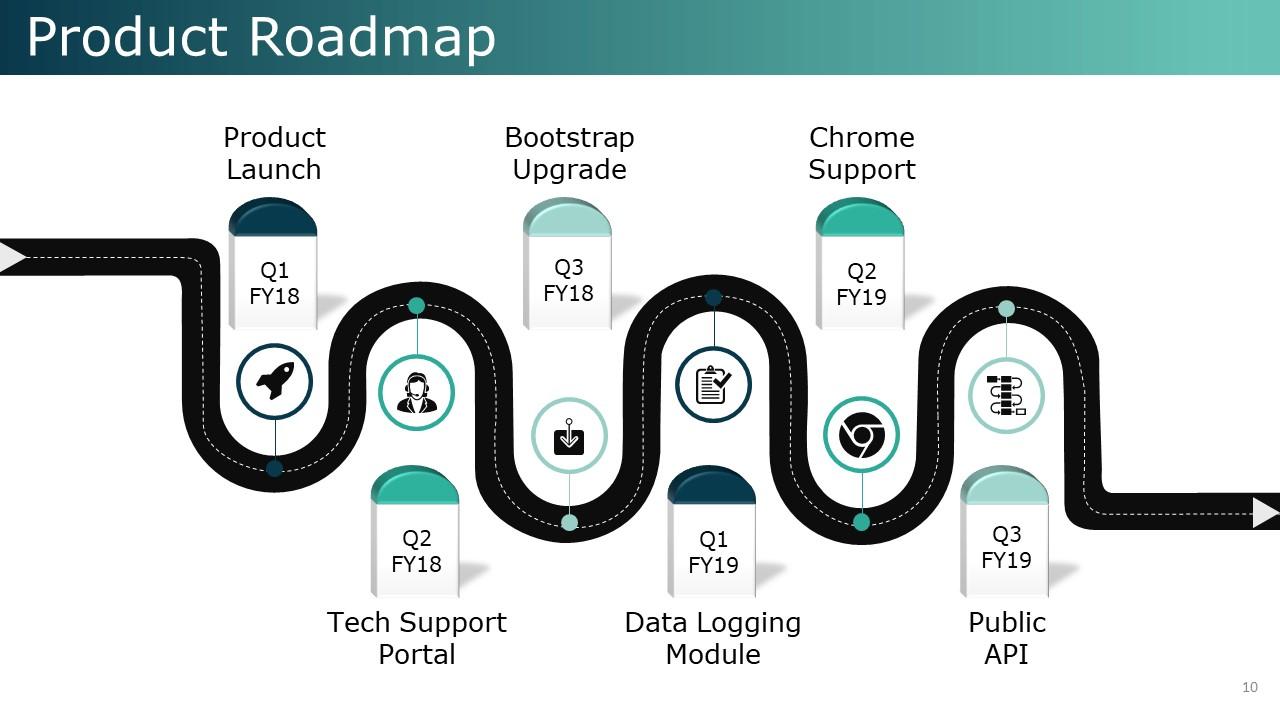
Slide 10: This slide shows Product Roadmap with these factors- Product Launch, Tech Support Portal, Bootstrap Upgrade, Data Logging Module, Chrome Support, Public API.
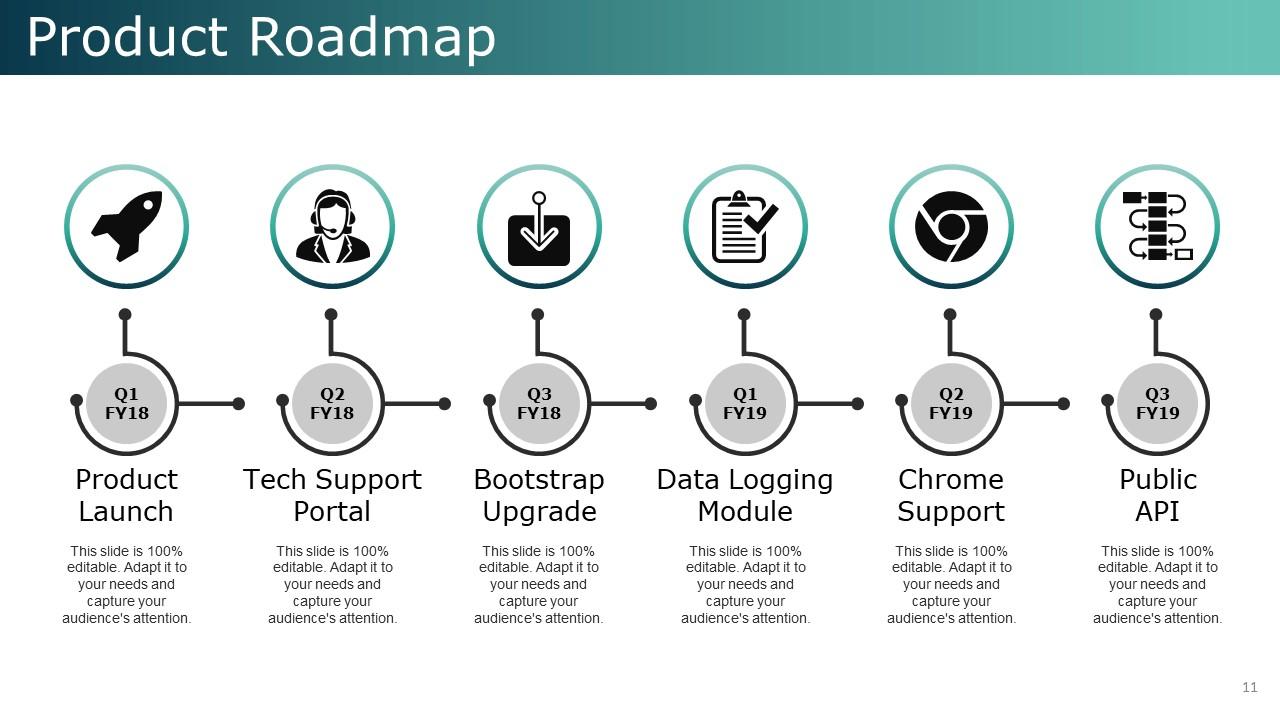
Slide 11: This slide shows Product Roadmap Product Launch, Bootstrap Upgrade, Chrome Support, Tech Support Portal, Data Logging Module, Public API.
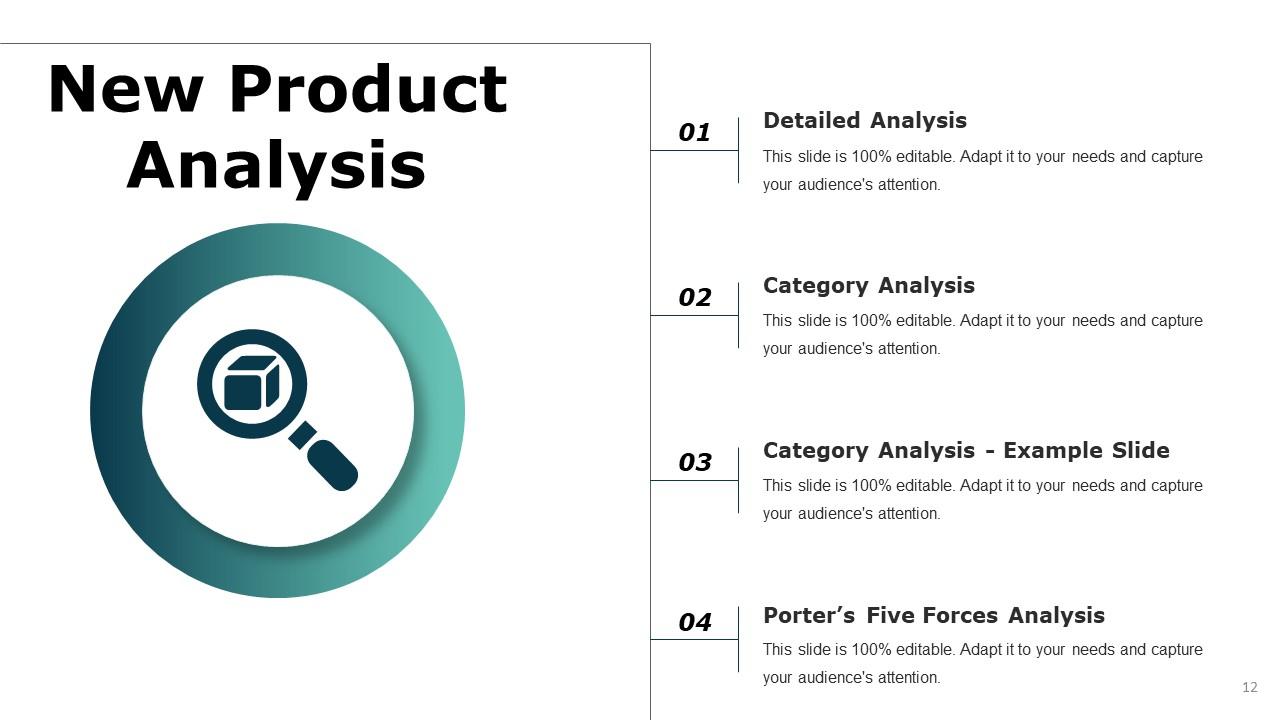
Slide 12: This slide shows New Product Analysis which further shows these four steps- Detailed Analysis, Category Analysis, Category Analysis - Example Slide, Porter’s Five Forces Analysis.
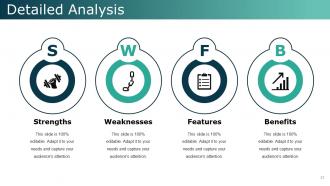
Slide 13: This slide presents Detailed Analysis with these four factors- Weaknesses, Features, Benefits, Strengths.
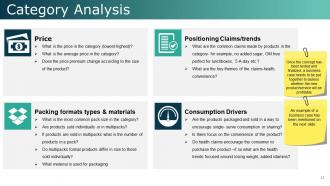
Slide 14: This slide presents Category Analysis with these four parameters- Consumption Drivers, Positioning Claims/trends, Price, packing formata types & materials, Once the concept has been tested and finalized, a business case needs to be put together to assess whether the new product/service will be profitable
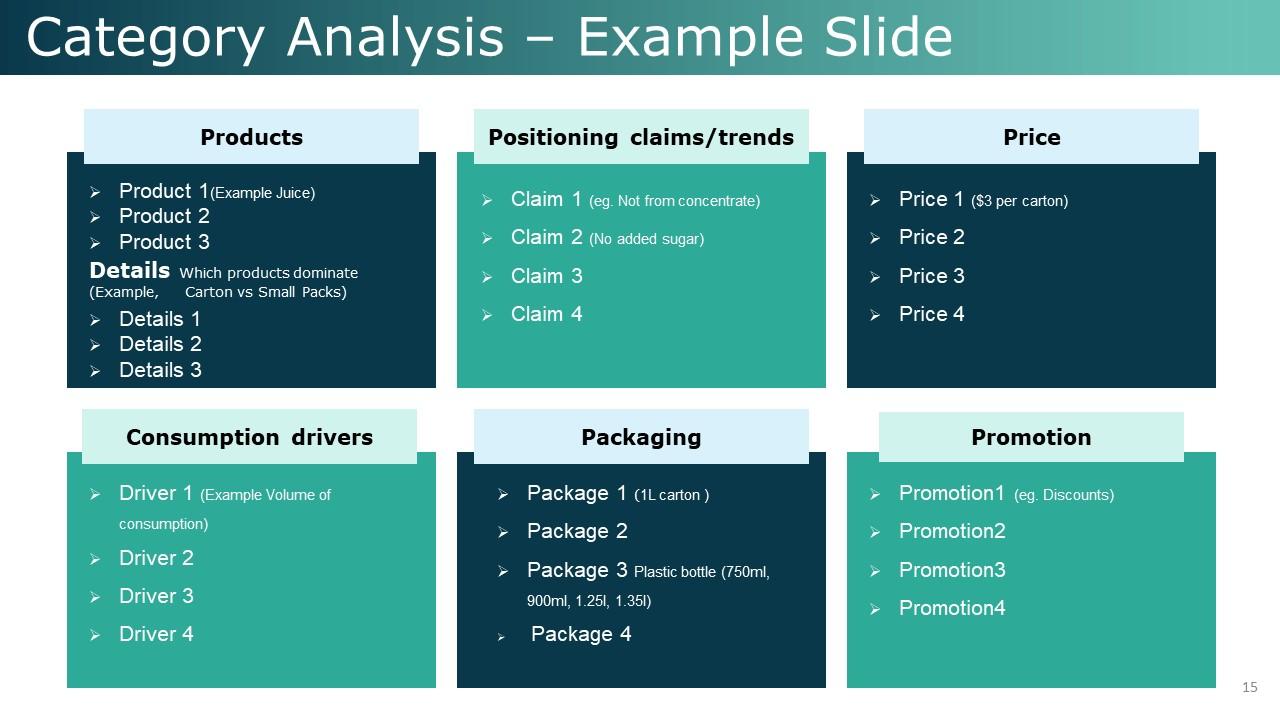
Slide 15: This slide shows Category Analysis – Example Slide with these feature to use- Products, Positioning claims/trends, Price, Consumption drivers, Packaging, Promotion.
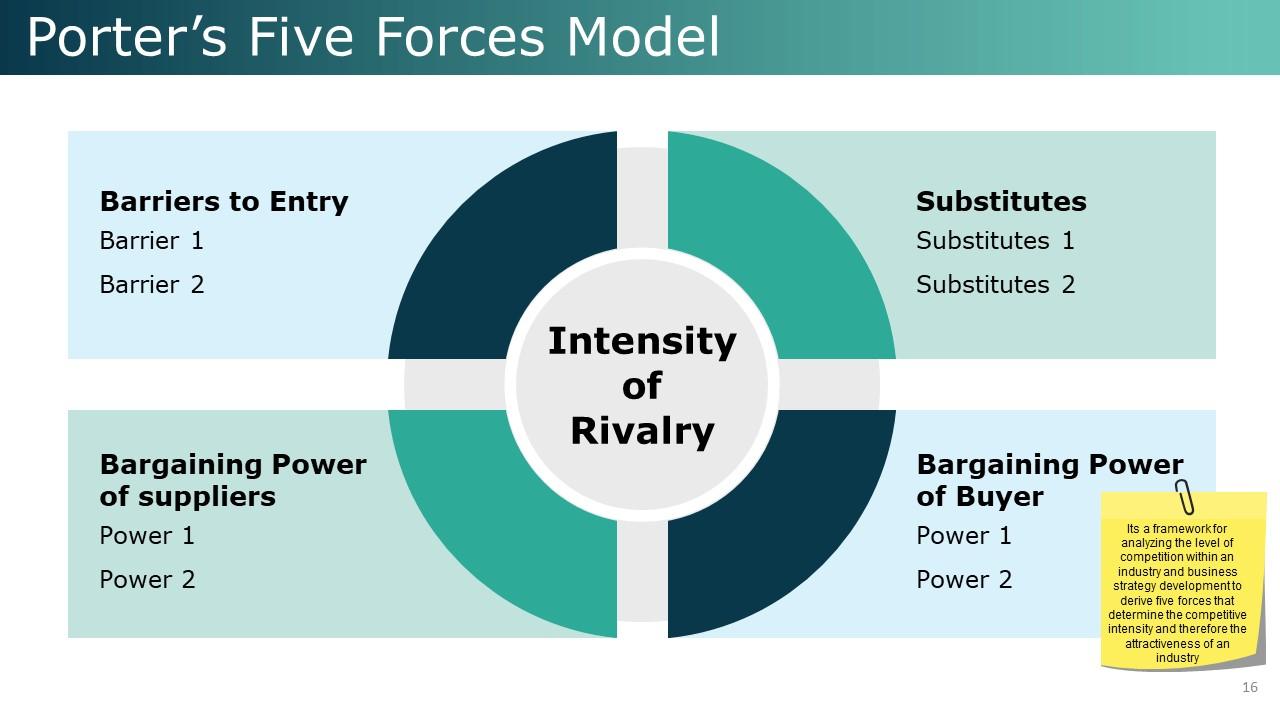
Slide 16: This slide showcases Porter’s Five Forces Model Bargaining Power of suppliers, Bargaining Power of Buyer, Barriers to Entry, Substitutes, Intensity of Rivalry, Its a framework for analyzing the level of competition within an industry and business strategy development to derive five forces that determine the competitive intensity and therefore the attractiveness of an industry
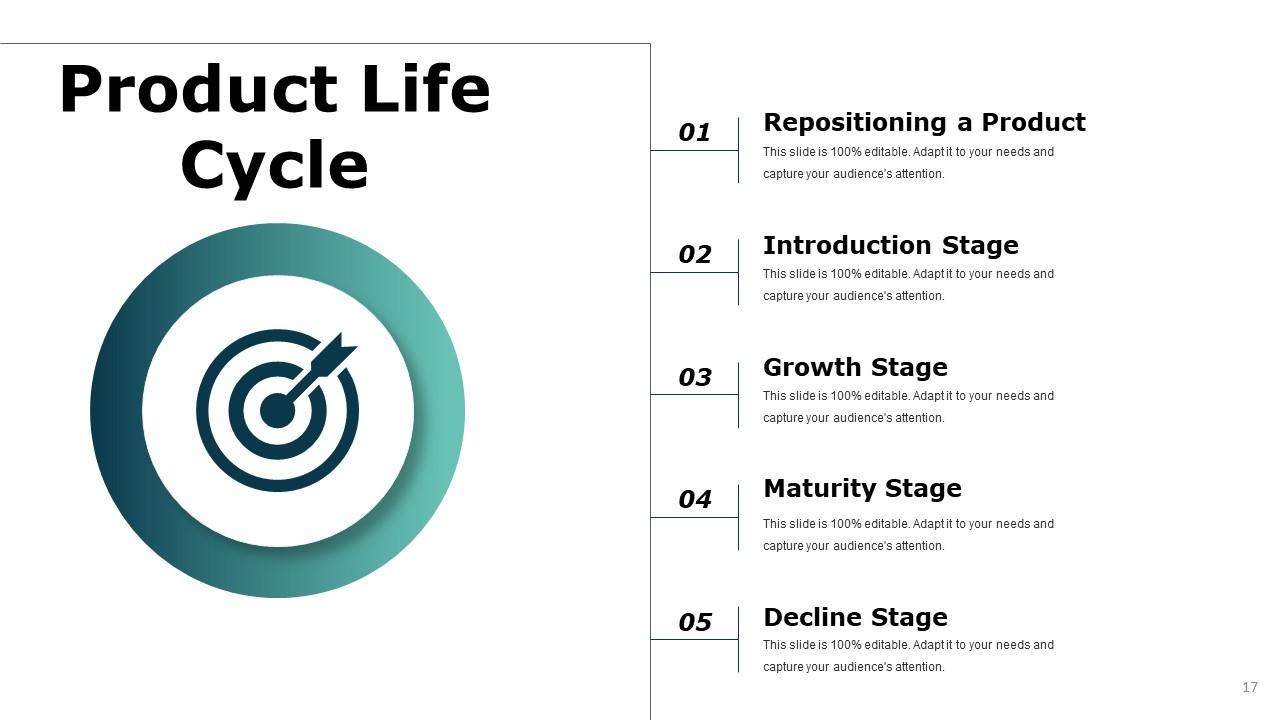
Slide 17: This slide presents Product Life Cycle with this five steps- Repositioning a Product, Introduction Stage, Decline Stage, Maturity Stage, Growth Stage.
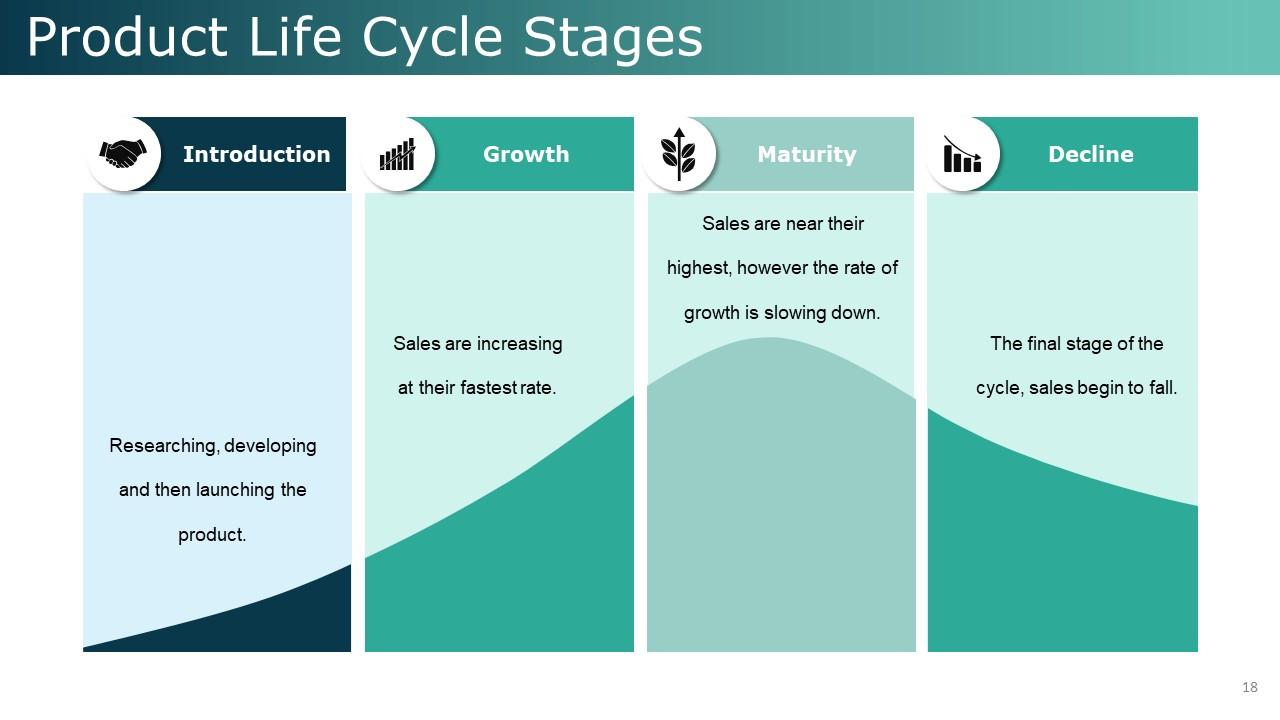
Slide 18: This slide shows Product Life Cycle Stages- Growth, Introduction, Maturity, Decline.
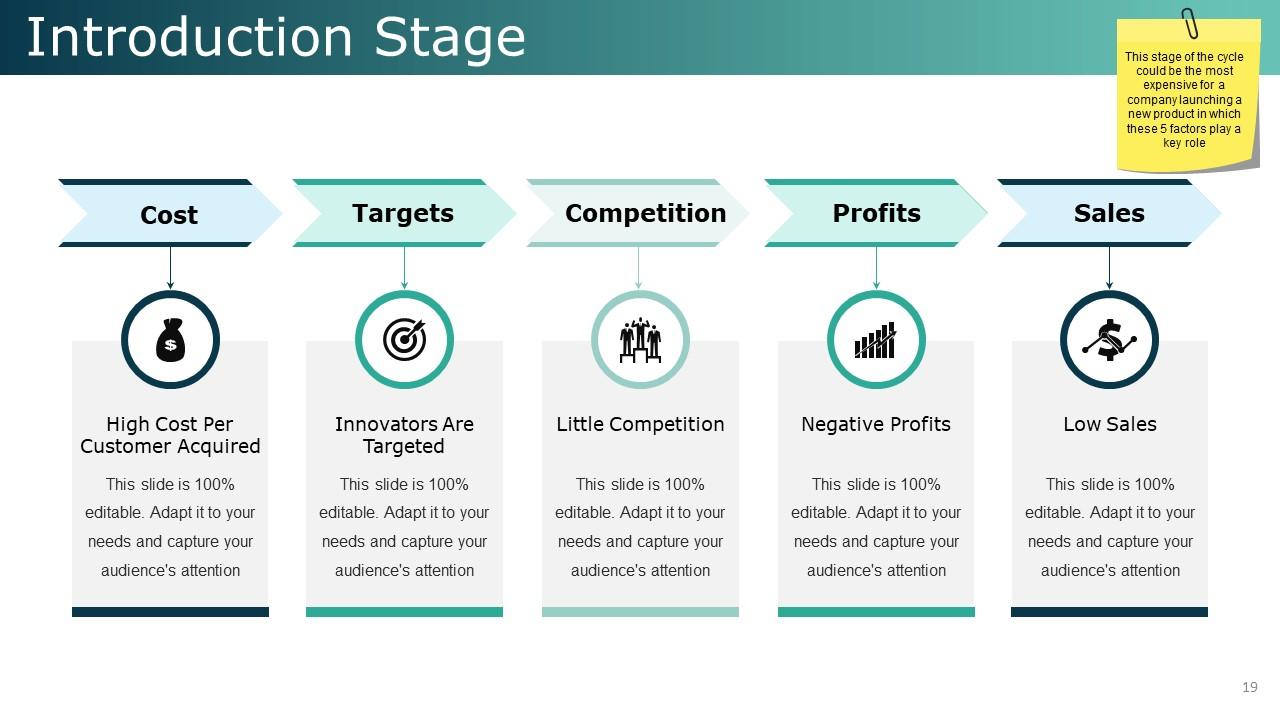
Slide 19: This slide showcases Introduction Stage Sales, Low Sales, Cost, Profits, Targets, This stage of the cycle could be the most expensive for a company launching a new product in which these 5 factors play a key role
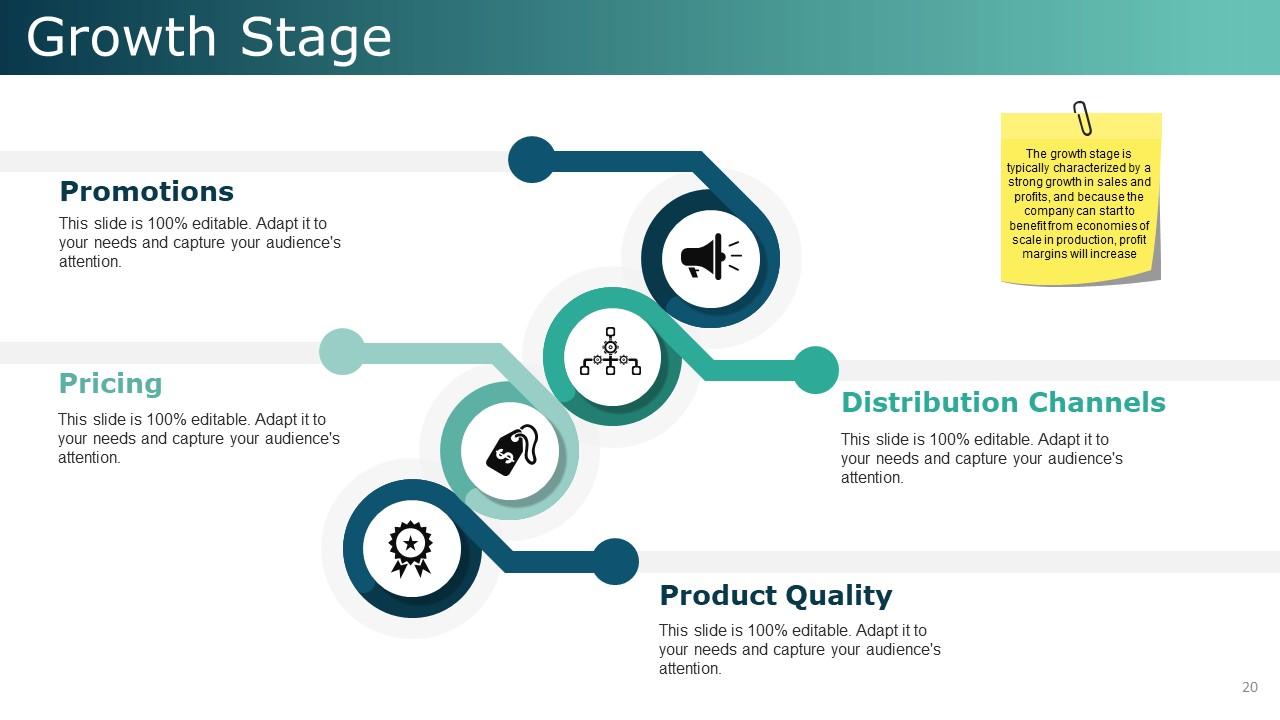
Slide 20: This slide shows Growth Stage with these four stages- Promotions, Pricing, Distribution Channels, Product Quality, The growth stage is typically characterized by a strong growth in sales and profits, and because the company can start to benefit from economies of scale in production, profit margins will increase
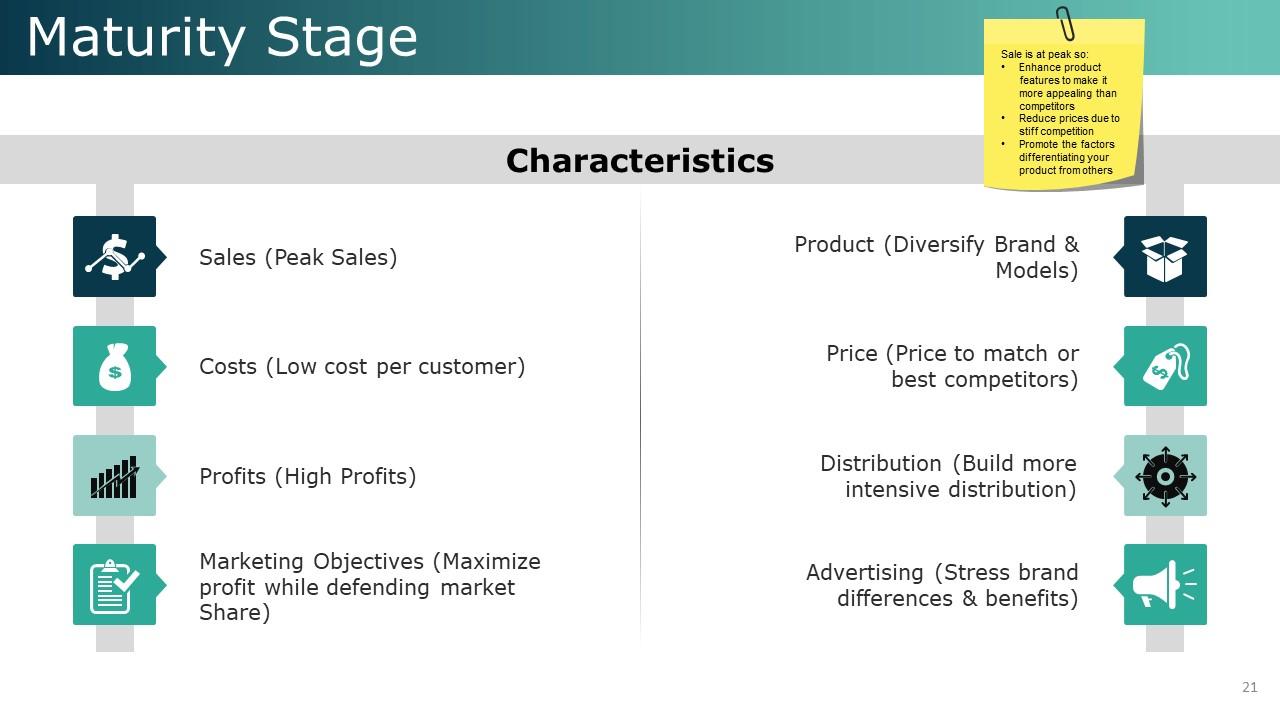
Slide 21: This slide presents Maturity Stage which further showcases Characteristics Sales (Peak Sales), Costs (Low cost per customer), Profits (High Profits), Marketing Objectives (Maximize profit while defending market Share), Product (Diversify Brand & Models), Price (Price to match or best competitors), Distribution (Build more intensive distribution), Advertising (Stress brand differences & benefits), Enhance product features to make it more appealing than competitors, Reduce prices due to stiff competition, Promote the factors differentiating your product from others.
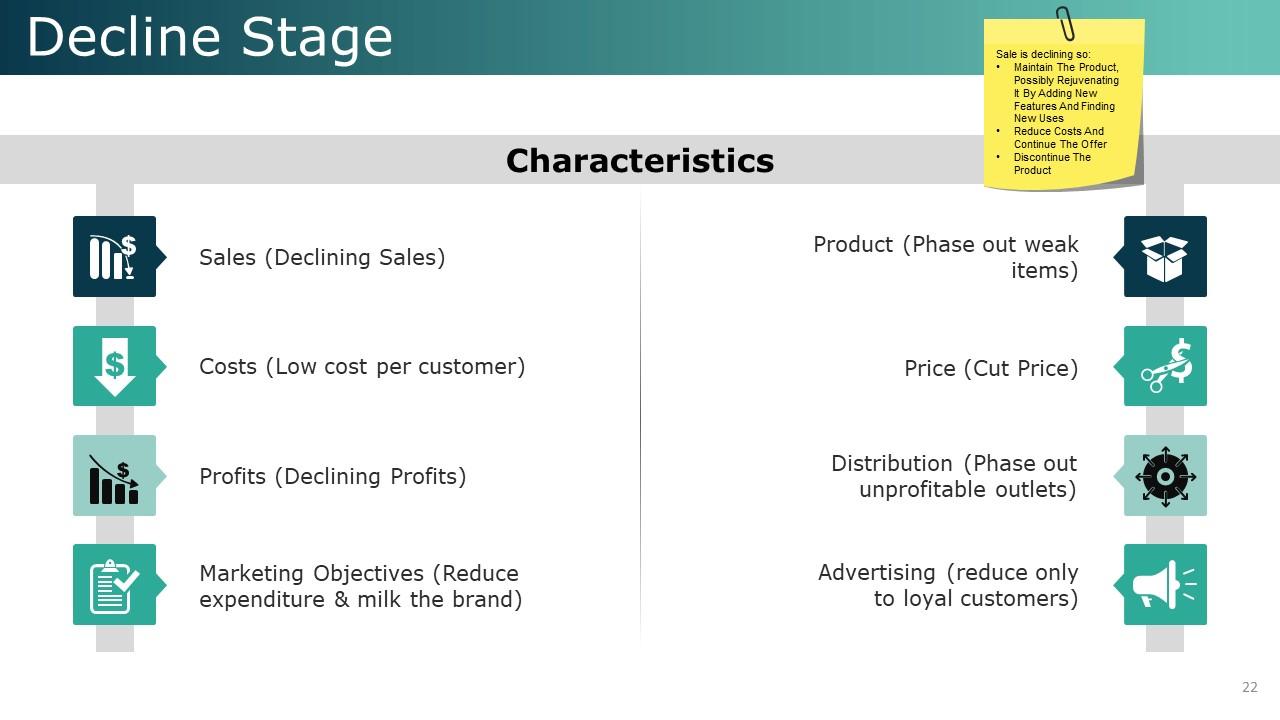
Slide 22: This slide shows Decline Stage which further shows Characteristics Marketing Objectives (Reduce expenditure & milk the brand), Sales (Declining Sales), Costs (Low cost per customer), Profits (Declining Profits), Product (Phase out weak items), Distribution (Phase out unprofitable outlets), Advertising (reduce only to loyal customers), Price (Cut Price), Maintain The Product, Possibly Rejuvenating It By Adding New Features And Finding New Uses, Reduce Costs And Continue The Offer, Discontinue The Product.
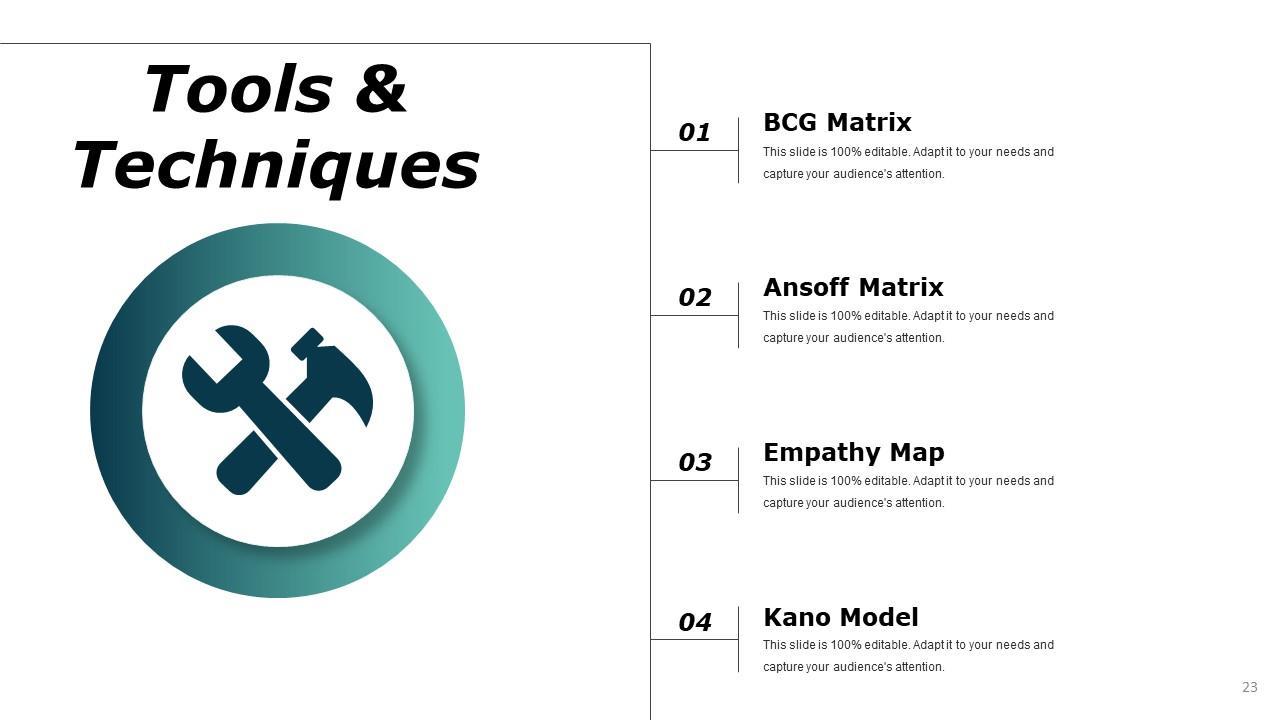
Slide 23: This slide presents Tools & Techniques with these four criterias- BCG Matrix, Ansoff Matrix, Empathy Map, Kano Model.
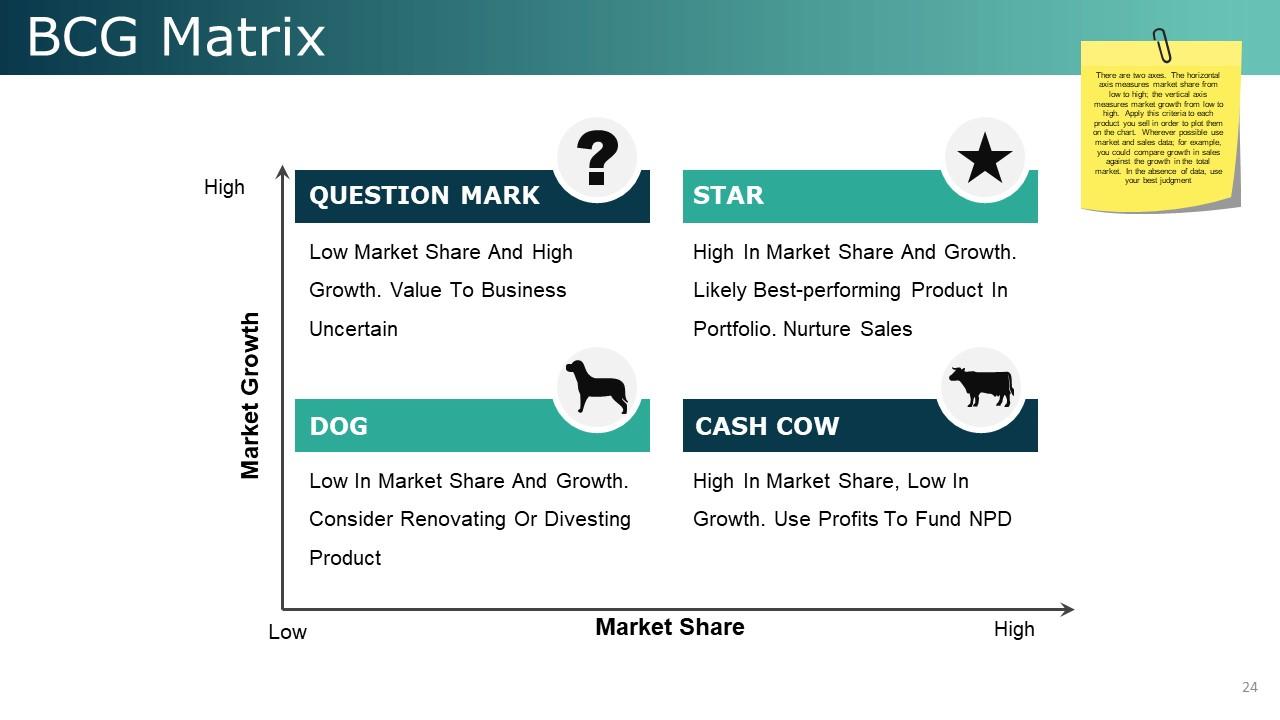
Slide 24: This slide presents BCG Matrix. There are two axes. The horizontal axis measures market share from low to high; the vertical axis measures market growth from low to high. Apply this criteria to each product you sell in order to plot them on the chart. Wherever possible use market and sales data; for example, you could compare growth in sales against the growth in the total market. In the absence of data, use your best judgment
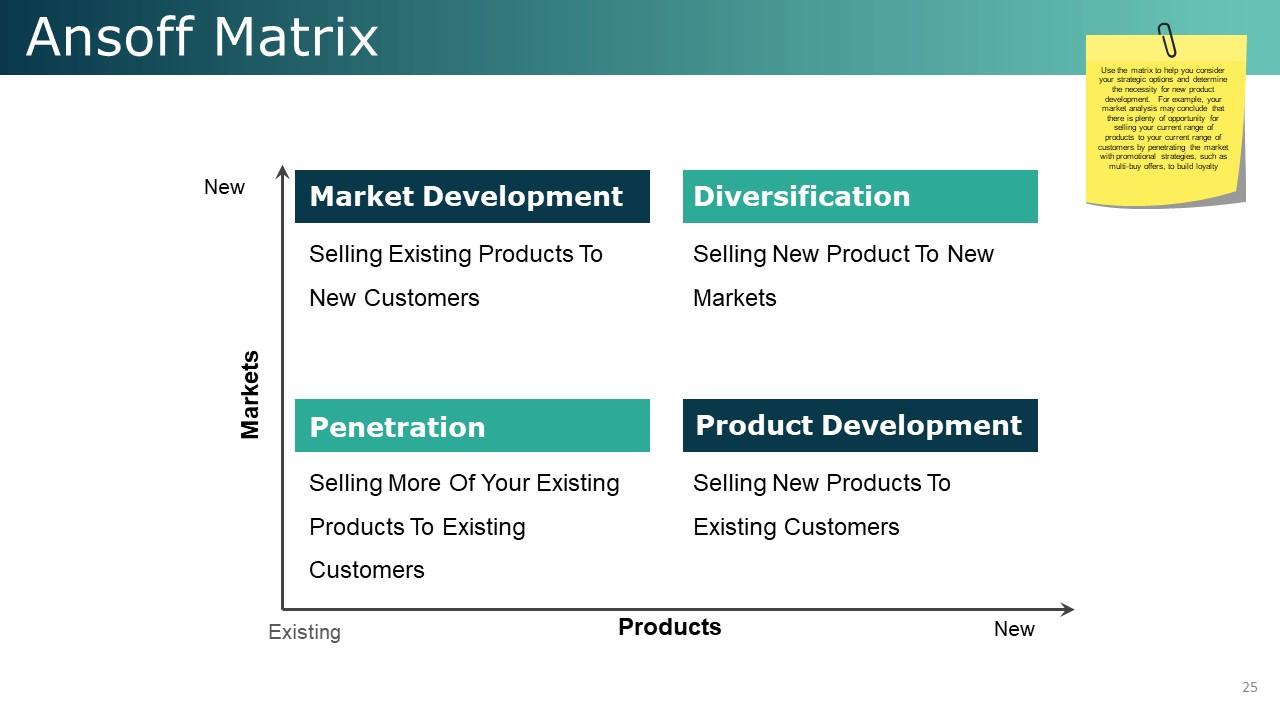
Slide 25: This slide presents Ansoff Matrix. Use the matrix to help you consider your strategic options and determine the necessity for new product development. For example, your market analysis may conclude that there is plenty of opportunity for selling your current range of products to your current range of customers by penetrating the market with promotional strategies, such as multi-buy offers, to build loyalty
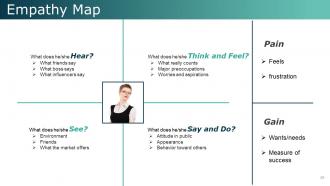
Slide 26: This slide presents Empathy Map which you can use and make it as per your requirement.
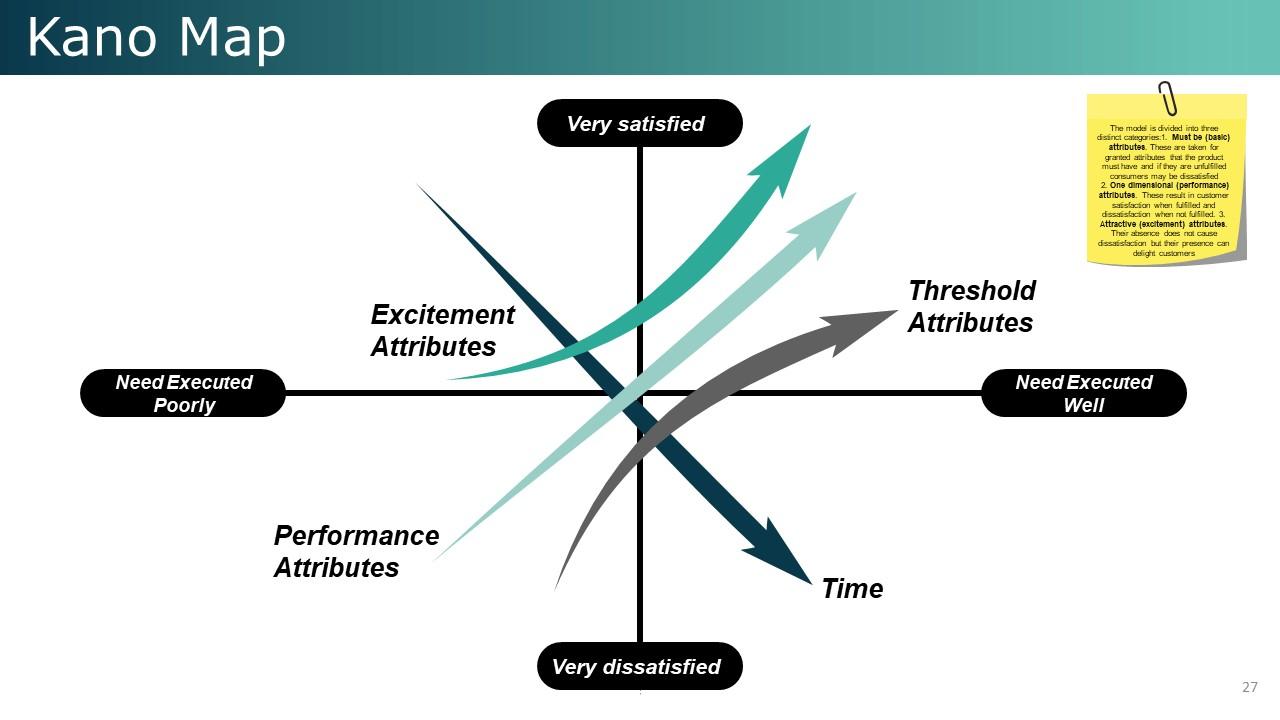
Slide 27: This slide showcases Kano Map with these features with which you can analyse- Excitement Attributes, Performance Attributes, Time, Threshold Attributes, Need Executed Poorly, Need Executed Well, Very satisfied, Very dissatisfied, The model is divided into three distinct categories:1. Must be (basic) attributes. These are taken for granted attributes that the product must have and if they are unfulfilled consumers may be dissatisfied 2. One dimensional (performance) attributes. These result in customer satisfaction when fulfilled and dissatisfaction when not fulfilled. 3. Attractive (excitement) attributes. Their absence does not cause dissatisfaction but their presence can delight customers
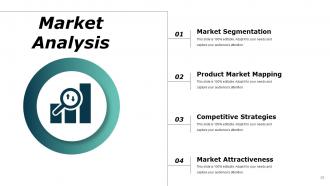
Slide 28: This slide presents Market Analysis these four factors you ca consider- Market Segmentation, Product Market Mapping, Competitive Strategies, Market Attractiveness.
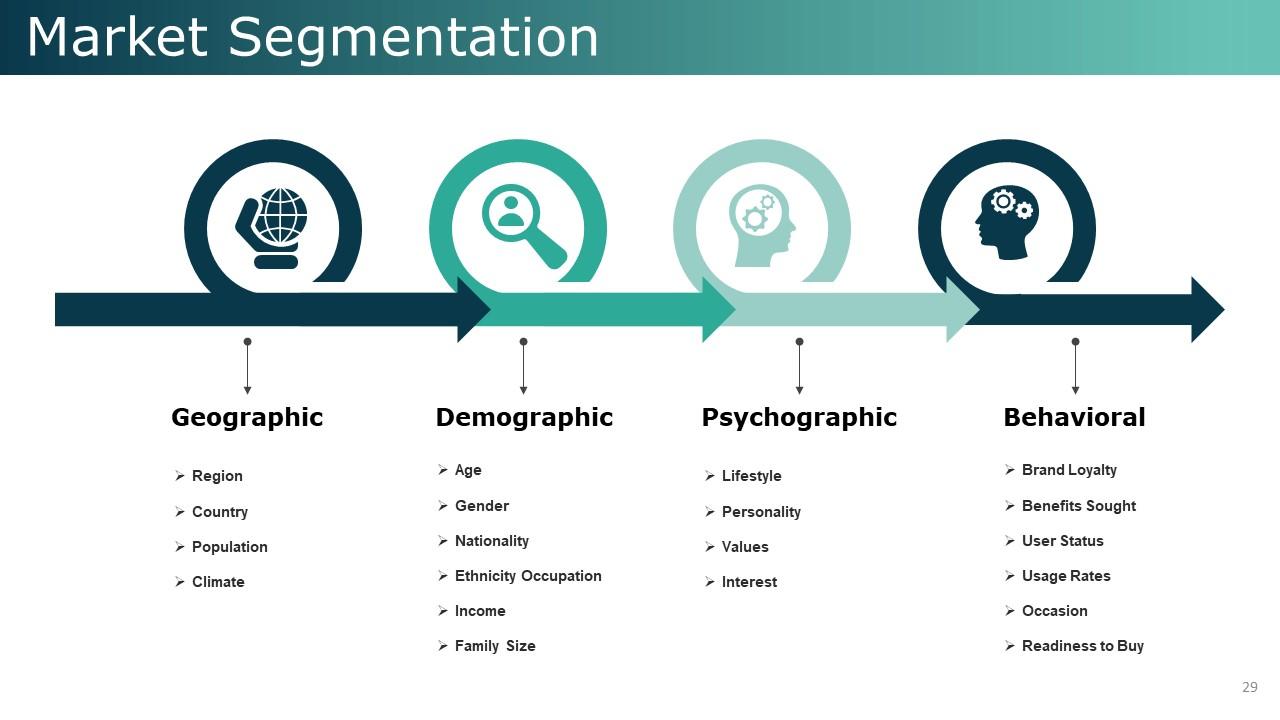
Slide 29: This slide presents Market Segmentation with these main categories- Geographic, Demographic, Psychographic, Behavioral.
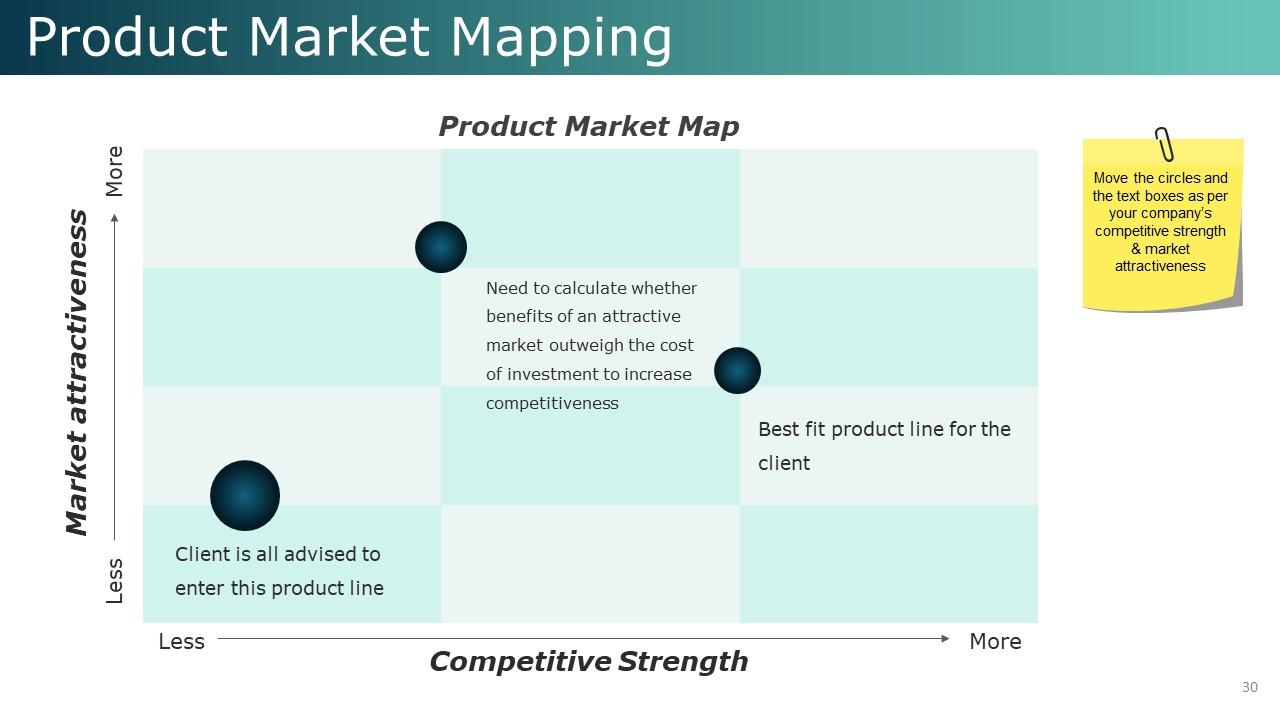
Slide 30: This slide showcases Product Market Mapping which further includes these main points- Product Market Map, Market attractiveness, Competitive Strength, Best fit product line for the client, Client is all advised to enter this product line, Need to calculate whether benefits of an attractive market outweigh the cost of investment to increase competitiveness.
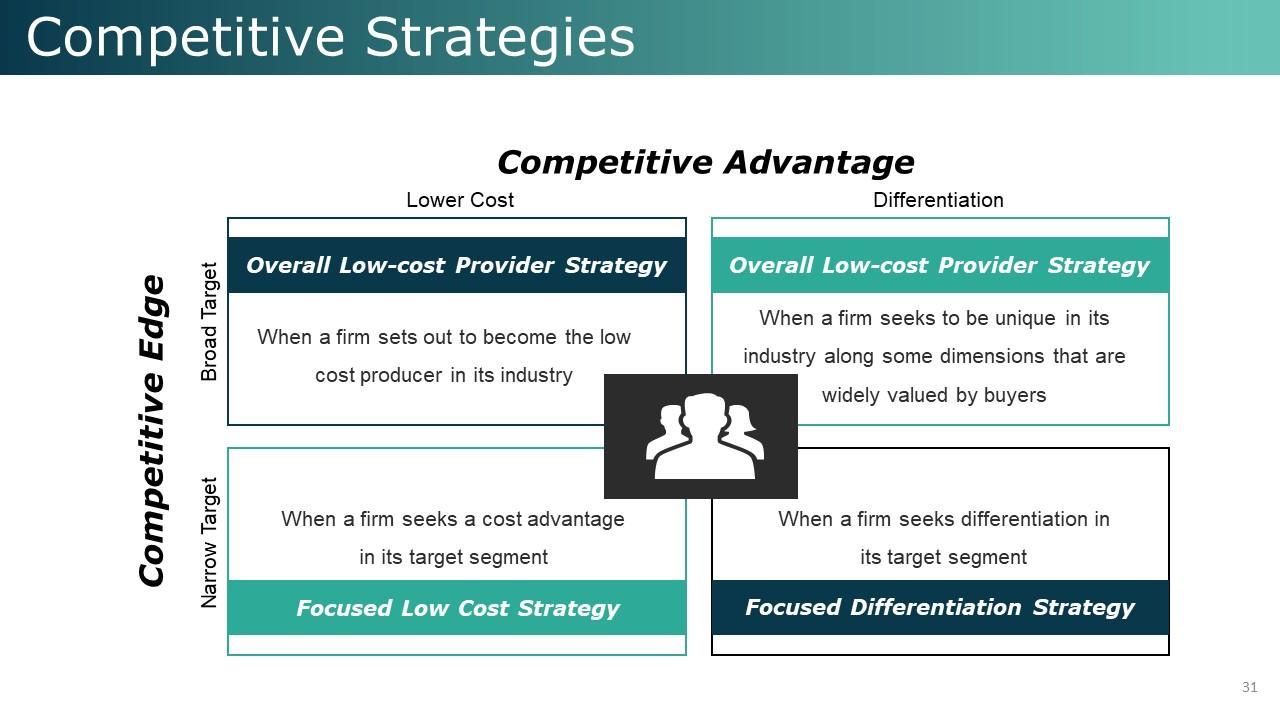
Slide 31: This slide presents Competitive Strategies with these import categories we have listed- Overall Low-cost Provider Strategy, Overall Low-cost Provider Strategy, Focused Differentiation Strategy, Focused Low Cost Strategy, When a firm seeks to be unique in its industry along some dimensions that are widely valued by buyers, When a firm seeks differentiation in its target segment, When a firm seeks a cost advantage in its target segment, When a firm sets out to become the low cost producer in its industry, Competitive Edge, Narrow Target, Broad Target, Lower Cost, Differentiation, Competitive Advantage.
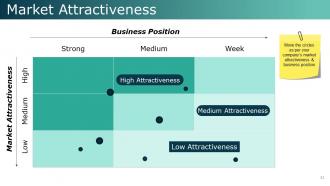
Slide 32: This slide presents Market Attractiveness with these parameters- Medium, High, Low, Business Position, Market Attractiveness, High Attractiveness, Medium Attractiveness, Low Attractiveness.
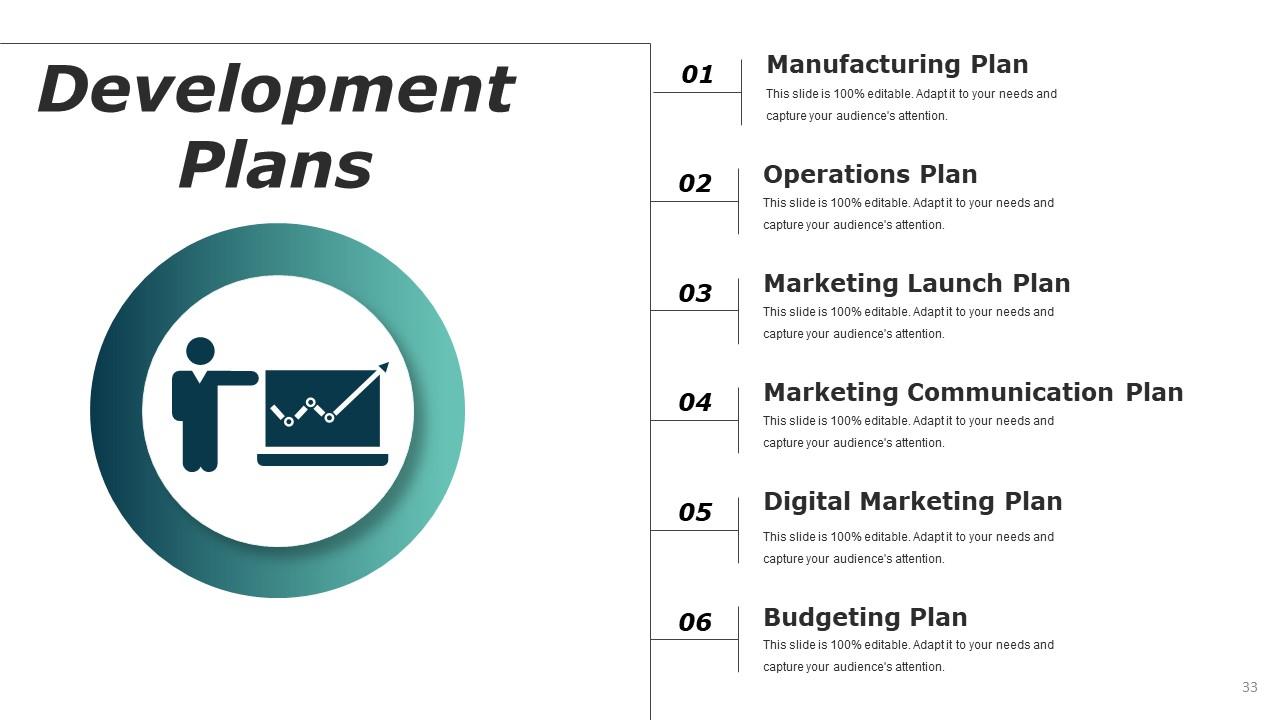
Slide 33: This slide shows Development Plans which further showing different categories- Operations Plan, Marketing Launch Plan, Marketing Communication Plan, Digital Marketing Plan, Budgeting Plan, Manufacturing Plan.
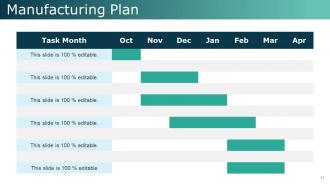
Slide 34: This slide showcases Manufacturing Plan. You can add the content in this plan as you want.
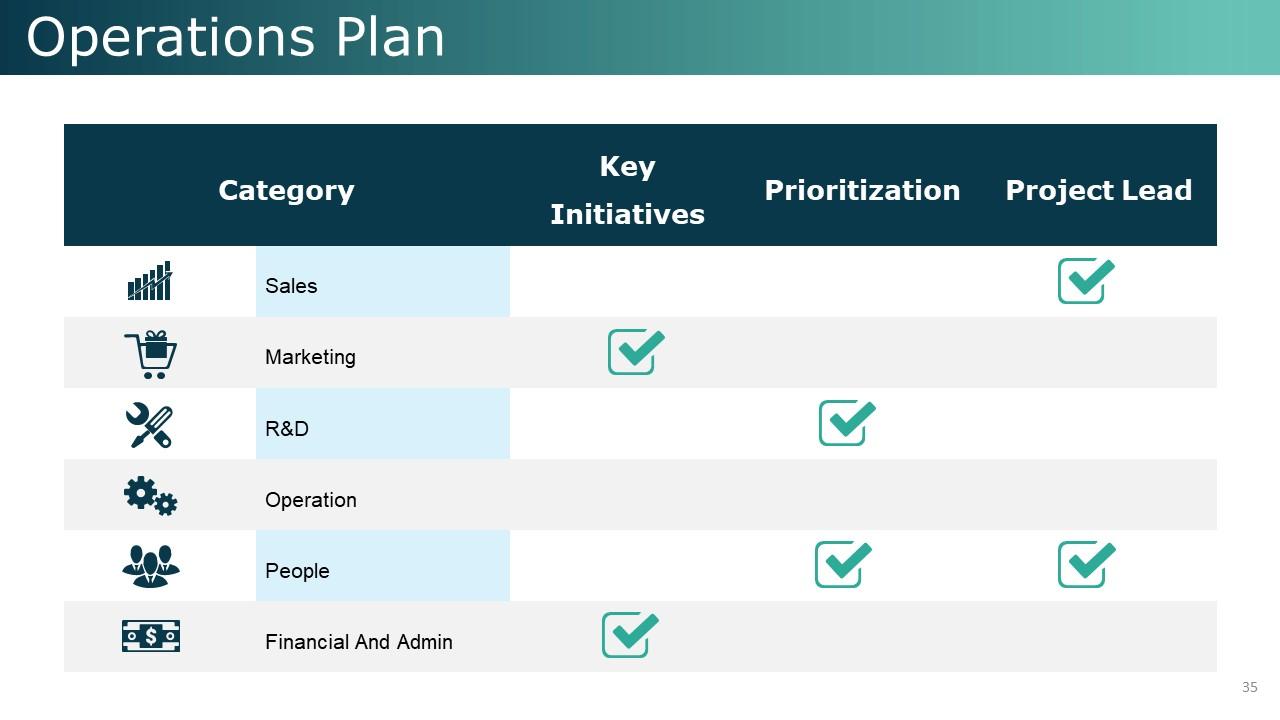
Slide 35: This slide presents Operations Plan with categories. You can add the categories as per your requirement.
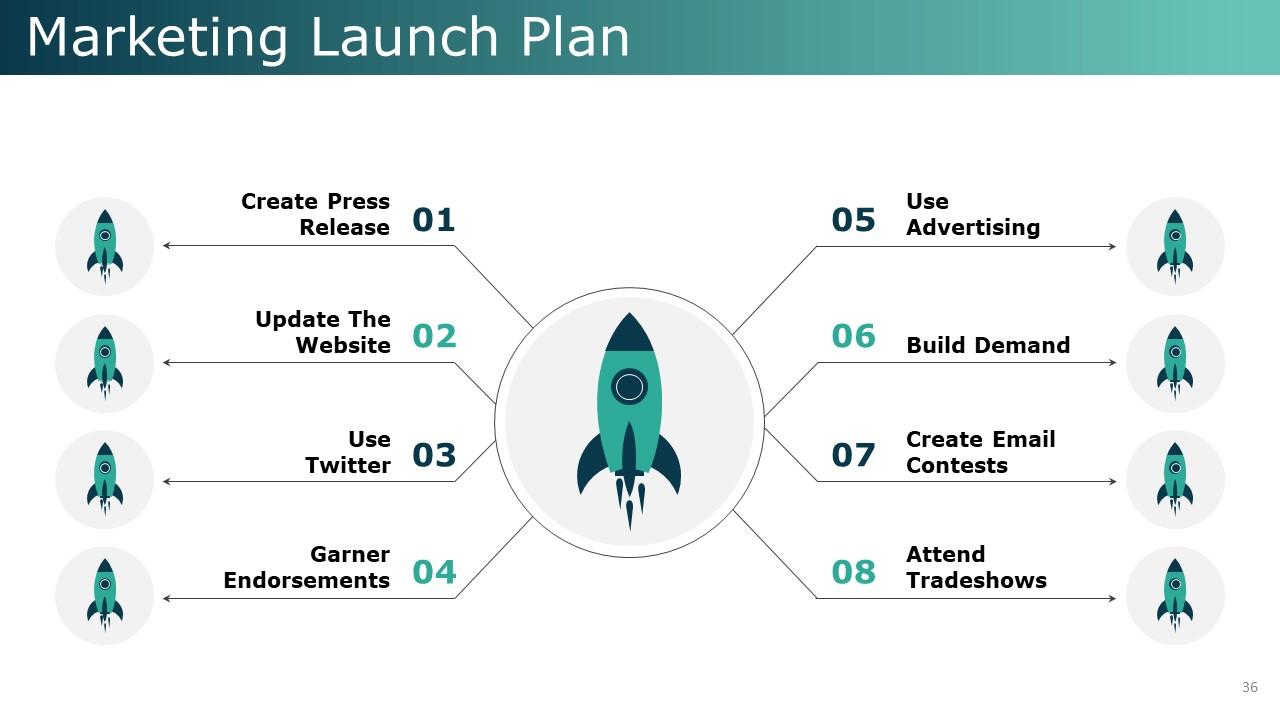
Slide 36: This slide showcases Marketing Launch Plan Create Press Release, Update The Website, Use Twitter, Garner Endorsements, Use Advertising, Build Demand, Create Email Contests, Attend Tradeshows.
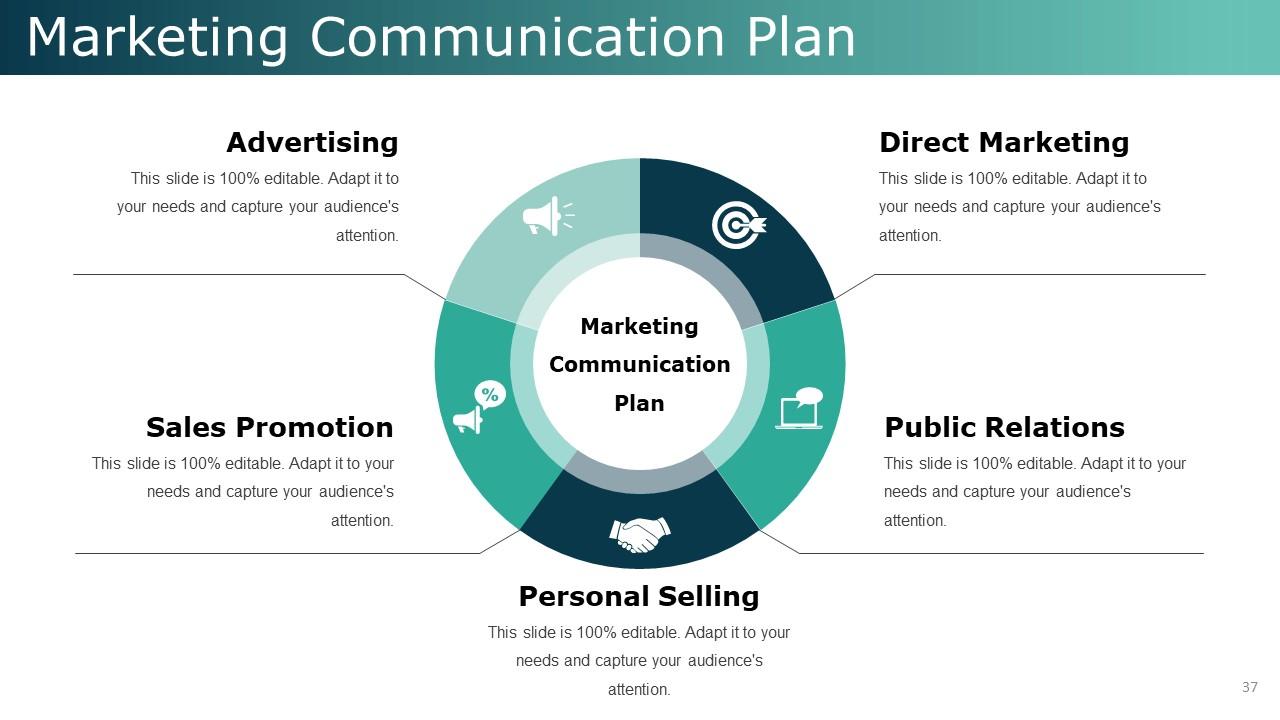
Slide 37: This slide shows Marketing Communication Plan- Marketing Communication Plan, Advertising, Sales Promotion, Personal Selling, Direct Marketing, Public Relations.
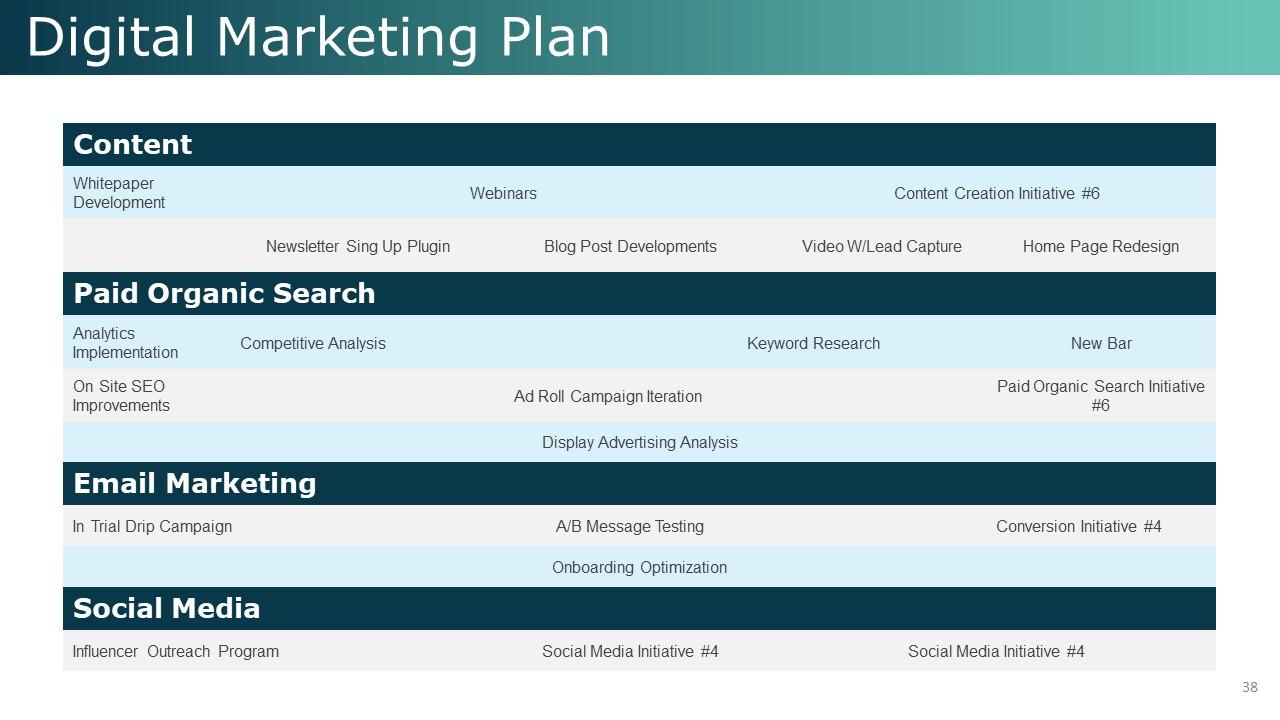
Slide 38: This slide presents Digital Marketing Plan. With this you can add your marketing plan or add content in it.
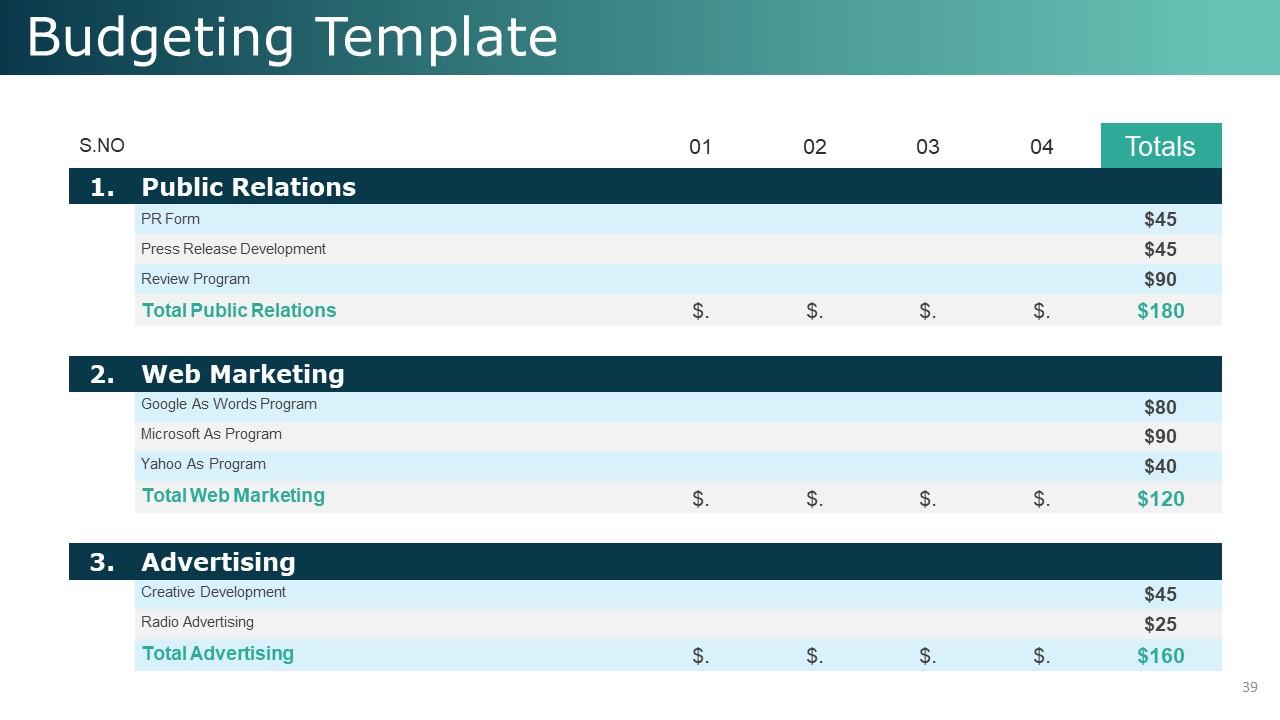
Slide 39: This slide is about Budgeting Template. Add your own budget and categories as per your requirement.
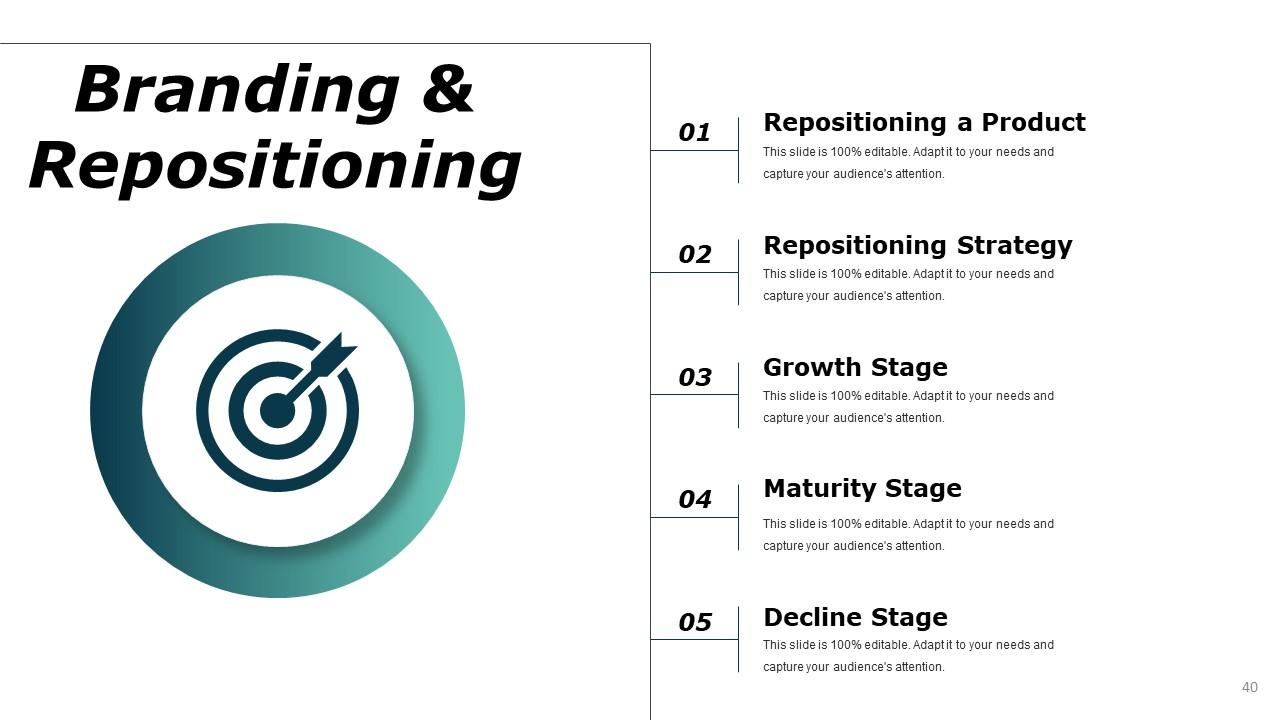
Slide 40: This slide presents Branding & Repositioning with these five points to consider- Repositioning a Product, Repositioning Strategy, Decline Stage, Maturity Stage, Growth Stage.
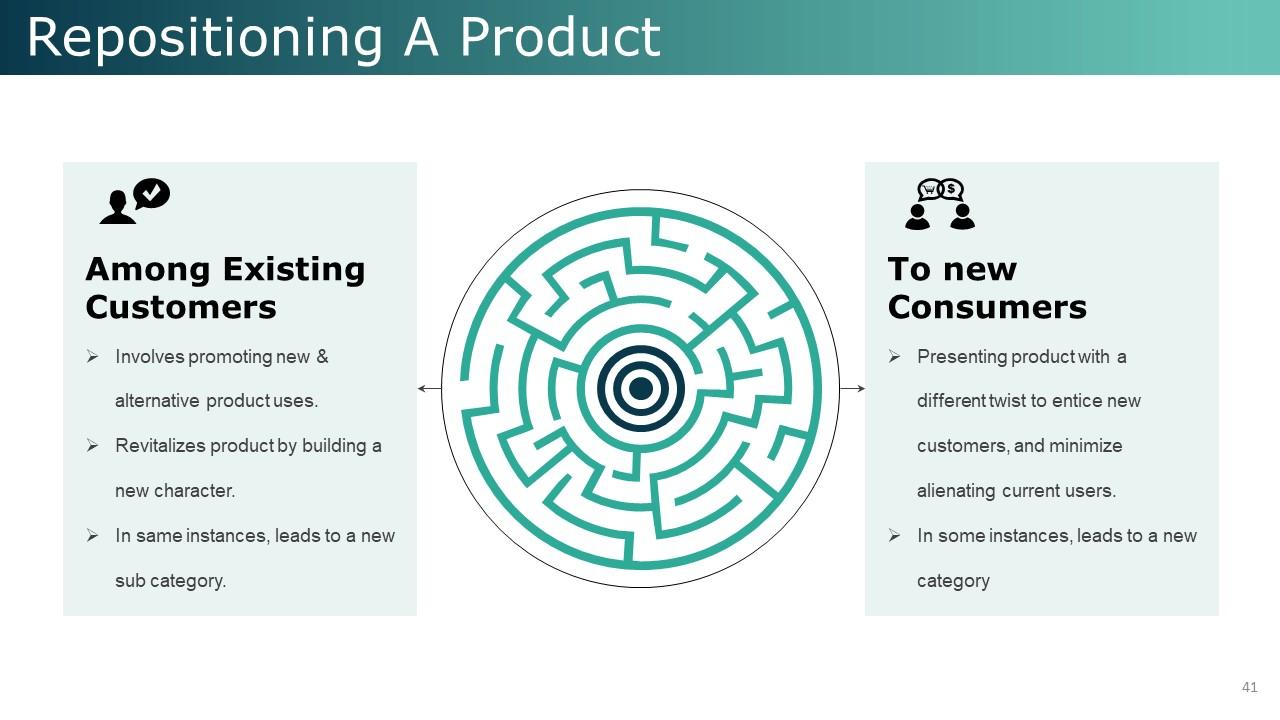
Slide 41: This slide presents Repositioning A Product which further includes- Involves promoting new & alternative product uses, Revitalizes product by building a new character, In same instances, leads to a new sub category, Among Existing Customers, Presenting product with a different twist to entice new customers, and minimize alienating current users, In some instances, leads to a new category, To new Consumers.
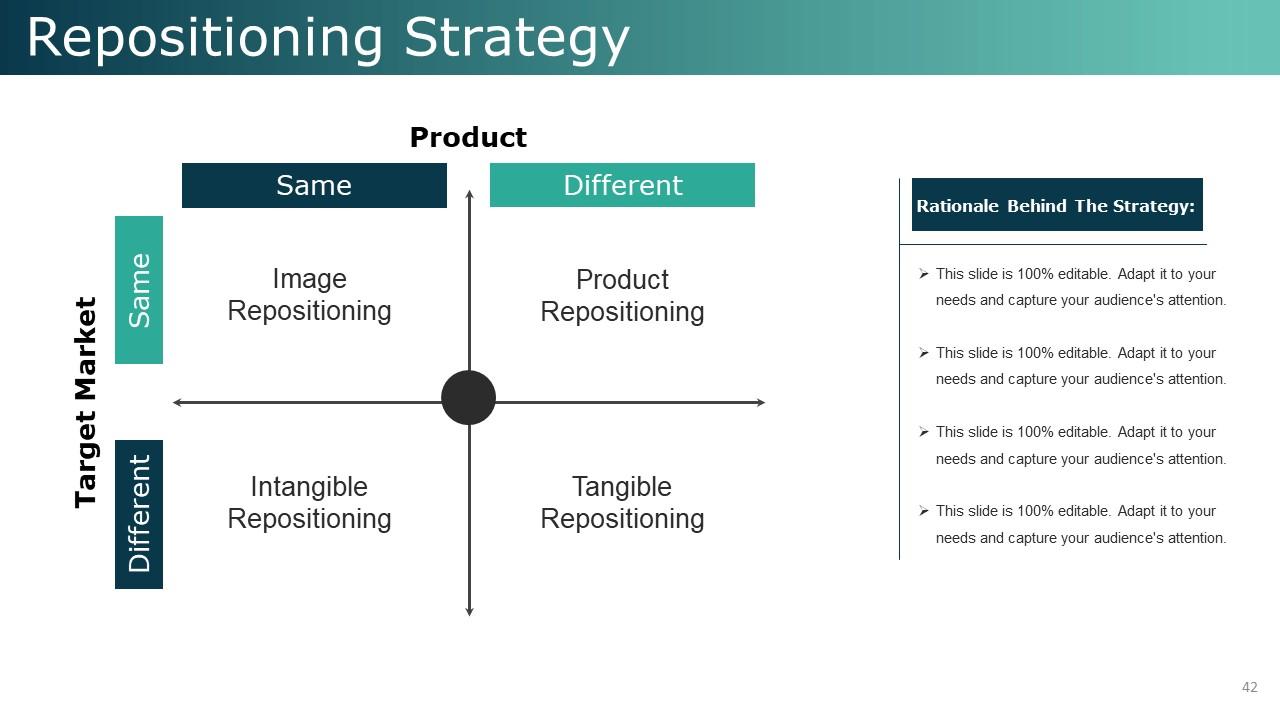
Slide 42: This slide presents Repositioning Strategy with these following lised parameters- Same, Different, Product Repositioning, Image Repositioning, Intangible Repositioning, Tangible Repositioning, Rationale Behind The Strategy, Product, Target Market.
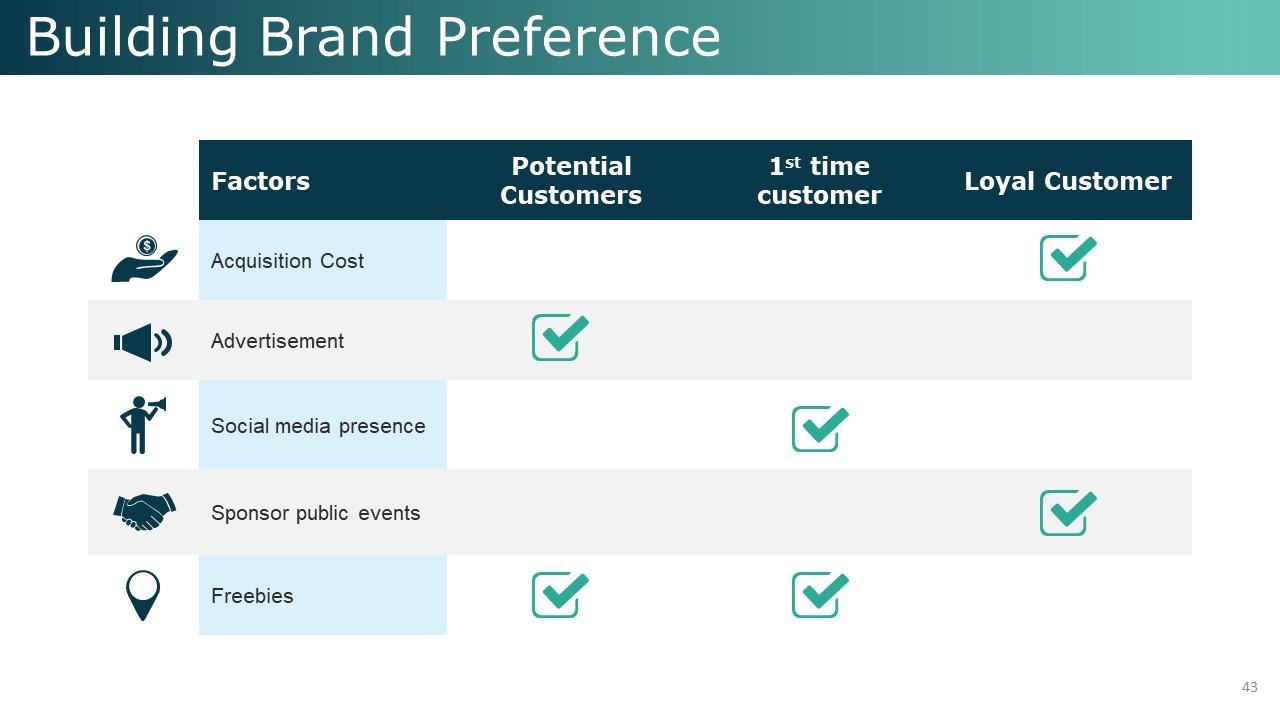
Slide 43: This slide presents Building Brand Preference. You can use these factors as such or use it with changes.
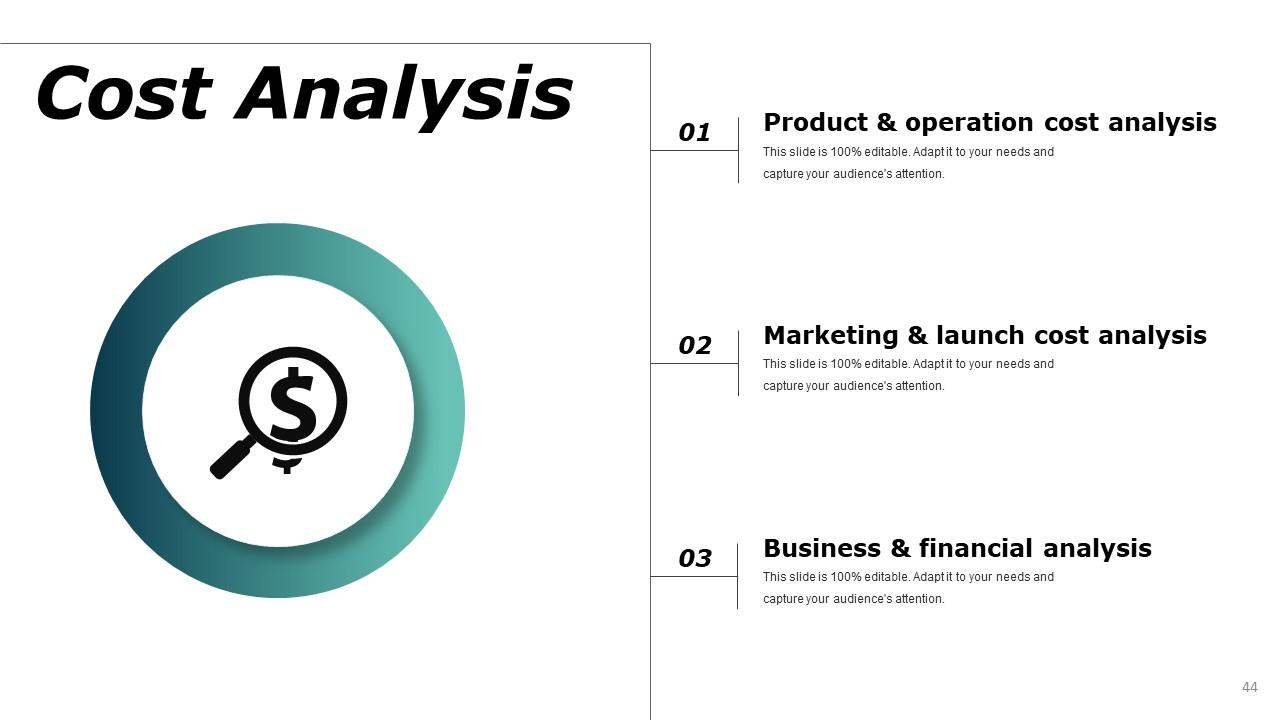
Slide 44: This slide showcases Cost Analysis with these three analysis categories- Product & operation cost analysis, Marketing & launch cost analysis, Business & financial analysis.
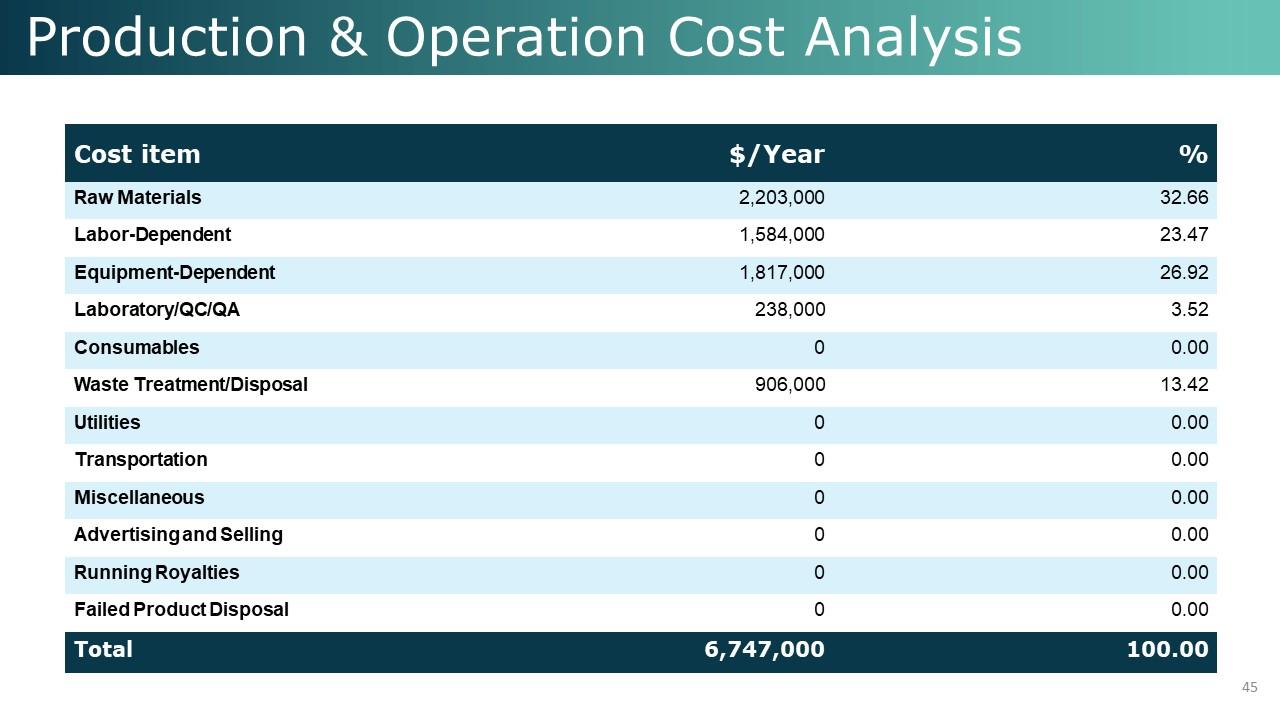
Slide 45: This slide shows Production & Operation Cost Analysis. With this table you can make your analysis more reliable and exact.
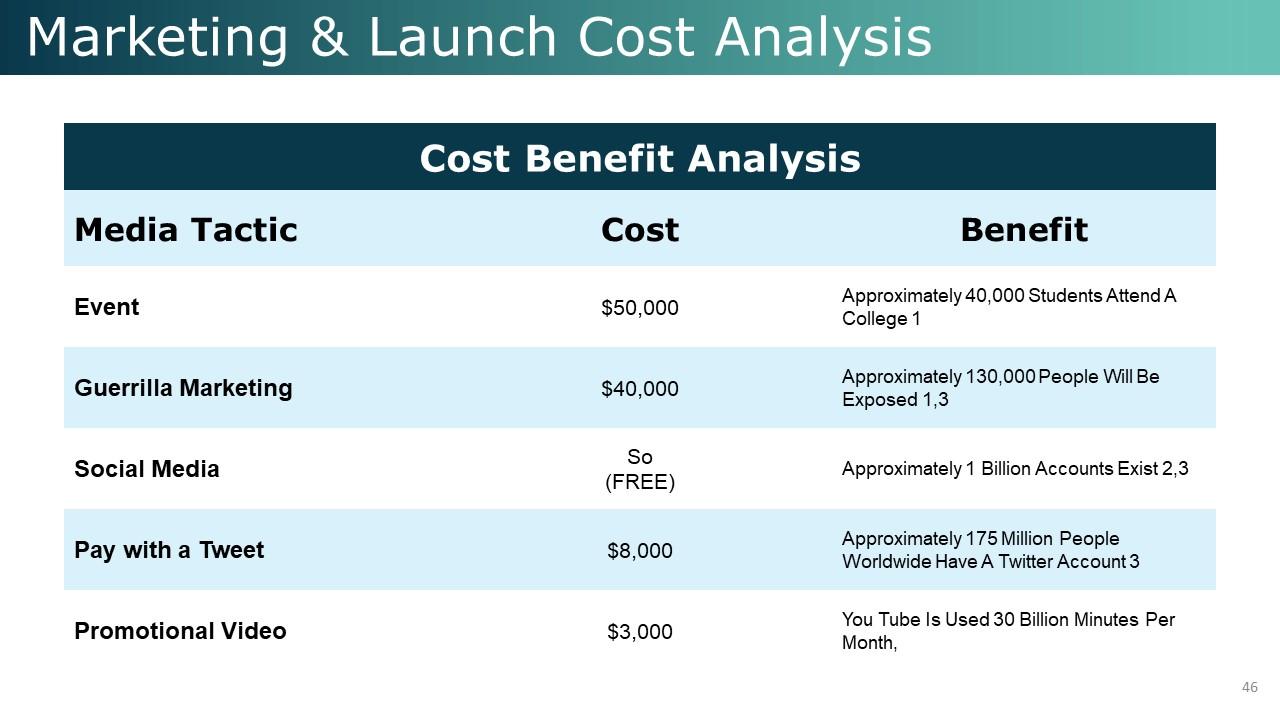
Slide 46: This slide presents Marketing & Launch Cost Analysis which further includes cost benefits analysis. Add your own content and use it.
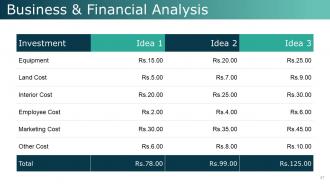
Slide 47: This slide showcases Business & Financial Analysis. we have made some of the investment categories.
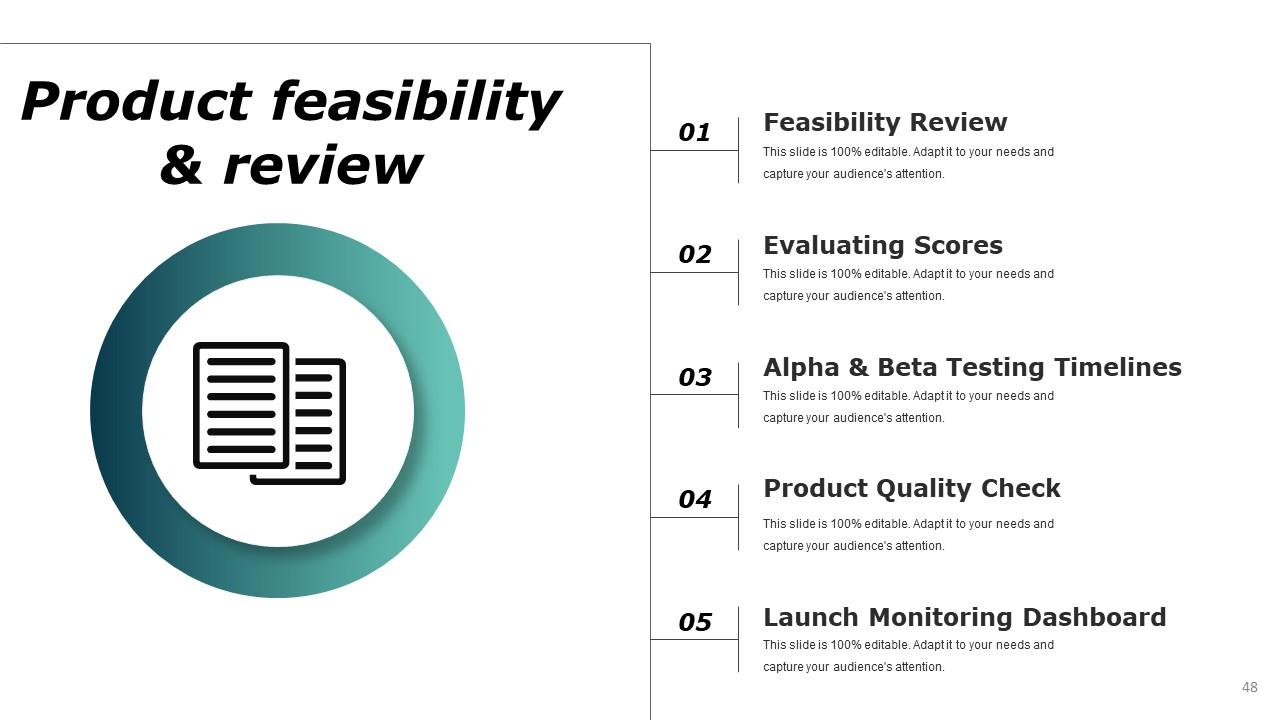
Slide 48: This slide presents Product feasibility & review with further these points- Feasibility Review, Evaluating Scores, Launch Monitoring Dashboard, Product Quality Check, Alpha & Beta Testing Timelines.
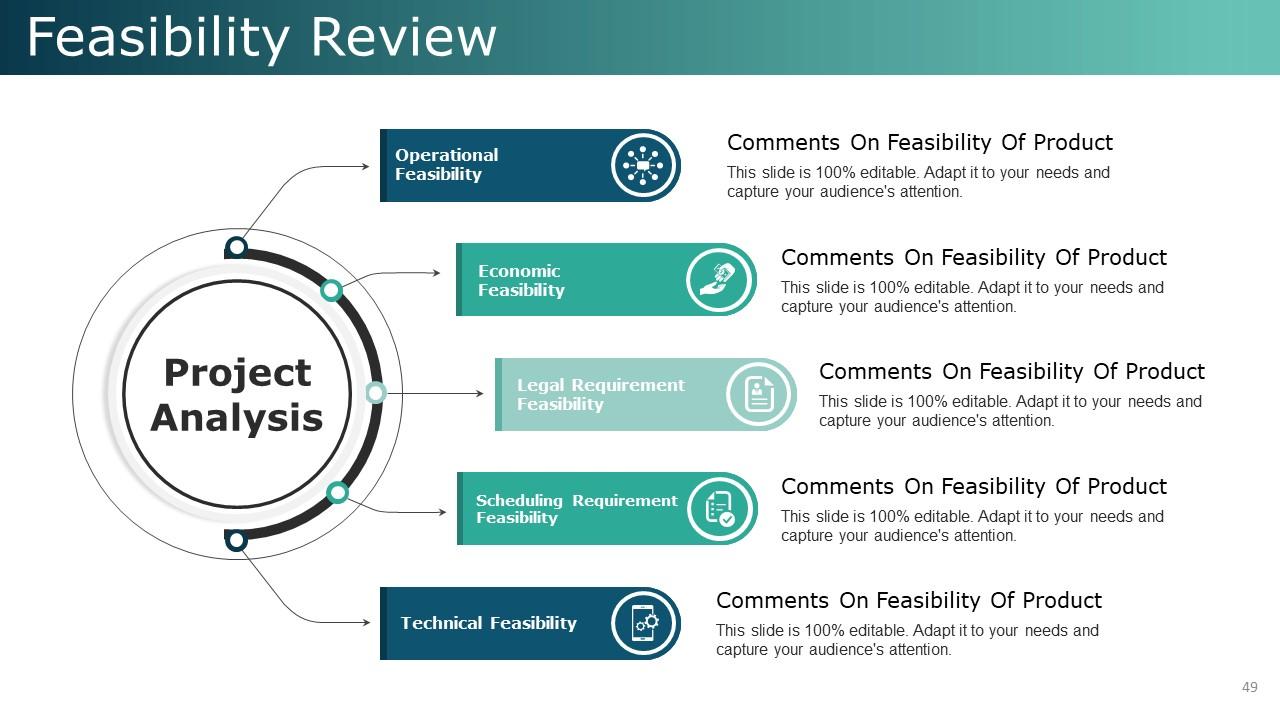
Slide 49: This slide presents Feasibility Review with these five categories- Scheduling Requirement Feasibility, Legal Requirement Feasibility, Economic Feasibility, Operational Feasibility, Technical Feasibility, Project Analysis.
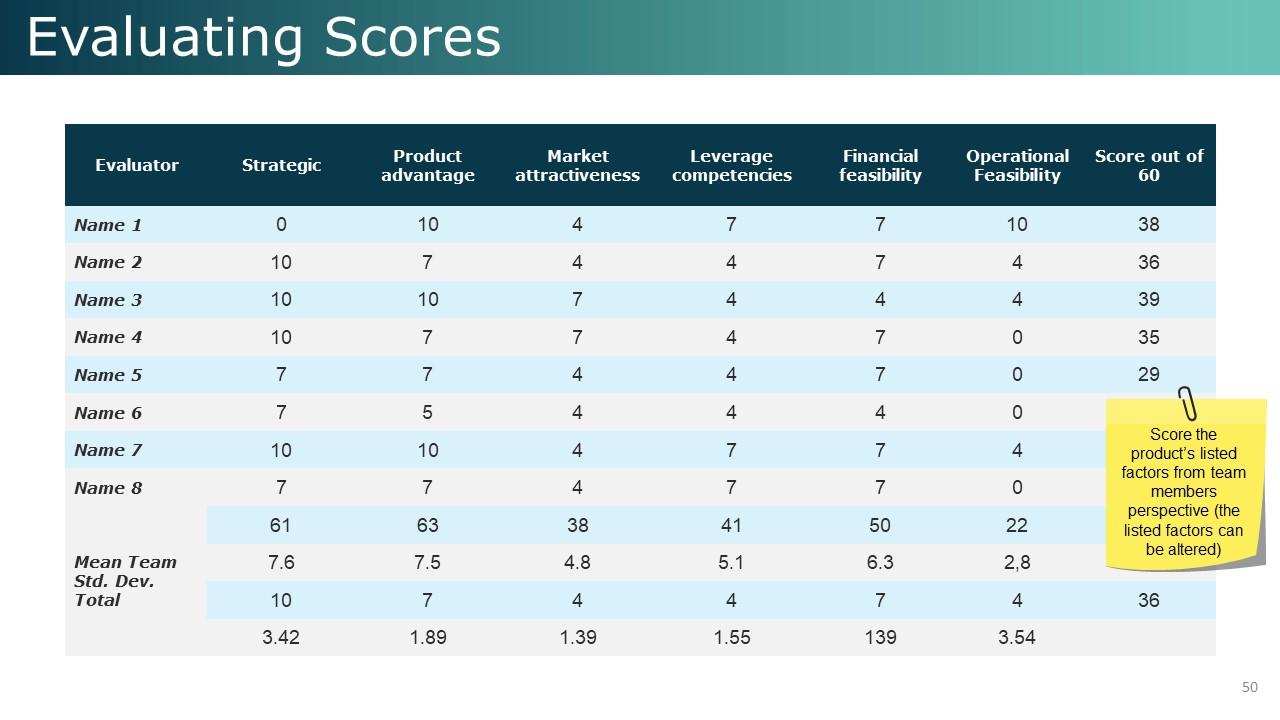
Slide 50: This slide presents Evaluating Scores.Score the product’s listed factors from team members perspective (the listed factors can be altered)
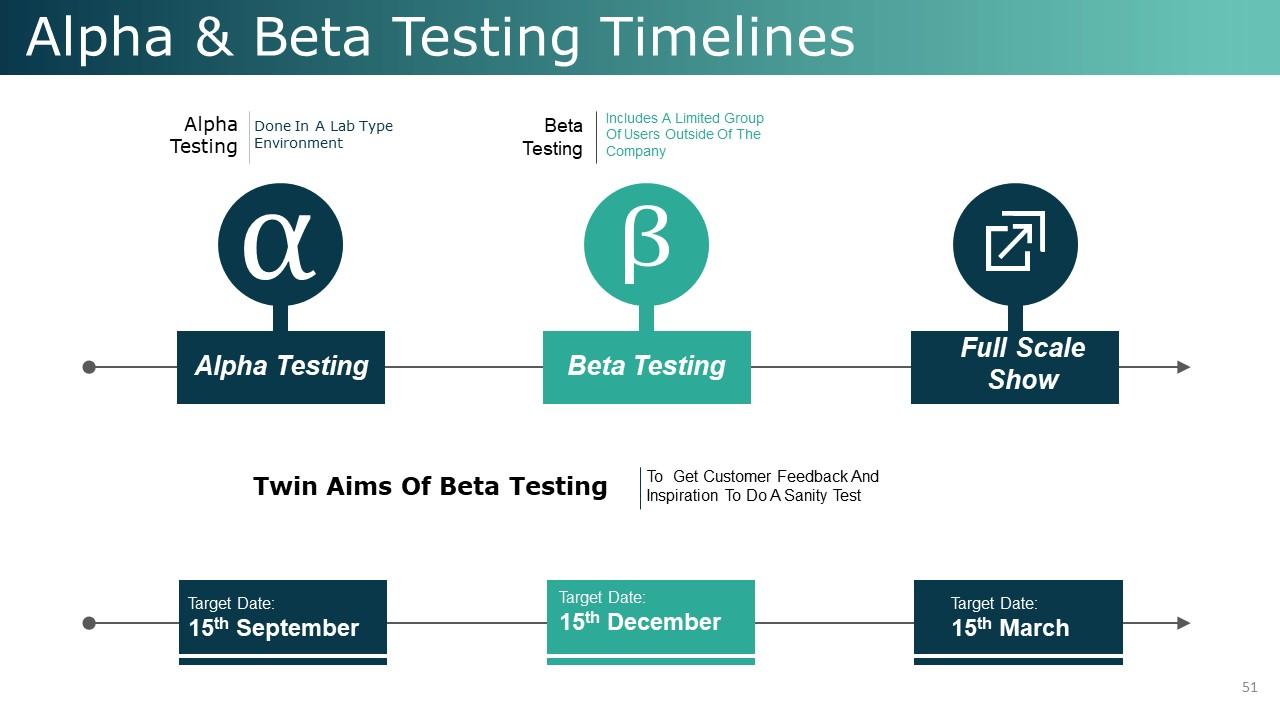
Slide 51: This slide showcases Alpha & Beta Testing Timelines. You can use this as per your requirement.
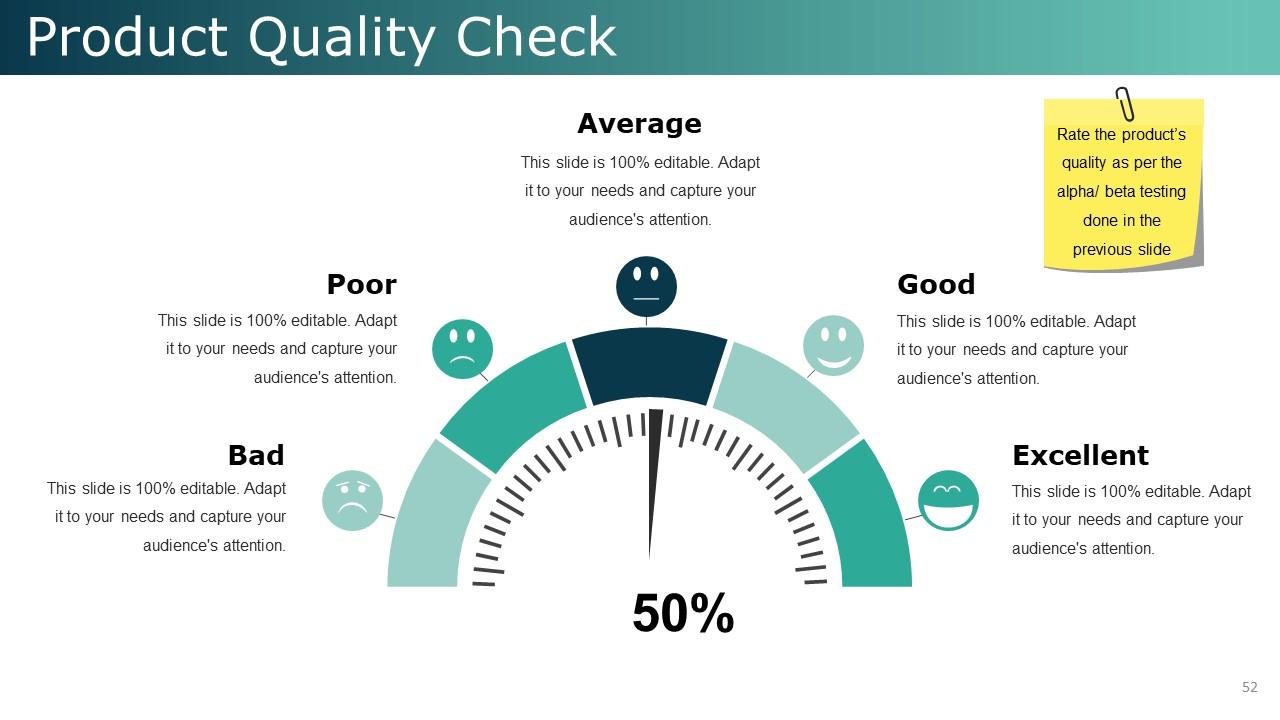
Slide 52: This slide presents Product Quality Check with these meter categories- Bad, Poor, Average, Good, Excellent, Rate the product’s quality as per the alpha/ beta testing done in the previous slide.
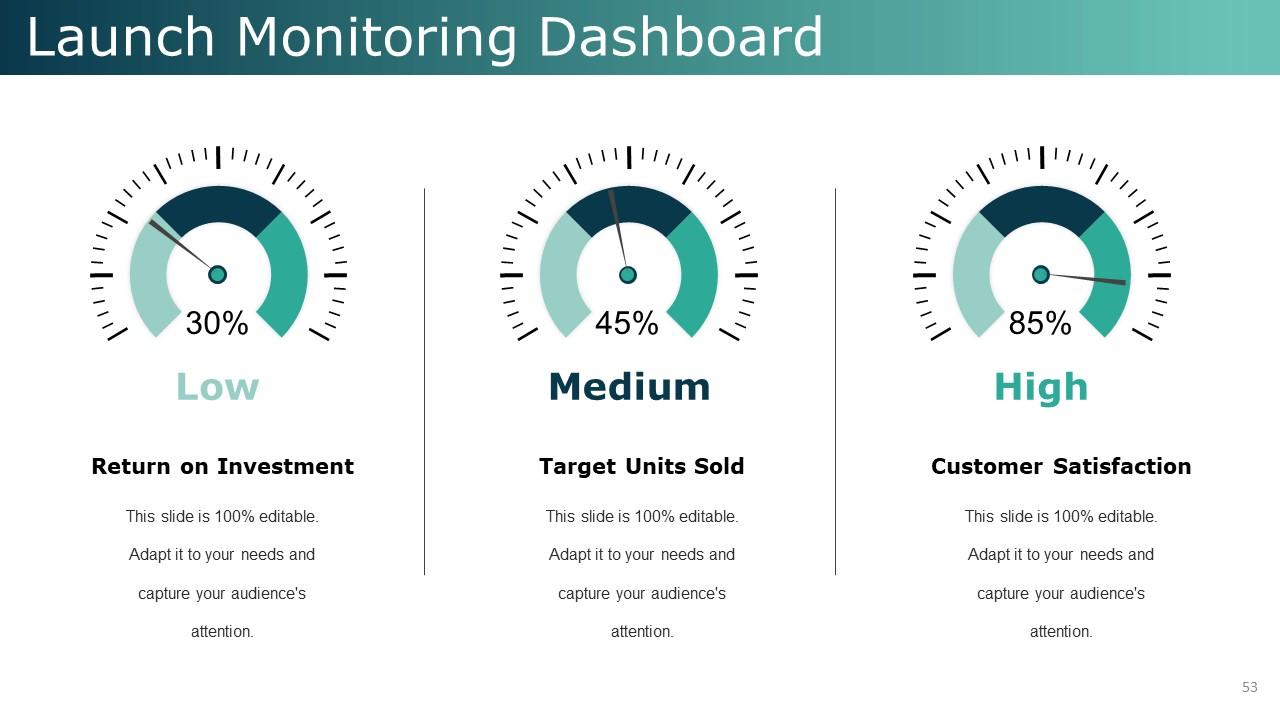
Slide 53: This slide is showing about Launch Monitoring Dashboard. Add your content and use it.
Slide 54: This slide is for Icon For NDP
Slide 55: This slide is titled Additional Slides.
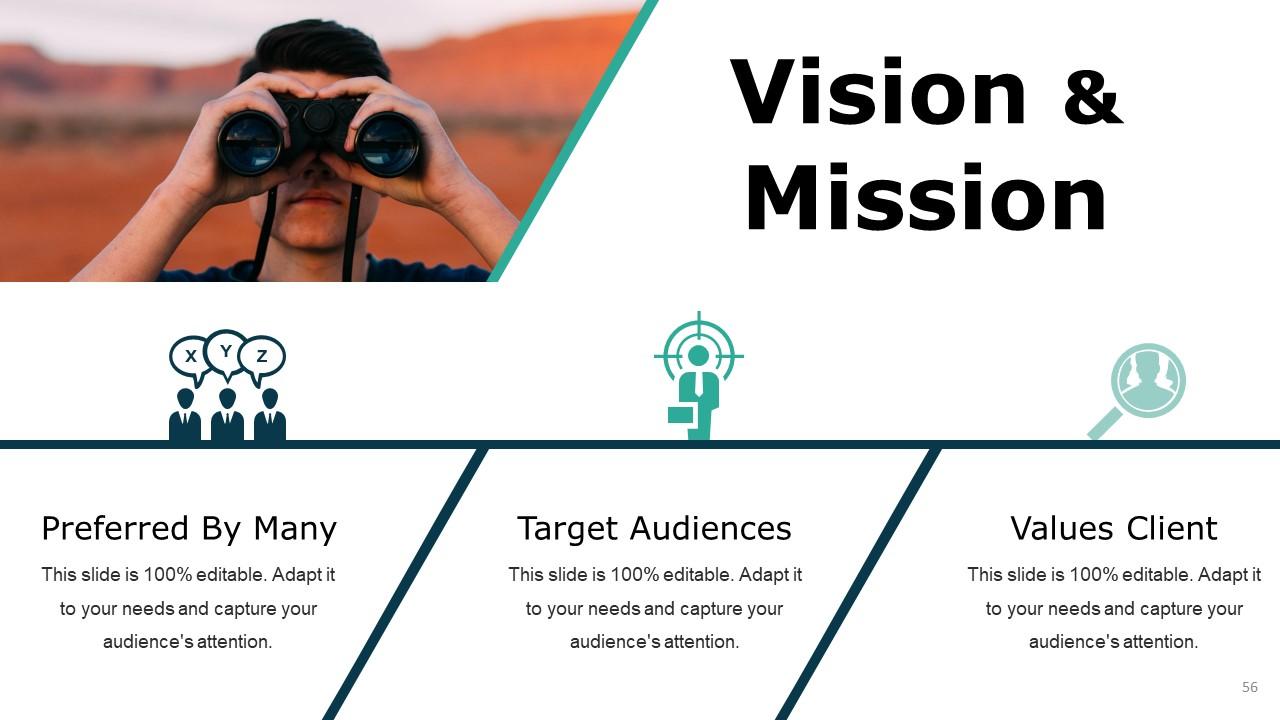
Slide 56: This slide represents Our Mission. State your mission, goals etc.
Slide 57: This slide showcases Our Team with Name and Designation to fill.
Slide 58: This slide helps show- About Our Company. The sub headings include- Creative Design, Customer Care, Expand Company
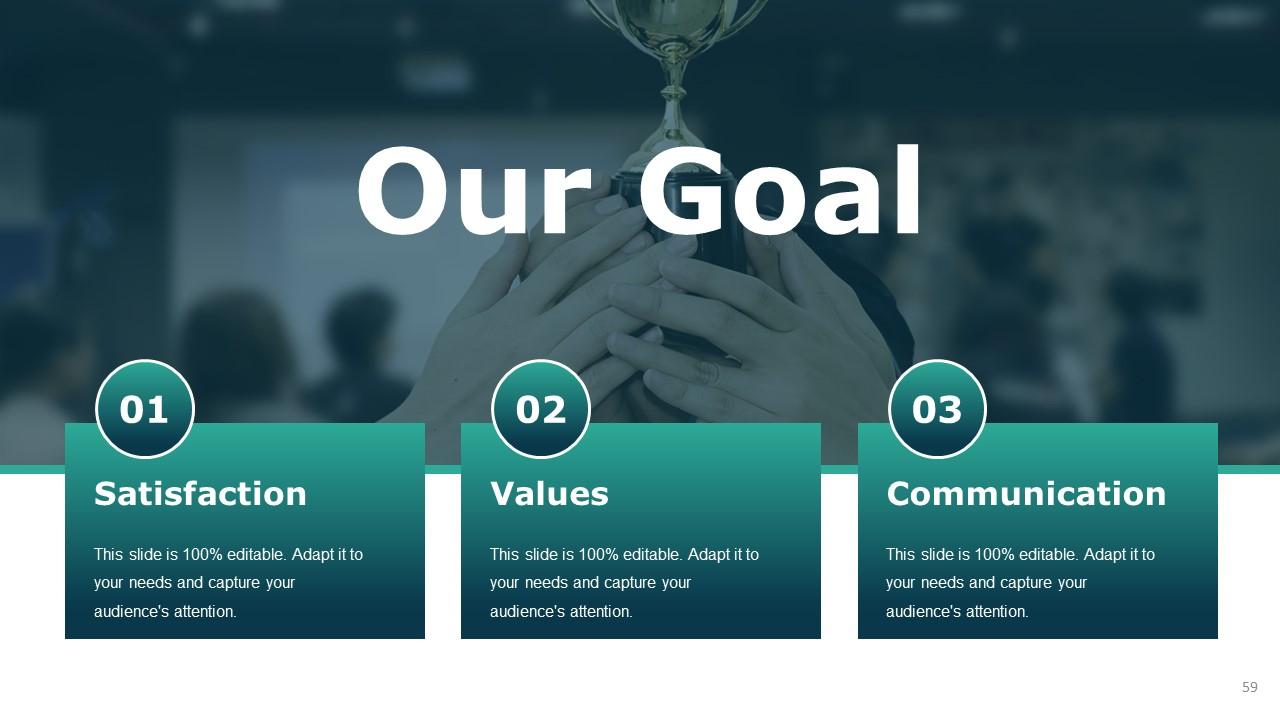
Slide 59: This slide shows Our Goals for your company.
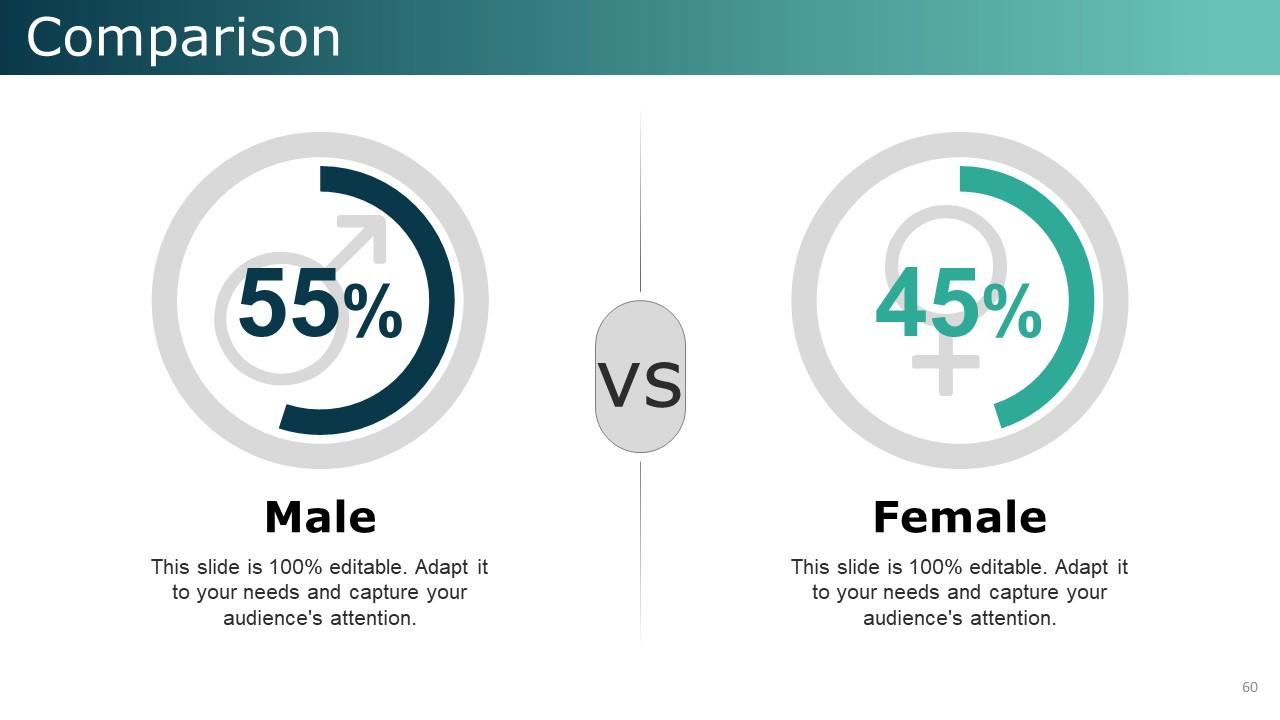
Slide 60: This slide showcases Comparison with which you can use for comapring male and females.
Slide 61: State your Financial score in this slide with relevant imagery and text.
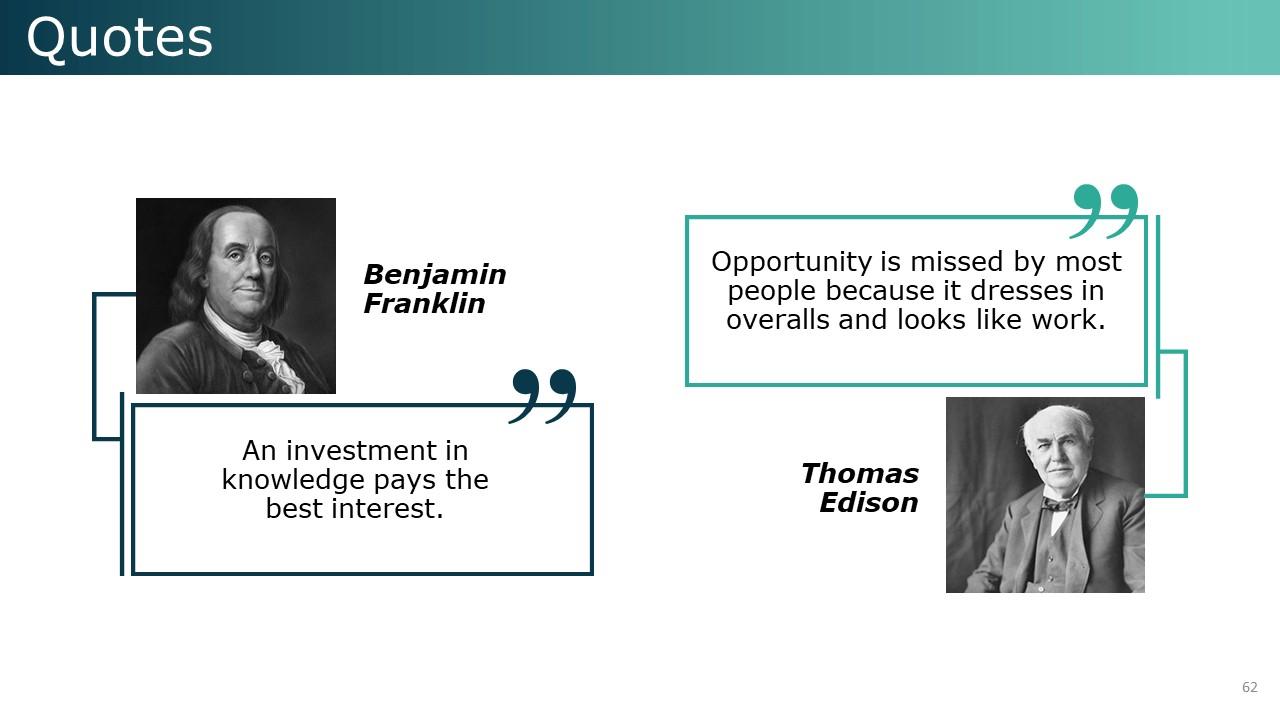
Slide 62: This is a Quotes slide to convey message, beliefs etc.
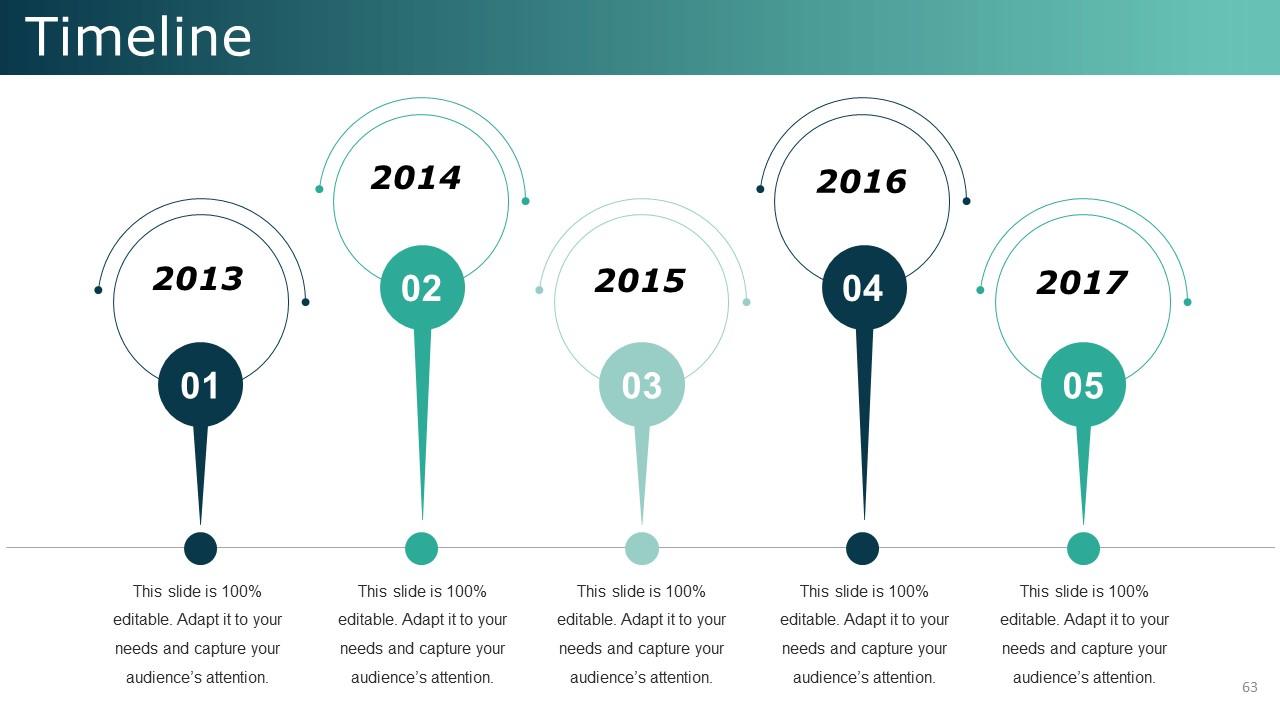
Slide 63: This is a Timelines slide to show- Plan, Budget, Schedule, Review.
Slide 64: This slide forwards to Charts & Graphs.
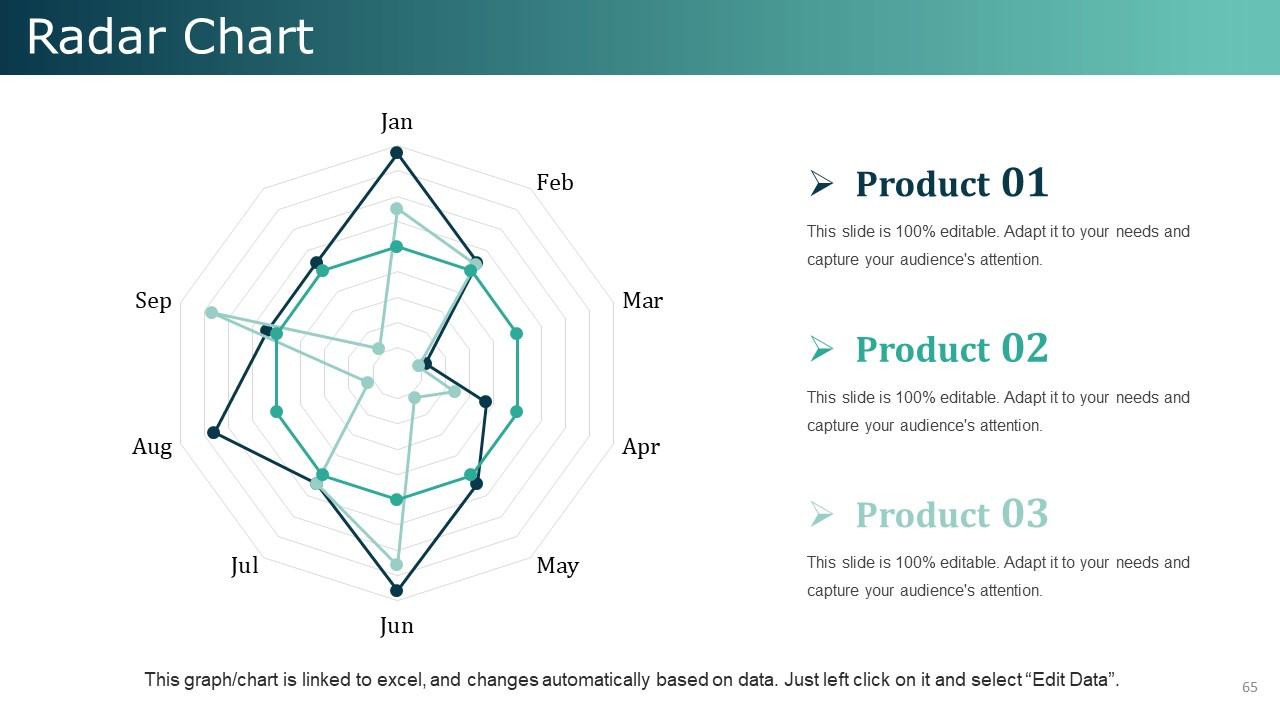
Slide 65: This slide presents a Radar Chart graph/chart. Compare Product 01, Product 02 and use as per required.
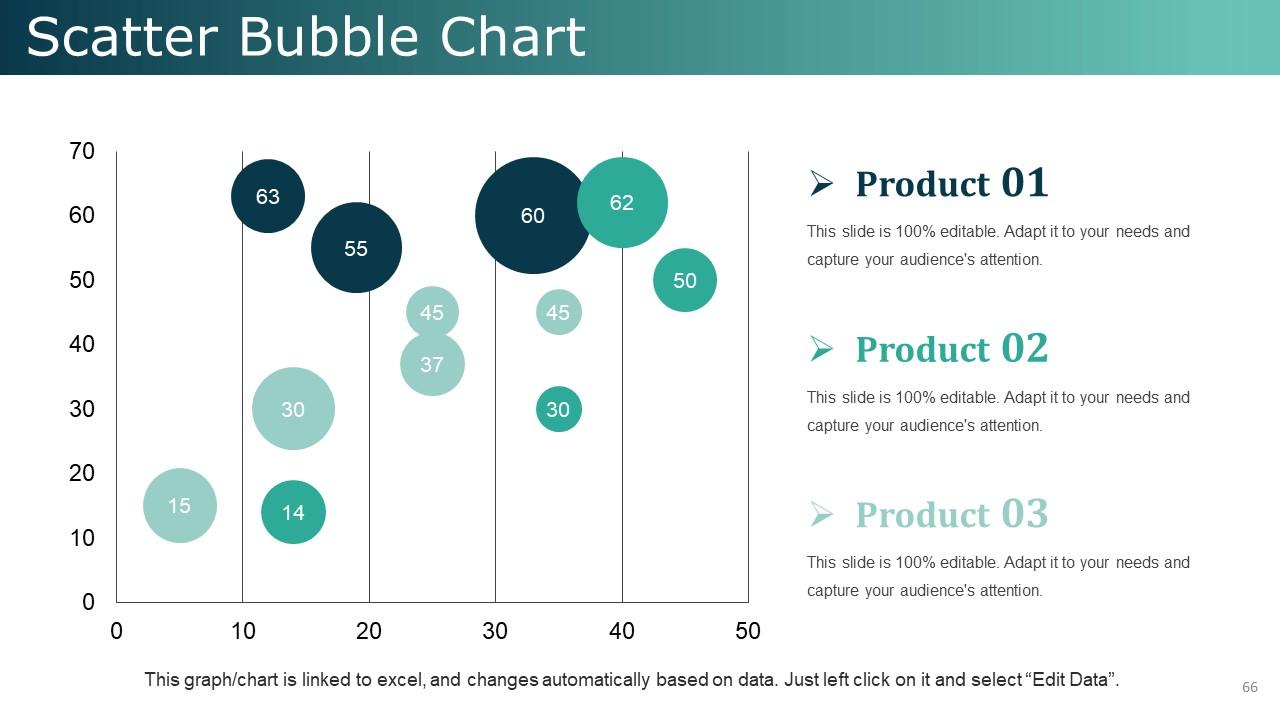
Slide 66: This slide shows Scatter Bubble Chart
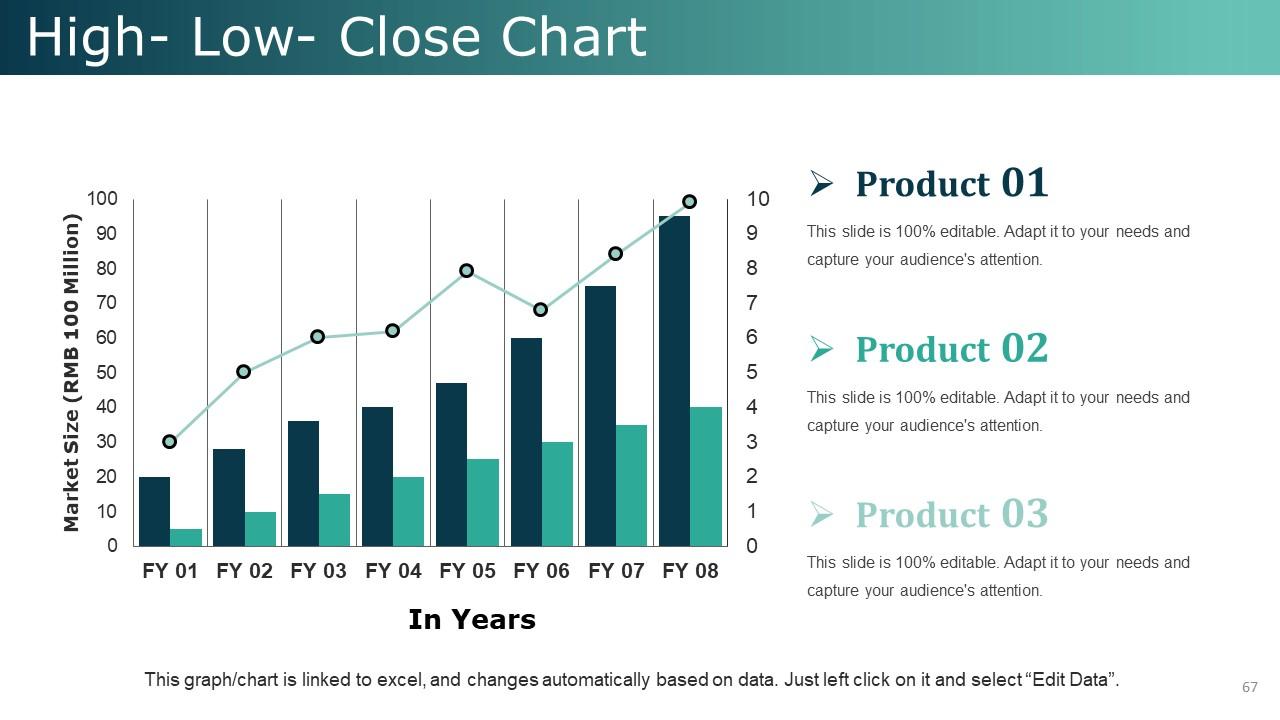
Slide 67: This slide showcases High- Low- Close Chart for the comparison of the products.
Slide 68: This is a Thank You slide with Address:# street number, city, state, Contact Numbers and Email Address.
Product development plans tools and techniques powerpoint presentation slides with all 68 slides:
Assess the aftermath of the event with our Product Development Plans Tools And Techniques Powerpoint Presentation Slides. Be able to judge the fallout.
-
Use of icon with content is very relateable, informative and appealing.
-
Innovative and Colorful designs.


