Product Life Cycle Stages Powerpoint Presentation Slides
Product life cycles stage PowerPoint presentation sides are your way to an easy demonstration of product lifecycle phases. Equipped with topics including repositioning, introduction, growth, maturity, and decline for a product, this PPT design is build to deliver comprehensive results. Our creative team has included organic color schemes and icons for the viewer to have an equal visual connection with the topics concerned. We have included bar graphs for various comparisons like area chart, stacked bar, stack arear clustered column, for a thorough understanding of your projections. These powerpoint slides can easily portray complete information related to a product lifecycle stages, excel and build a durable impression. Just click on the download option and our PPT design will take care of the rest as we are bound to work for best of your business. This PowerPoint template is created for long-lasting impression and building a solid foundation. Our Product Life Cycle Stages Powerpoint Presentation Slides enable easy functioning. You will have a hassle free experience.
- Google Slides is a new FREE Presentation software from Google.
- All our content is 100% compatible with Google Slides.
- Just download our designs, and upload them to Google Slides and they will work automatically.
- Amaze your audience with SlideTeam and Google Slides.
-
Want Changes to This PPT Slide? Check out our Presentation Design Services
- WideScreen Aspect ratio is becoming a very popular format. When you download this product, the downloaded ZIP will contain this product in both standard and widescreen format.
-

- Some older products that we have may only be in standard format, but they can easily be converted to widescreen.
- To do this, please open the SlideTeam product in Powerpoint, and go to
- Design ( On the top bar) -> Page Setup -> and select "On-screen Show (16:9)” in the drop down for "Slides Sized for".
- The slide or theme will change to widescreen, and all graphics will adjust automatically. You can similarly convert our content to any other desired screen aspect ratio.
Compatible With Google Slides

Get This In WideScreen
You must be logged in to download this presentation.
PowerPoint presentation slides
This PPT Template can be used by professionals for representing their product lifecycle phases. You can personalize the text areas, images and color schemes. Icons can be altered and chosen from various options available. These PowerPoint slides are also compatible with Google slides and available in widescreen version after downloading. Also, they are completely convertible and editable as per requirement.
People who downloaded this PowerPoint presentation also viewed the following :
Content of this Powerpoint Presentation
Slide 1: This slide introduces Product Life Cycle Stages. State Your Company Name and begins.
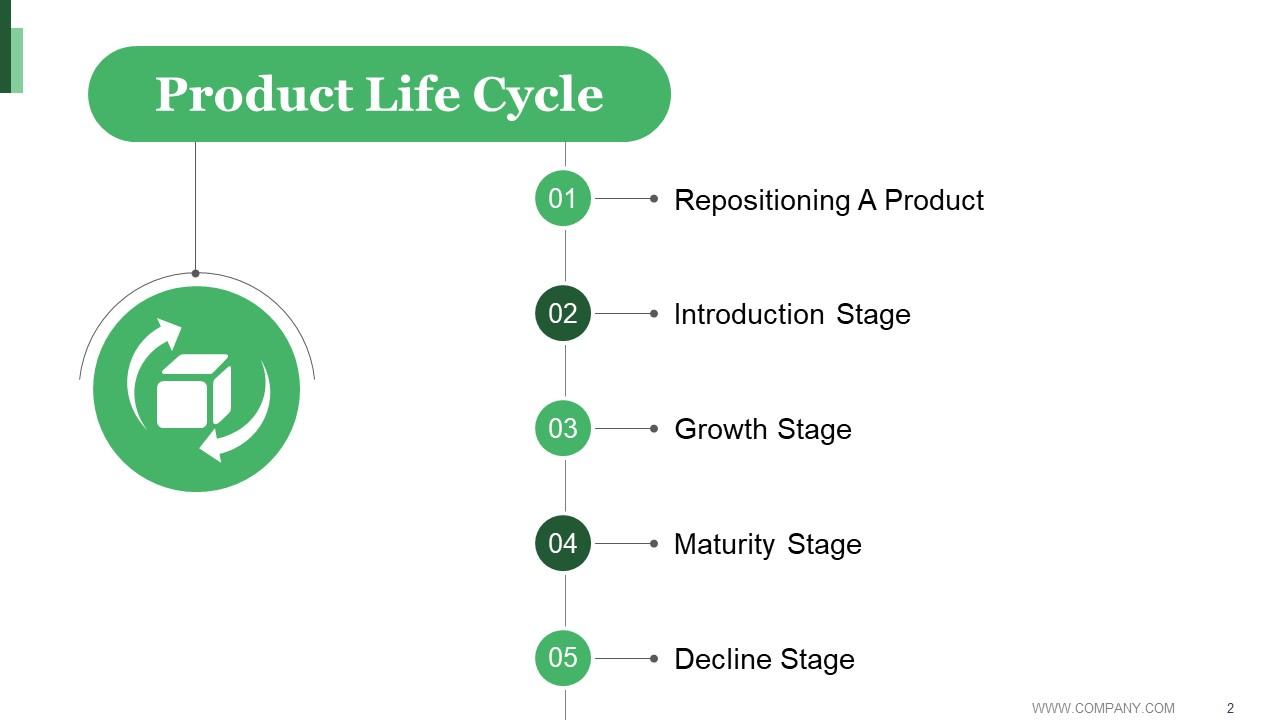
Slide 2: This slide showcases Product Life Cycle with these five of the stages- Repositioning A Product, Introduction Stage, Maturity Stage, Decline Stage, Growth Stage.
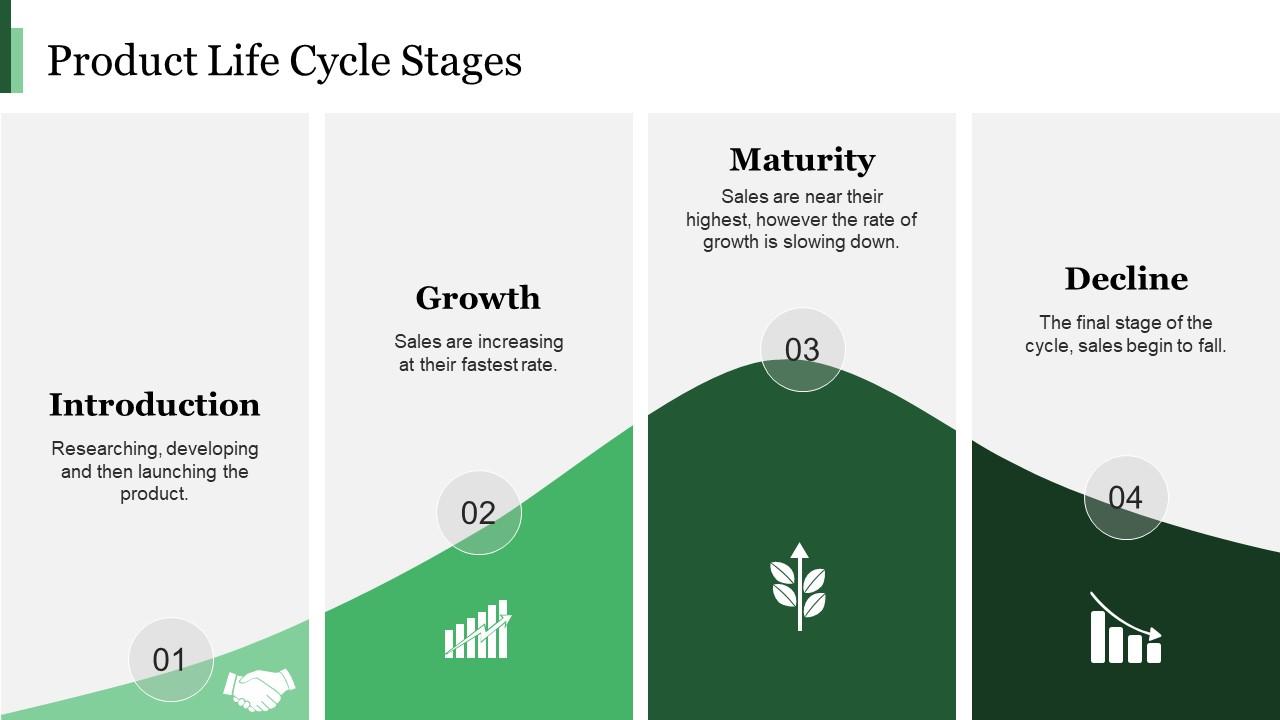
Slide 3: Product Life Cycle Stages Researching, developing and then launching the product. Introduction, Sales are increasing at their fastest rate, Growth, Sales are near their highest, however the rate of growth is slowing down, Maturity, The final stage of the cycle, sales begin to fall, Decline.
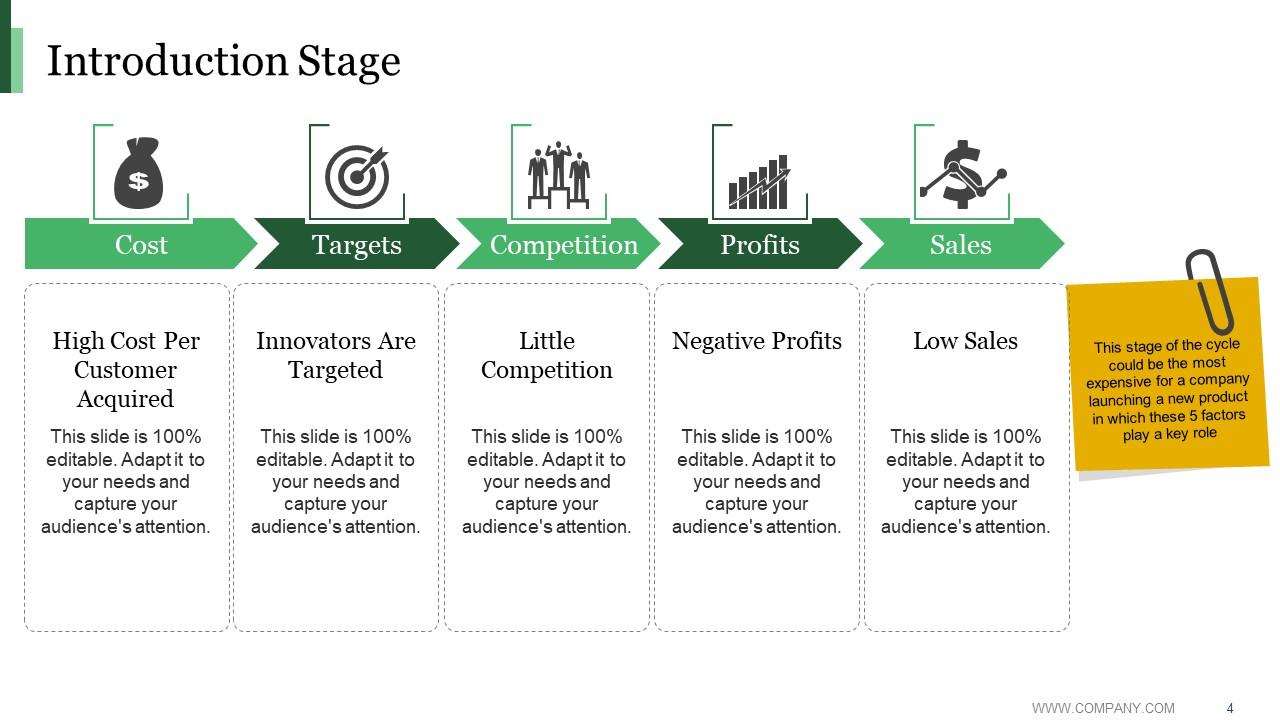
Slide 4: This slide presents Introduction Stage with these priority steps- Cost, Targets, Competition, Profits, Sales, This stage of the cycle could be the most expensive for a company launching a new product in which these 5 factors play a key role.
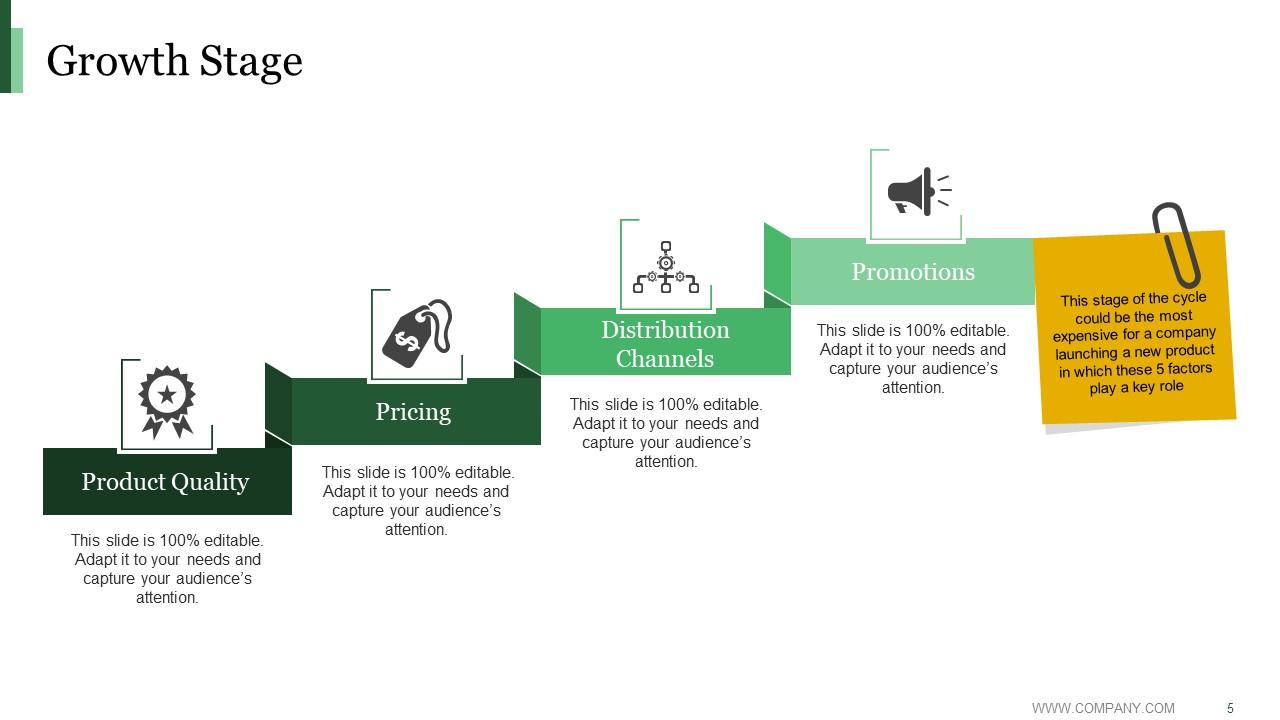
Slide 5: This slide showcases Growth Stage with these four stages- Pricing, Distribution Channels, Product Quality, Promotions, This stage of the cycle could be the most expensive for a company launching a new product in which these 5 factors play a key role
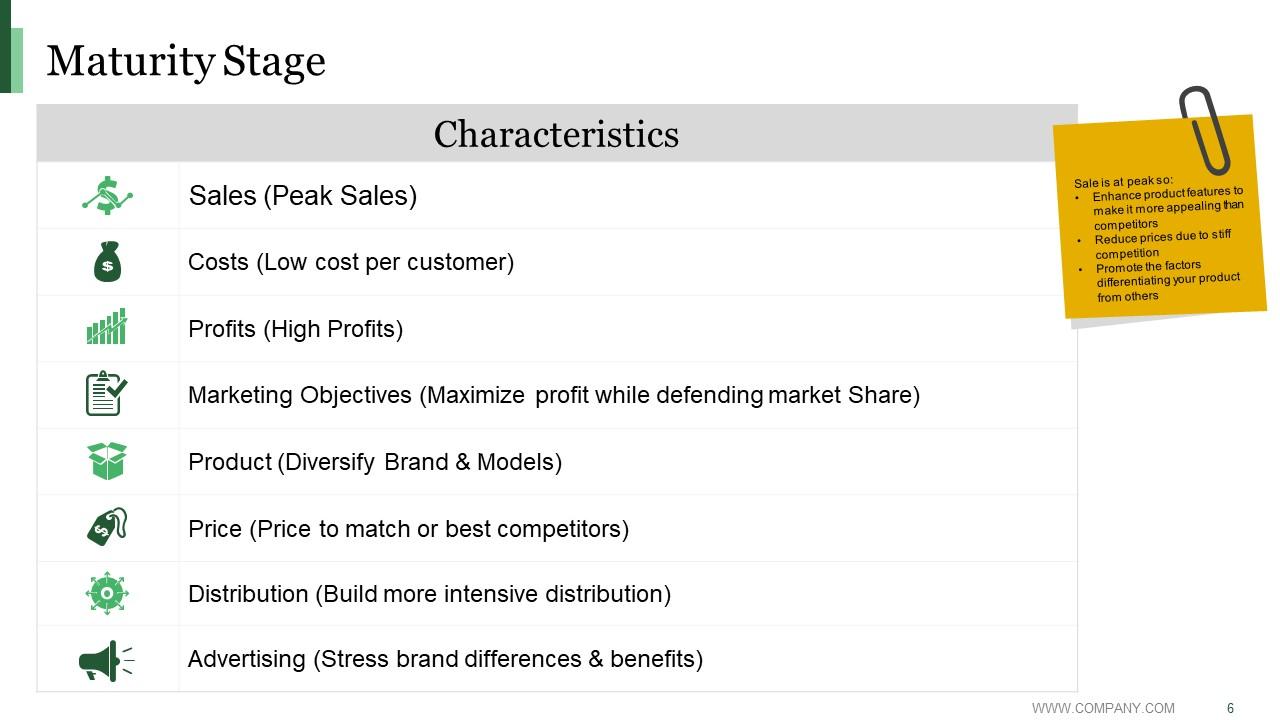
Slide 6: This slide presents Maturity Stage with different characteristics.
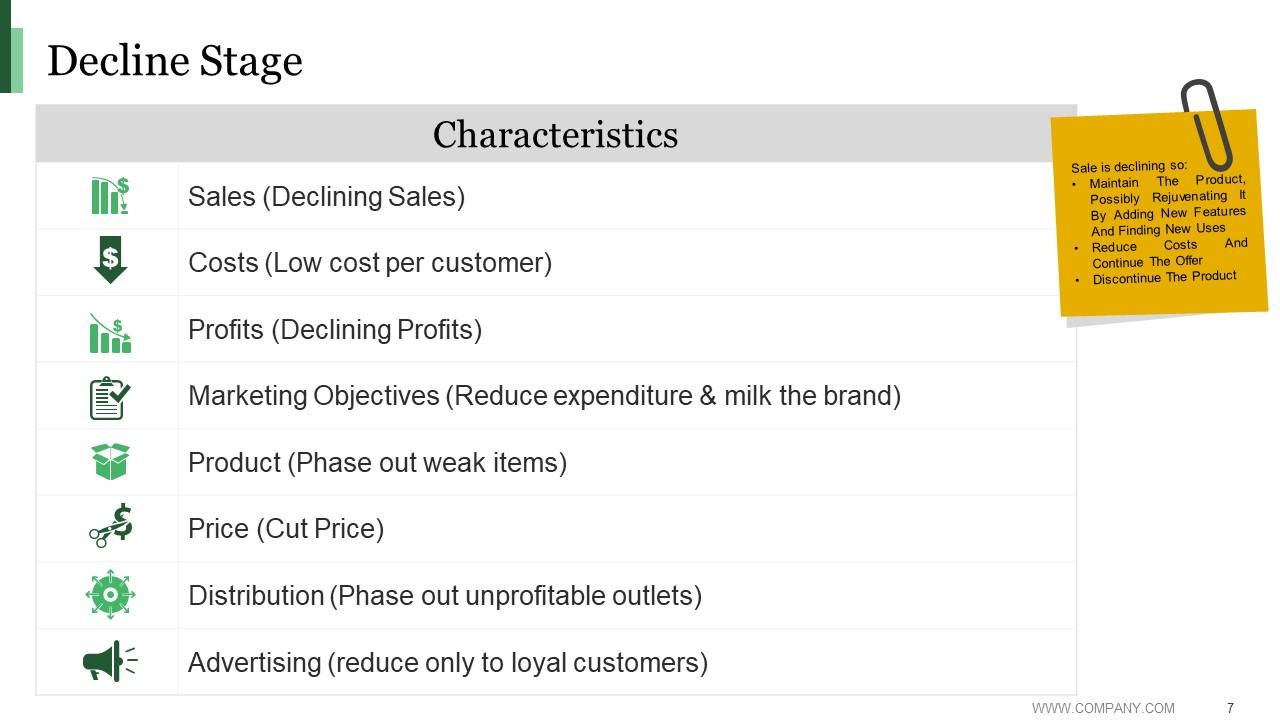
Slide 7: This stage shows Decline Stage with these of the important factors.
Slide 8: This is a Coffee Break slide to halt. You may change it as per requirement.
Slide 9: This is a Bar Graph image slide to show product comparison, growth etc.
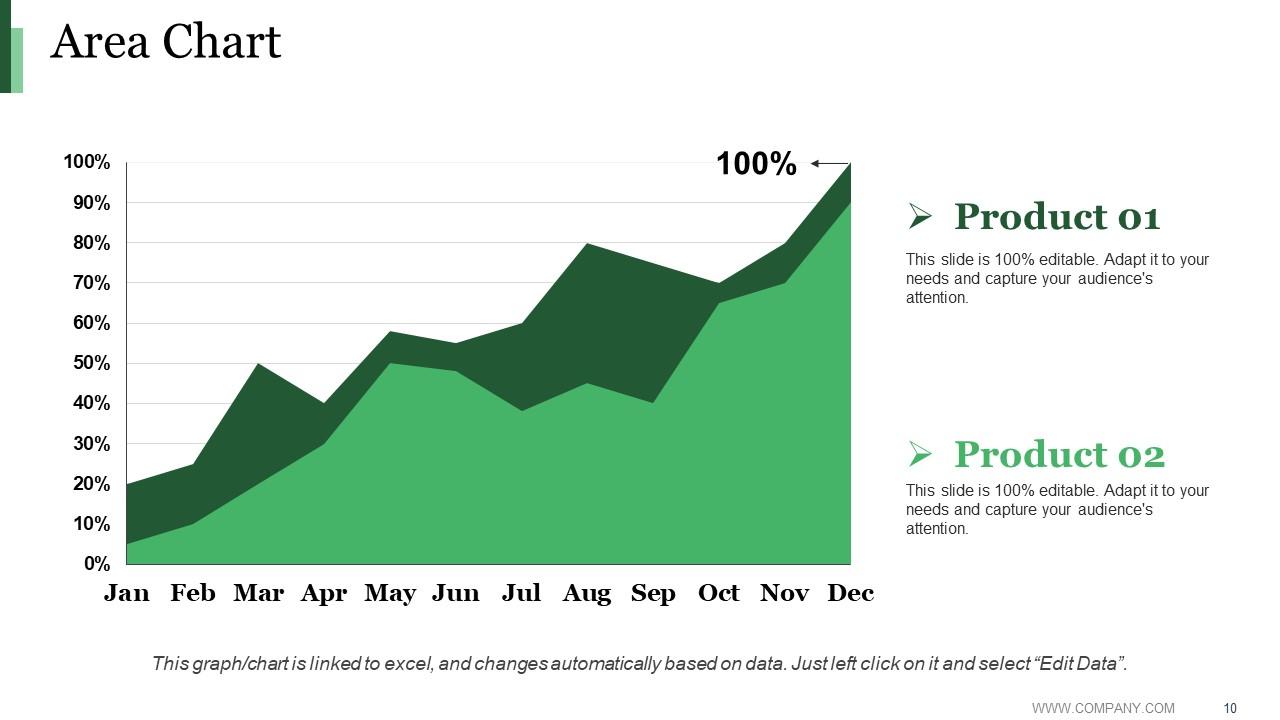
Slide 10: This is an Area Chart slide for product/entity comparison.
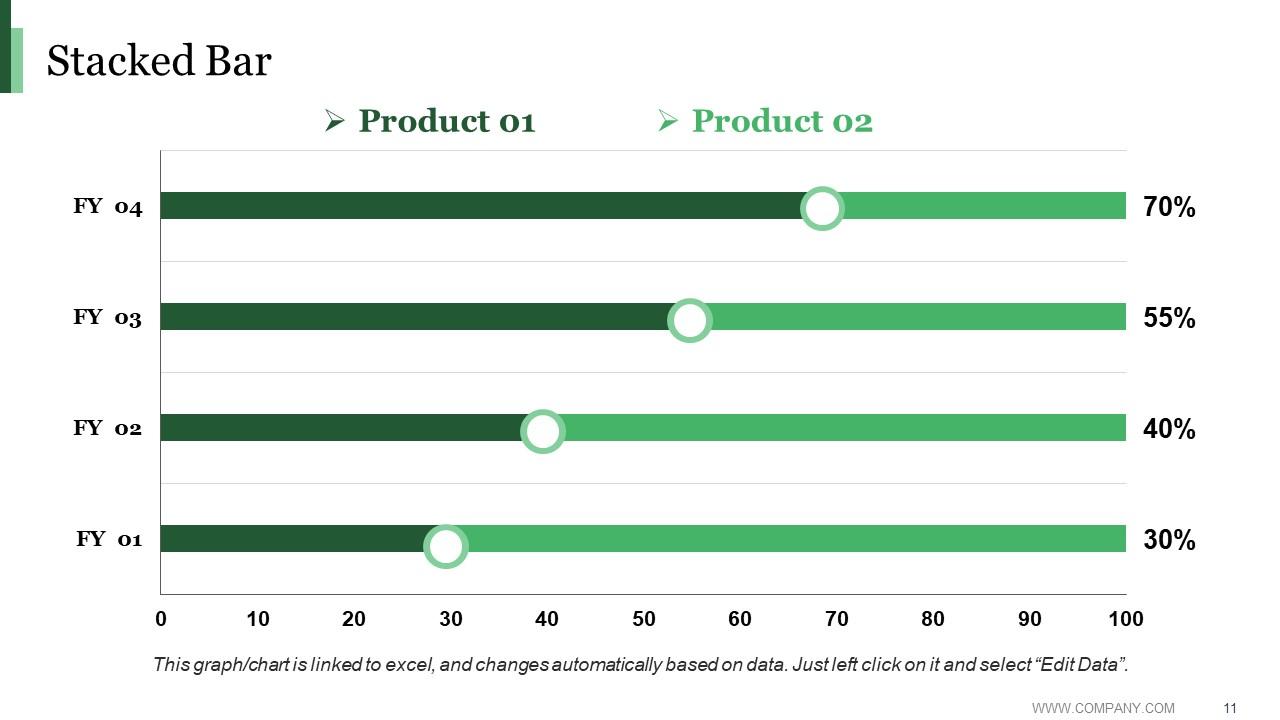
Slide 11: This slide shows a Stacked bar graph in terms of percentage and years for comparison of Product 01, Product 02, Product 03 etc.
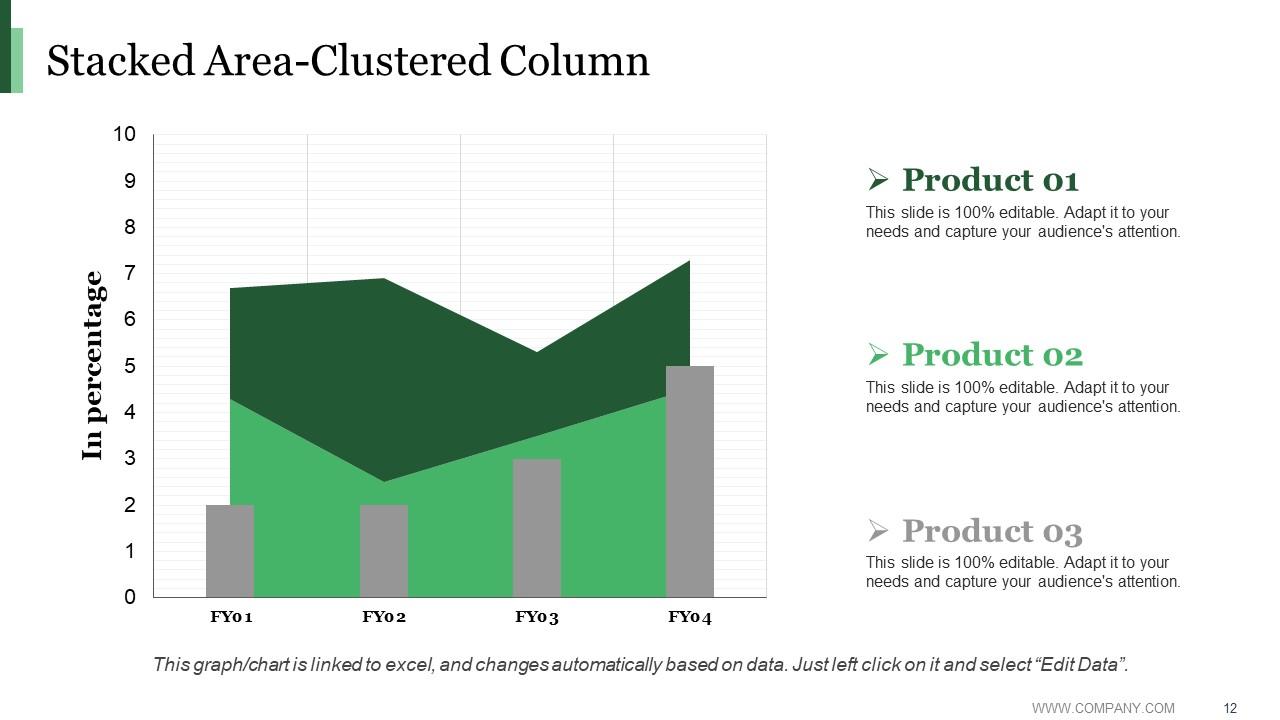
Slide 12: This slide presents Stacked Area-Clustered Column.
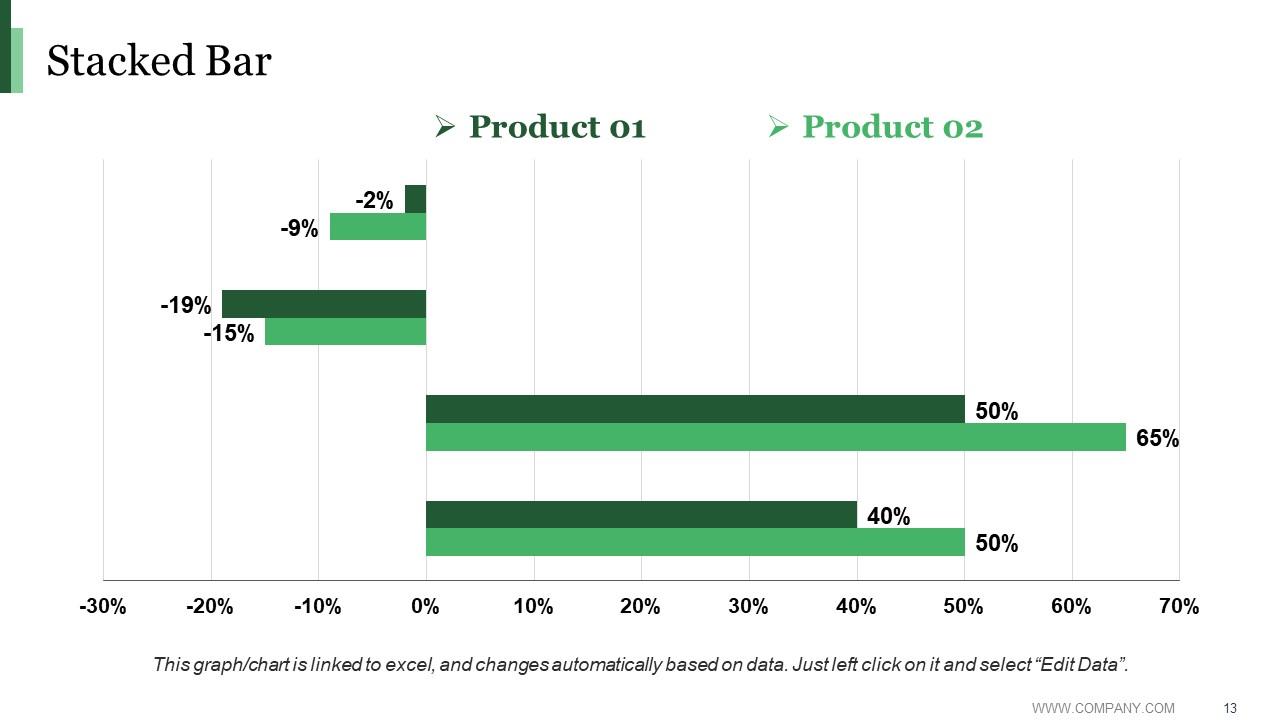
Slide 13: This slide showcases Stacked Bar with these two description.
Slide 14: This slide is titled Additional Slides.
Slide 15: This slide represents Our Mission. State your mission, goals etc.
Slide 16: This slide showcases Our Team with Name and Designation to fill.
Slide 17: This slide helps show- About Our Company. The sub headings include- Creative Design, Customer Care, Expand Company.
Slide 18: This slide shows Our Goals for your company
Slide 19: This slide shows Comparison of Positive Factors v/s Negative Factors with thumbsup and thumb down imagery.
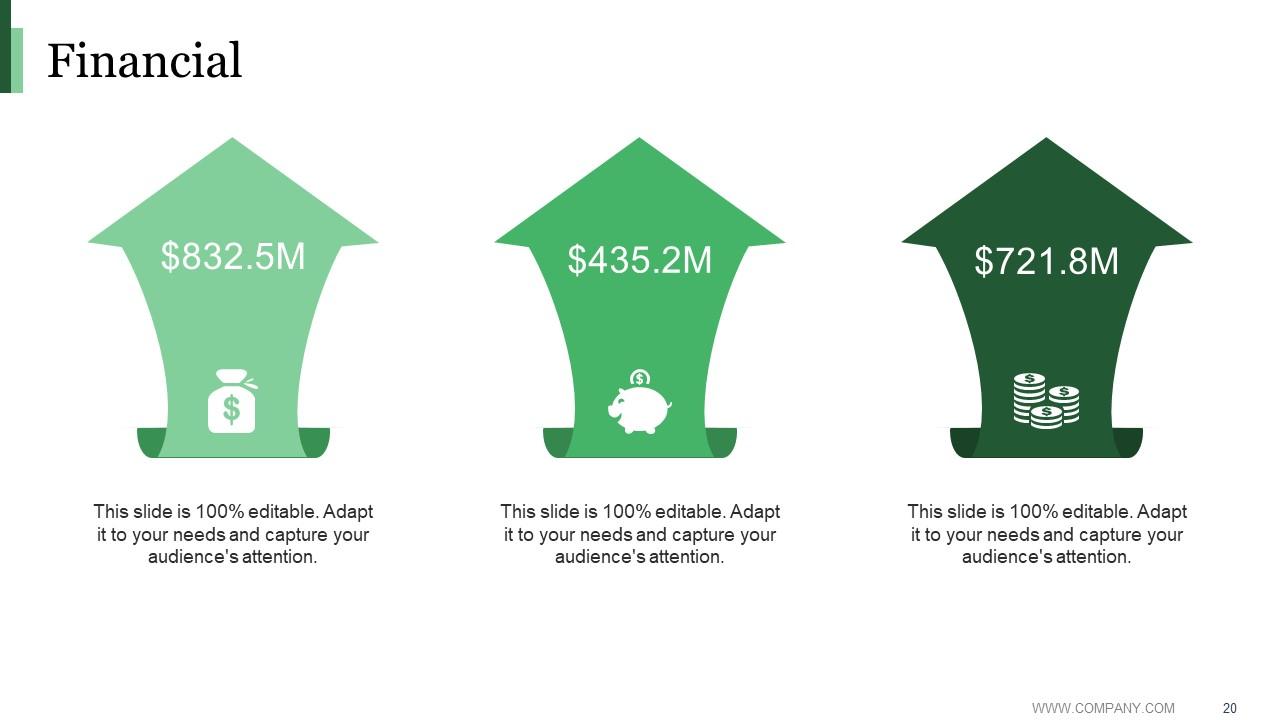
Slide 20: This is a Financial Score slide to show financial aspects here.
Slide 21: This is a Quotes slide to convey message, beliefs etc.
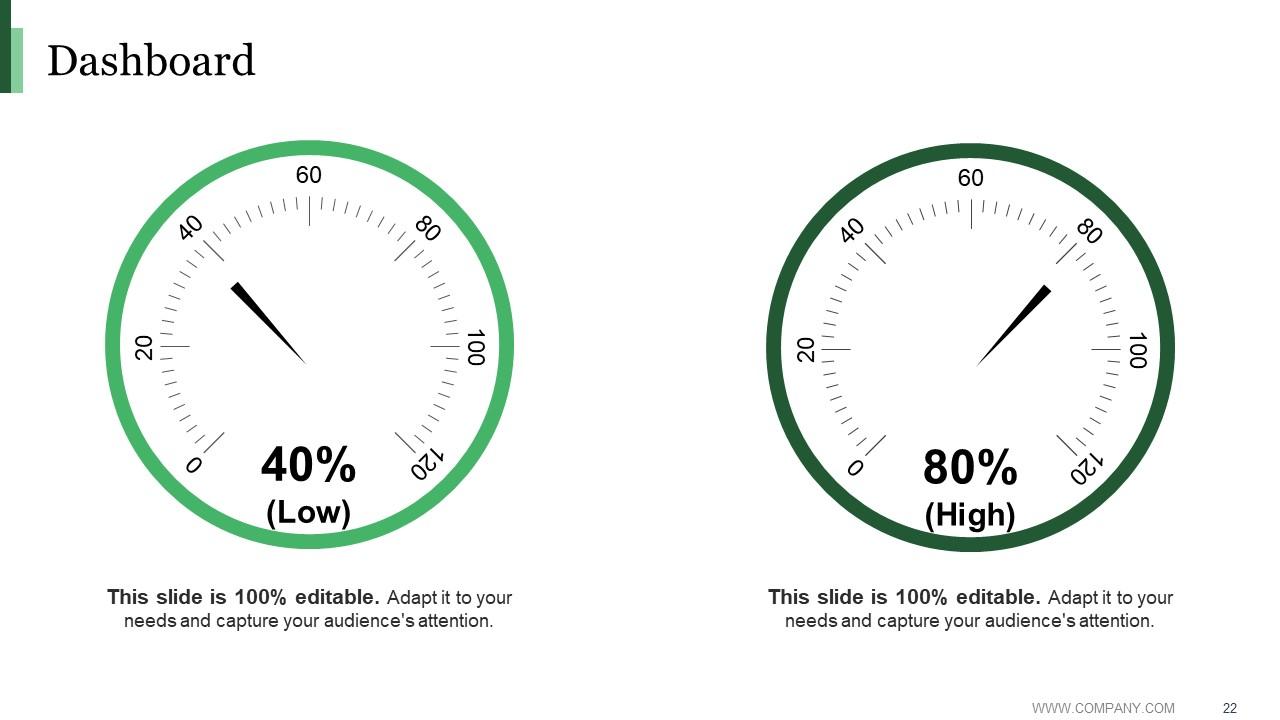
Slide 22: This is a Dashboard slide to show- Strategic System, Success, Goal Process, Sales Review, Communication Study.
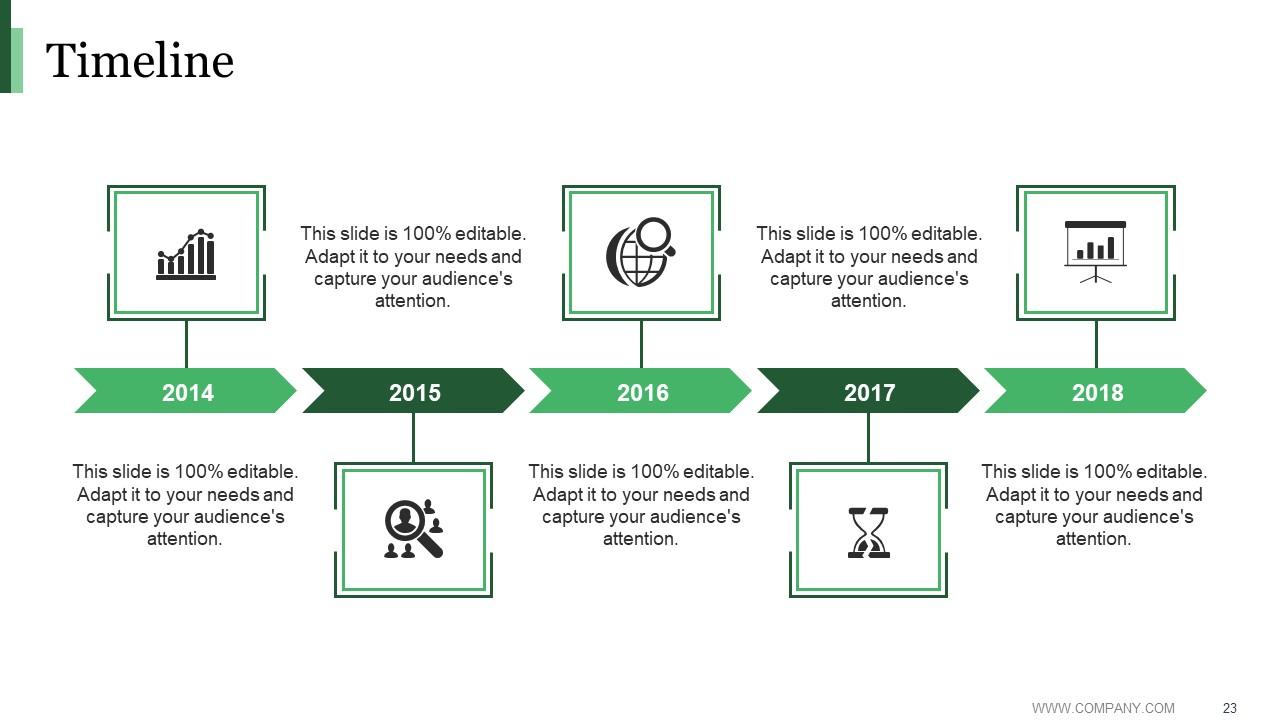
Slide 23: This is a Timelines slide to show- Plan, Budget, Schedule, Review.
Slide 24: This slide shows Target image with text boxes.
Slide 25: This slide shows a Mind map for representing entities.
Slide 26: This slide displays a Bulb or idea image.
Slide 27: This slide displays a Magnifying Glass with icon imagery.
Slide 28: : This is a Thank You slide with Address# street number, city, state, Contact Numbers, Email Address.
Product Life Cycle Stages Powerpoint Presentation Slides with all 28 slides:
Benefit from good habits with our Product Life Cycle Stages Powerpoint Presentation Slides. The audience will applaud your deeds.
-
Use of icon with content is very relateable, informative and appealing.
-
Top Quality presentations that are easily editable.


