


Production management ppt slides complete deck


Try Before you Buy Download Free Sample Product
 Impress Your
 Audience
Editable
of Time


Our Production Management PPT Slides Complete Deck are topically designed to provide an attractive backdrop to any subject. Use them to look like a presentation pro.
People who downloaded this PowerPoint presentation also viewed the following :
Content of this Powerpoint Presentation
Slide 1: This is a slide that represents the topic Production Management PPT Slides.
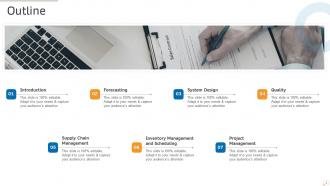
Slide 2: This is a template that illustrates the Outline including the Introduction, Forecasting, System Design, and more.
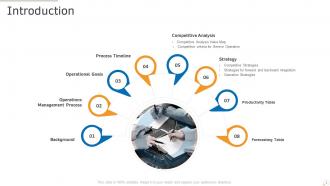
Slide 3: This is another introduction template that includes Background, Operations Management Process, Operational Goals, Process Timeline, Competitive Analysis Value Map, Competitive criteria for Service Operation, Competitive Analysis, and more.
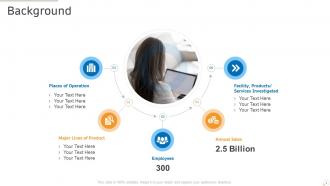
Slide 4: This is a Background slide that illustrates Places of Operation, Major Lines of Product, Places of Operation, and more.
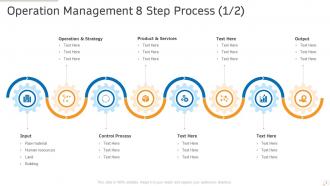
Slide 5: This is a template that illustrates the Operation Management Process’ steps.
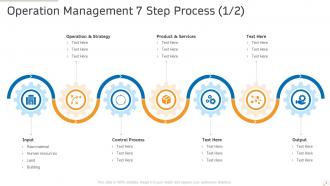
Slide 6: This is a 100% editable template illustrating seven steps of Operation Management.
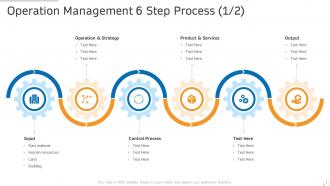
Slide 7: This is another invigorating template that illustrates the 6 steps of Operation Management.
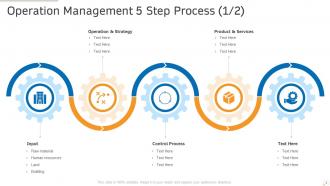
Slide 8: This is another Operation Management template that illustrates 5 critical Steps.
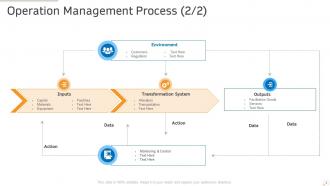
Slide 9: This is a template that represents the Operation Management Process using a graphic diagram.
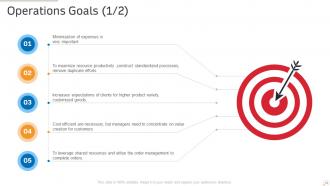
Slide 10: This slide represents the five Operations Goals.
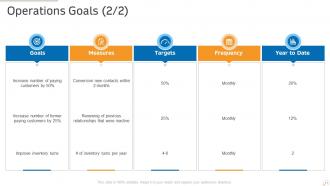
Slide 11: This slide represents the essential Operations Goals.
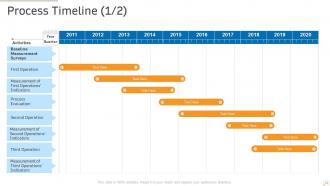
Slide 12: This template illustrates the Process Timeline showcasing goals, measures, targets, frequency, and more.
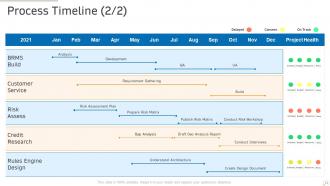
Slide 13: This is a process timeline template illustrating the BRMS Build, Customer Service, Risk Assess, Credit Research, and more.
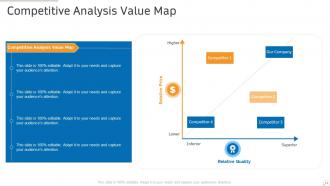
Slide 14: This is a slide that illustrates the topic Competitive Analysis Value Map.
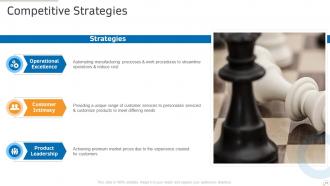
Slide 15: This is a slide that represents the Competitive Strategies including Operational Excellence, Customer Intimacy, Product Leadership, and more.
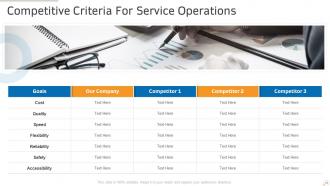
Slide 16: This is a slide that represents the topic Competitive Criteria for Service Operations.
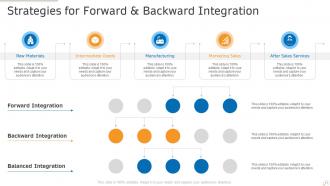
Slide 17: This is a slide that represents the Strategies for Forward & Backward Integration.
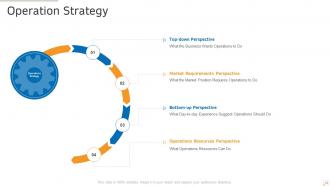
Slide 18: This is a slide that represents the topic Operation Strategy including Top-down Perspective, Bottom-up Perspective, and more.
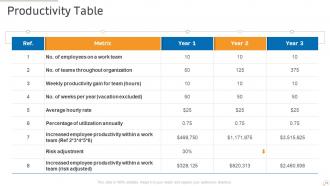
Slide 19: This is a slide that represents a 100% editable Productivity Table.
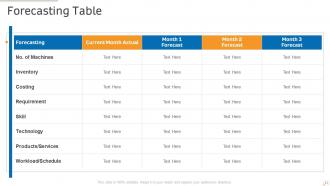
Slide 20: This slide is a 100% editable slide that illustrates the forecasting table.
Slide 21: This is another Forecasting Table slide that includes the number of machines, inventory, costing, and more.
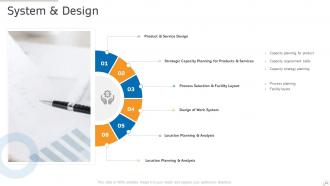
Slide 22: This is a System & Design slide that illustrates the Process Selection & Facility Layout, Strategic Capacity Planning for Products & Services, Product & Service Design, Design of Work Systems, and more.
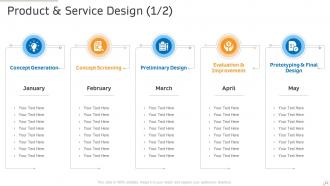
Slide 23: This is a slide that represents the topic Product & Service Design covering Concept Generation, Concept Screening, and more.
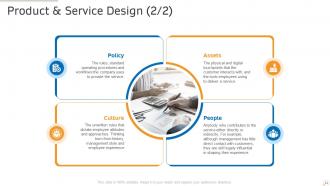
Slide 24: This is another Product & Service Design slide that illustrates the Policy, Assets, Culture, People, and more.
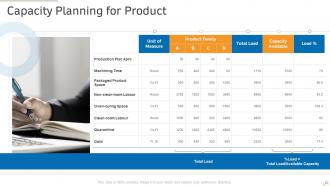
Slide 25: This is a slide that represents the topic Capacity Planning for Product.
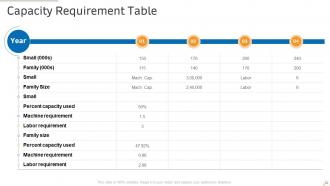
Slide 26: This is a 100% editable slide that illustrates the topic Capacity Requirement Table.
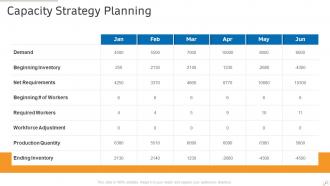
Slide 27: This is a slide that illustrates the topic of Capacity Strategy Planning.
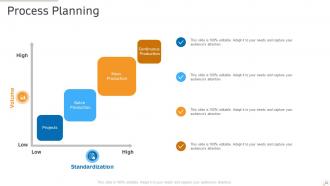
Slide 28: This is a slide that illustrates the topic Process Planning covering Projects, Batch Production, Mass Production, Continuous Production, and more.
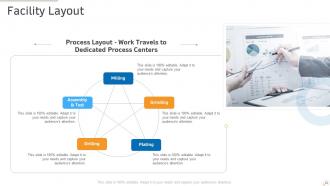
Slide 29: This is a slide that illustrates the topic of Facility Layout covering Milling, Grinding, Assembly & Test, and more.
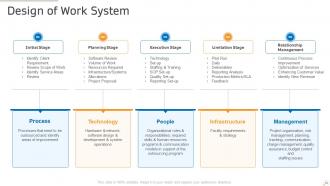
Slide 30: This is a slide that represents the topic Design of Work System covering the Review Scope of Work, Software Review, and other parameters.
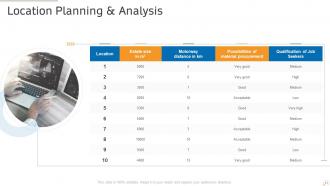
Slide 31: This slide illustrates the topic Location Planning & Analysis.
Slide 32: This slide represents the topic Location and Planning Analysis covering Estate size, Motorway distance, and more.
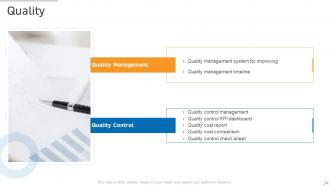
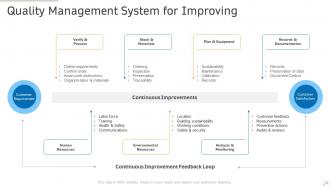
Slide 33: This slide illustrates the Quality Management System for Improving output.
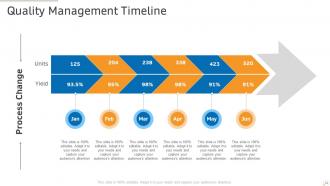
Slide 34: This slide illustrates the Quality Management Timeline.
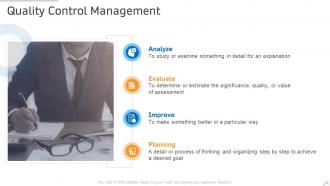
Slide 35: This slide represents the topic Quality Control Management covering four crucial steps – Analyze, Plan, Improve, and Execute.
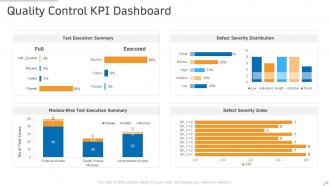
Slide 36: This slide illustrates the 100% editable Quality Control KPI Dashboard.
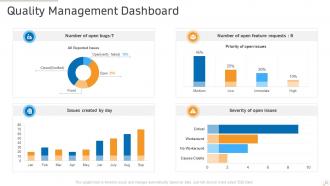
Slide 37: This slide illustrates the Quality Management Dashboard covering the Number of open bugs, Number of open feature requests, Priority of open issues, Severity of open issues, and more.
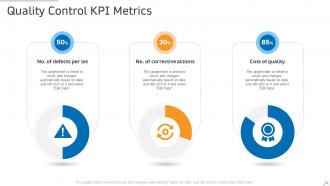
Slide 38: This slide illustrates the numerous Quality Control KPI Metrics that are linked to Excel and changes automatically based on data.
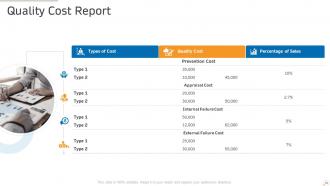
Slide 39: This slide illustrates the Quality Cost Report covering the Types of Cost, Quality Costs, Percentage of Sales, and more.
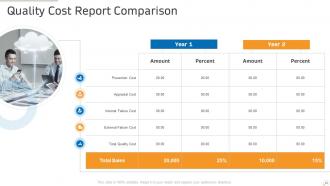
Slide 40: This slide illustrates a Quality Cost Report Comparison to capture your audience's attention.
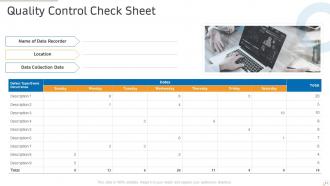
Slide 41: This slide illustrates the Quality Control Check Sheet including the name of the data recorder, location, and data collection date.
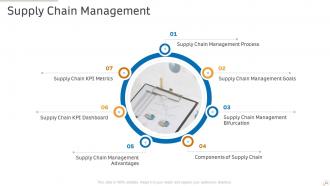
Slide 42: This slide illustrates the Supply Chain Management Process covering Supply Chain Management Goals, Supply Chain Management Bifurcation, Supply Chain KPI Dashboard, Supply Chain KPI Metrics, and more.
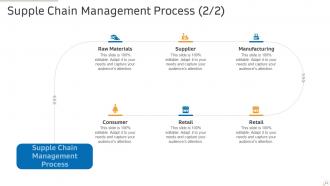
Slide 43: This is another Supply Chain Management Process slide that covers Raw Materials, Suppliers, Manufacturing, and other steps.
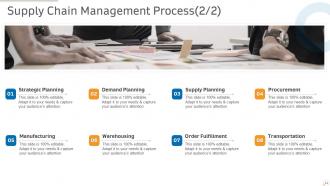
Slide 44: This slide represents the Supply Chain Management Process covering the parameters like Strategic Planning, Demand Planning, Supply Planning, Procurement, and more.
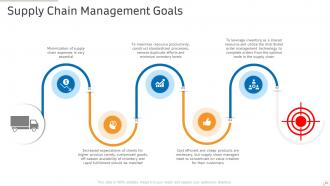
Slide 45: This slide illustrates the Supply Chain Management Goals to maximize resource productivity, construct standardized processes, remove duplicate efforts, and minimize inventory levels.
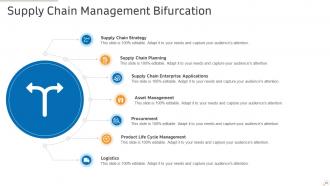
Slide 46: This slide represents the Supply Chain Management Bifurcation covering the Supply Chain Strategy, Supply Chain Planning, Supply Chain Enterprise Applications, and more.
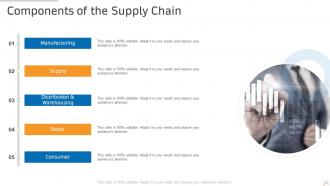
Slide 47: This slide illustrates the Components of the Supply Chain including Manufacturing, Supplying, Distribution, and more.
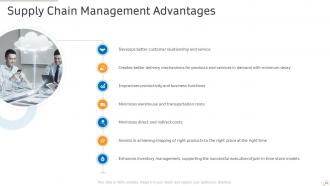
Slide 48: This slide illustrates the insightful Supply Chain Management Advantages such as Developing better customer relationships and services, Creating better delivery mechanisms for products and services in demand with minimum delay, Improvising productivity and business functions, and more.
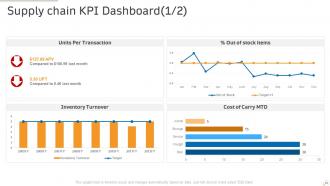
Slide 49: This slide illustrates a 100% editable Supply chain KPI Dashboard covering the Units Per Transaction, Out of stock items, Inventory Turnover, and more.
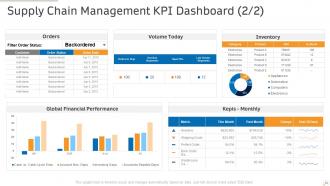
Slide 50: This is another slide that represents the Supply Chain Management KPI Dashboard covering the Monthly KPIs, Global Financial Performance, Orders, Filter Order Status, and other parameters.
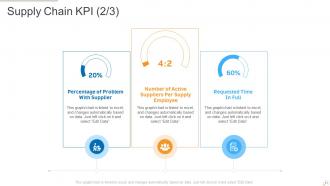
Slide 51: This is a slide that can be used to represent the Supply Chain KPIs covering the Percentage of Problem With Suppliers, Number of Active Suppliers Per Supply Employee, Requested Time, and more.
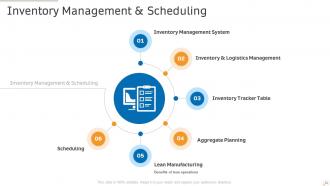
Slide 52: This is an Inventory Management & Scheduling template that illustrates the Inventory Management System, Inventory & Logistics Management, and more.
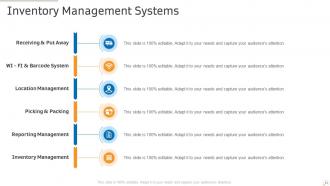
Slide 53: This slide illustrates the Inventory Management Systems covering steps like Receiving & Put Away, Inventory Management, and more.
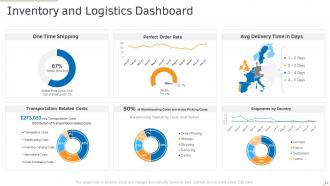
Slide 54: This slide illustrates the Inventory and Logistics Dashboard covering the Transportation Related Costs, Distribution of Transportation related Costs, 50% of Warehousing Costs, Picking Costs, and more.
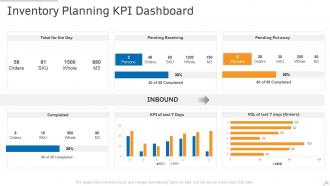
Slide 55: This slide illustrates the Inventory Planning KPI Dashboard covering the Orders, SKUs, and more.
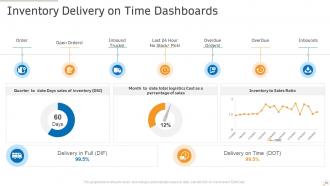
Slide 56: This slide represents the topic Inventory Delivery on Time Dashboards covering the Delivery on Time (DOT), Delivery in Full (DIF), Inventory to Sales Ratio, and another status.
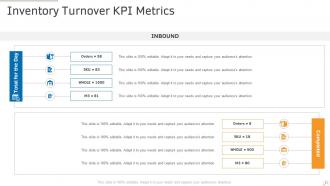
Slide 57: This slide represents the Inventory Turnover KPI Metrics covering the Inbound information.
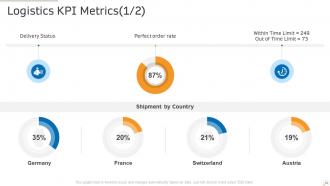
Slide 58: This slide illustrates the Logistics KPI Metrics covering the Delivery Status, Perfect order rate, Shipment by Country, and other information.
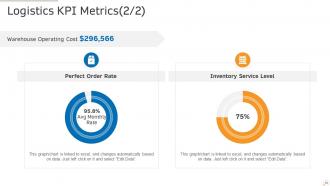
Slide 59: This slide illustrates the Logistics KPI Metrics that are linked to Excel and changes automatically based on data.
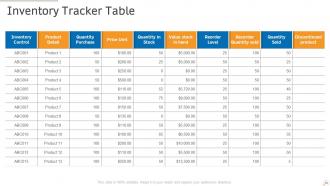
Slide 60: This slide illustrates the Inventory Tracker Table that can be easily edited as per your information.
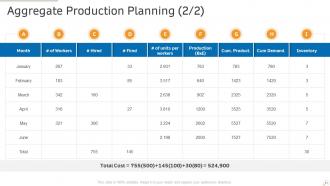
Slide 61: This slide illustrates the Aggregate Production Planning explained with the help of a systematic chart.
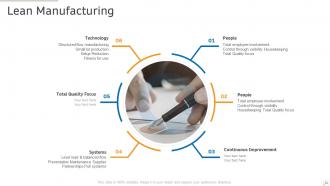
Slide 62: This slide illustrates the topic of Lean Manufacturing covering the aspects like Technology, Structured flow manufacturing, Small lot production, Setup Reduction, and others.
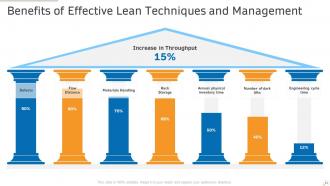
Slide 63: This slide illustrates the Benefits of Effective Lean Techniques and Management covering the Increase in Throughput, Defects, Flow, Distance, and other information.
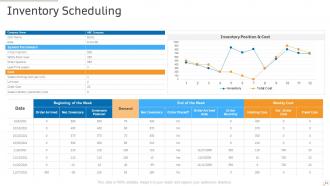
Slide 64: This slide illustrates the topic Inventory Scheduling using invigorating bar graphs and charts.
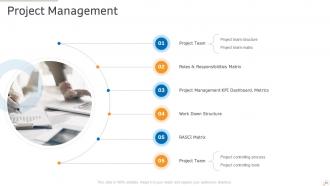
Slide 65: This slide illustrates the components of Project Management like Project team structure, Project team matrix, Roles & Responsibilities Matrix, Work Down Structure, and more.
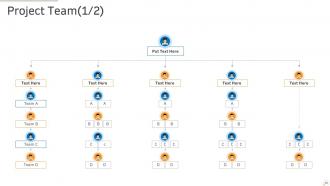
Slide 66: This slide illustrates the information related to various Project Teams.
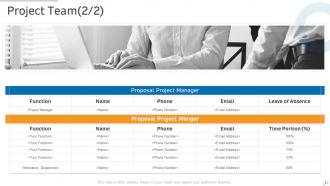
Slide 67: This slide also represents the information related to the employees involved against each Project Team.
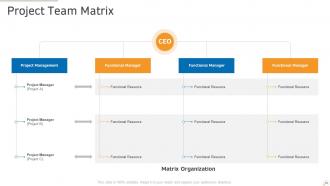
Slide 68: This slide illustrates a 100% editable Project Team Matrix.
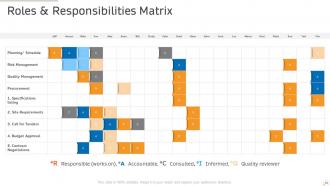
Slide 69: This slide illustrates the Roles & Responsibilities Matrix covering Planning, Risk Management, Procurement, Site Requirements, and more.
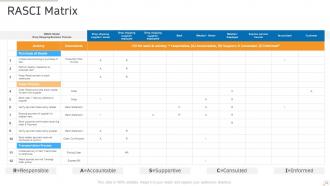
Slide 70: This slide illustrates the RASCI Matrix depicting the meaning of R=Responsible, A=Accountable, C=Consulted, I=Informed, and S=Supportive.
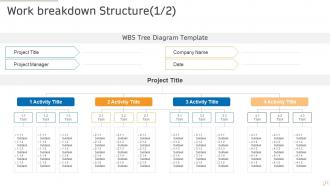
Slide 71: This slide represents the Work breakdown Structure covering WBS Tree Diagram Template, Project Title, Project Manager, Company Name, and more.
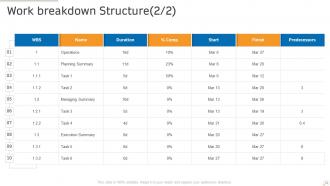
Slide 72: This slide also illustrates the Work breakdown Structure and can be edited easily as per the requirement.
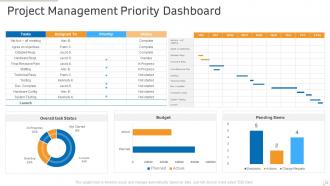
Slide 73: This slide illustrates the Project Management Priority Dashboard.
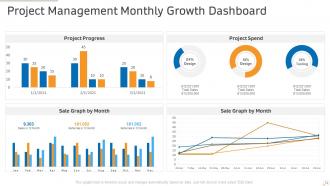
Slide 74: This slide also illustrates the Project Management Monthly Growth Dashboard that can be edited easily.
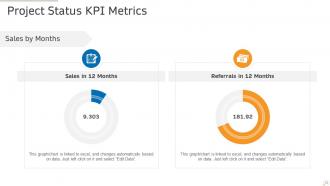
Slide 75: This slide illustrates the Project Status KPI Metrics that is linked to Excel and changes automatically based on data.
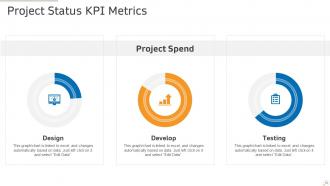
Slide 76: This slide illustrates the Project Status KPI Metrics covering the Project Spend, Design, and other information.
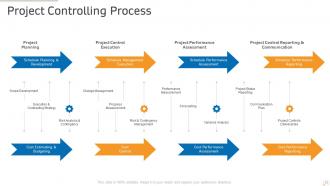
Slide 77: This slide illustrates the Project Controlling Process including the Project Performance Assessment, Project Control Reporting & Communication, Scope Development, and more.
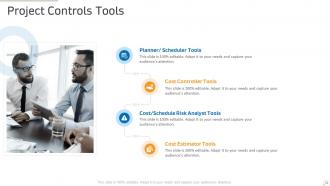
Slide 78: This slide illustrates the Project Controls Tools like Planner/ Scheduler Tools, Cost Controller Tools, Cost/Schedule Risk Analyst Tools, and more.
Slide 79: This is a 100% editable Icons Slide for Production Management PPT.
Slide 80: This template illustrates the beginning of Additional Slides.
Slide 81: This slide illustrates the company goals.
Slide 82: This is a Comparison slide that covers the parameters like Gender, Country, and more.
Slide 83: This slide can be used to share the company Quotes and Client Testimonials.
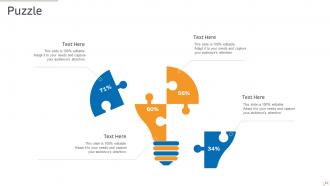
Slide 84: This is a 100% editable Puzzle template.
Slide 85: This slide can be used to depict the engaging Ideas Generated over a period.
Slide 86: This is a Thank you slide that includes the Company Address, Contact Details, Email, and more.
Production management ppt slides complete deck with all 86 slides:
Use our Production Management PPT Slides Complete Deck to effectively help you save your valuable time. They are readymade to fit into any presentation structure.


FAQs for Production management ppt
Ok so first thing - map out your workflow and find the biggest bottlenecks, that's where you'll see quick wins. Focus on lean manufacturing and cutting waste everywhere: extra inventory, overproduction, waiting around, defects. Quality control is massive because fixing problems early beats dealing with disasters later. I know standardizing processes sounds super boring but honestly it's what separates the pros from everyone else. Oh and do preventive maintenance instead of just fixing stuff when it breaks. Keep your supply chain people happy too - those relationships matter more than you'd think. Continuous improvement and demand forecasting round it out.
Honestly, tech integration is a game changer for production stuff. It automates all the boring repetitive tasks and gives you real-time data so you're not flying blind. Your teams can actually coordinate properly, inventory tracking becomes way less of a nightmare, and you'll catch equipment issues before they totally screw you over. Cloud systems are great because everyone sees the same info at once - no more annoying back-and-forth calls about schedules. I'd start with just one thing though, maybe inventory or scheduling, because jumping into everything at once usually overwhelms people. Once your team gets the hang of it, then you can expand.
Look, supply chain management is basically what keeps your production from falling apart. You need the right stuff showing up when you need it - otherwise you're scrambling for materials or drowning in inventory that's eating your cash. It's like being the middleman between your suppliers and production schedule. Better relationships with suppliers = way more predictable operations. Honestly, most people underestimate how much this impacts everything else. Start by figuring out who your critical suppliers are, then build some backup plans for your most important components. Trust me on this one.
Look, production planning and control are literally what make or break your whole operation. Get it right and you're minimizing waste, keeping inventory balanced, hitting deadlines. Screw it up? Total chaos - bottlenecks everywhere, customers pissed off, cash flow goes to hell. I've seen companies tank because they couldn't get this basic stuff down. Your profit margins take a beating too. Short bursts work better than long sentences sometimes. Honestly, just invest in decent planning tools and track your KPIs religiously. It'll save your sanity and actually help every single department perform better.
Honestly, the hardest part is getting people on board - everyone's stuck in their old routines even when they suck. Training costs a ton upfront too. Your suppliers become make-or-break since you're relying on just-in-time delivery. One late truck? Your whole system's screwed. Quality issues hit way harder without extra inventory sitting around to cover up problems. Oh, and keeping everyone motivated for continuous improvement is exhausting - it never really ends. I'd start with like one small area first to show it actually works before going all-in.
Dude, you're probably sitting on a goldmine of data already. Most factories collect tons of stuff but never actually dig into it - which is honestly kind of crazy when you think about it. Start tracking your equipment downtime, defects, cycle times, all that. Patterns will jump out that you'd never catch from daily reports. Predictive analytics can help you see maintenance issues coming and forecast demand better. Don't go crazy though - pick one process first and build from there. Real-time dashboards are clutch for monitoring KPIs, but seriously, start small or you'll overwhelm yourself.
Okay so the big ones you need are OEE, throughput, quality rates, and cycle time. OEE is seriously the best metric out there - combines availability, performance, and quality into one clean number. Track your scrap rates and downtime too, plus labor productivity. Cost per unit and on-time delivery matter since they hit your profits directly. Honestly, if you're just starting out? Focus on OEE and throughput first. Those two will show you where the real problems are hiding. You can always add the other stuff once you've got those dialed in.
Honestly, going green is reshaping everything in production right now. First thing - audit where you're at environmentally, then grab the easy wins like better shipping routes or renewable energy. Material sourcing gets tricky since you're suddenly weighing sustainability against cost (total pain initially). But here's the thing: customers actually want this stuff now, plus regulations aren't getting any looser. Your waste reduction and energy choices hit compliance AND profit margins. I'd say start small - maybe one supplier switch or process tweak - then build from there. It's messier than the old way but pays off.
Start with statistical process control - track your defect rates and use control charts to catch problems early. Don't just inspect at the end when you can't fix anything without major cost. Set up checkpoints during critical stages instead. Six Sigma's pretty solid if your team's willing to learn it (though honestly some places go overboard with it). You've gotta audit your suppliers too since garbage in equals garbage out. Keep your equipment calibrated and maintained - saves tons of headaches later. Pick one method first, nail it down, then add more techniques gradually.
Dude, training your crew is huge for production quality and speed. Better trained workers = fewer screws ups and less downtime. They'll catch issues before they become big problems too. I actually saw one place drop their waste by like 30% after revamping their training - pretty wild numbers. Don't just do it once when people start though. That's where most places mess up. Figure out what's causing your biggest headaches on the floor first, then build your training around fixing those specific things. Makes way more sense than generic stuff nobody remembers.
So JIT is getting stuff delivered right when you need it - not weeks early. Cuts down on storage costs big time since you're not hoarding inventory that might go bad. Honestly scared me at first because there's zero cushion if something goes wrong! Cash flow gets way better though, plus you need less warehouse space. Responding to customer demand becomes super quick too. Your suppliers have to be totally reliable - that's non-negotiable. Oh and the scheduling has to be perfect. I'd test it on just one product first before doing everything.
So basically you go from doing everything yourself to watching over the automated stuff and jumping in when things go wrong. Way less micromanaging each step. You'll spend more time looking at data patterns and figuring out how to make workflows better. Honestly, it's kind of nice once you adjust to it - though the transition feels weird at first. Your planning gets more predictive because you're getting actual real-time data instead of guessing. Less time putting out fires, more time on improving processes. I'd start with whatever tasks you do over and over - that's usually the low-hanging fruit for automation.
So basically, batch production is when you make stuff in chunks - like a bakery doing 50 loaves, then switching to muffins or whatever. Continuous production never stops running, think oil refineries that go 24/7 (and when they break down, it's a total disaster). Batch lets you switch between different products easily, but continuous is way more efficient for cranking out massive volumes. Honestly, it comes down to what you're making. Need variety? Go batch. Making tons of the same thing? Continuous will save you money.
Honestly, good communication just tears down all those annoying silos that wreck team productivity. Clear priorities and deadlines mean people actually collaborate instead of working against each other - which happens way more than it should, tbh. Trust builds naturally when everyone's on the same page. You'll get fewer mix-ups, quicker problem-solving, and team members who actually flag issues before they blow up. The trick is making it two-way communication, not just managers talking down to everyone. Regular check-ins where people can openly share updates and concerns? That's your starting point right there.
Honestly, you'll want to focus on AI automation and predictive maintenance first - those give the biggest bang for your buck. Digital twins are everywhere now (virtual copies of your production line so you can test stuff without breaking anything). Supply chain resilience is obviously huge after the past few years of chaos. IoT sensors are connecting everything in real-time, which is pretty cool actually. There's also this massive shift toward sustainable practices and circular economy stuff. Oh, and carbon-neutral operations are becoming non-negotiable. I'd say pick whatever matches your biggest headache right now and just start there.
-
Excellent Designs.