Project Governance Framework PowerPoint Presentation Slides
Our Project Governance Framework PowerPoint Presentation Slides are topically designed to provide an attractive backdrop to any subject. Use them to look like a presentation pro.
- Google Slides is a new FREE Presentation software from Google.
- All our content is 100% compatible with Google Slides.
- Just download our designs, and upload them to Google Slides and they will work automatically.
- Amaze your audience with SlideTeam and Google Slides.
-
Want Changes to This PPT Slide? Check out our Presentation Design Services
- WideScreen Aspect ratio is becoming a very popular format. When you download this product, the downloaded ZIP will contain this product in both standard and widescreen format.
-

- Some older products that we have may only be in standard format, but they can easily be converted to widescreen.
- To do this, please open the SlideTeam product in Powerpoint, and go to
- Design ( On the top bar) -> Page Setup -> and select "On-screen Show (16:9)” in the drop down for "Slides Sized for".
- The slide or theme will change to widescreen, and all graphics will adjust automatically. You can similarly convert our content to any other desired screen aspect ratio.
Compatible With Google Slides

Get This In WideScreen
You must be logged in to download this presentation.
PowerPoint presentation slides
Keep your audience glued to their seats with professionally designed PPT slides. This deck comprises of total of sixtyseven slides. It has PPT templates with creative visuals and well researched content. Not just this, our PowerPoint professionals have crafted this deck with appropriate diagrams, layouts, icons, graphs, charts and more. This content ready presentation deck is fully editable. Just click the DOWNLOAD button below. Change the colour, text and font size. You can also modify the content as per your need. Get access to this well crafted complete deck presentation and leave your audience stunned.
People who downloaded this PowerPoint presentation also viewed the following :
Content of this Powerpoint Presentation
Slide 1: This slide introduces Project Governance Framework. State Your Company Name and begin.
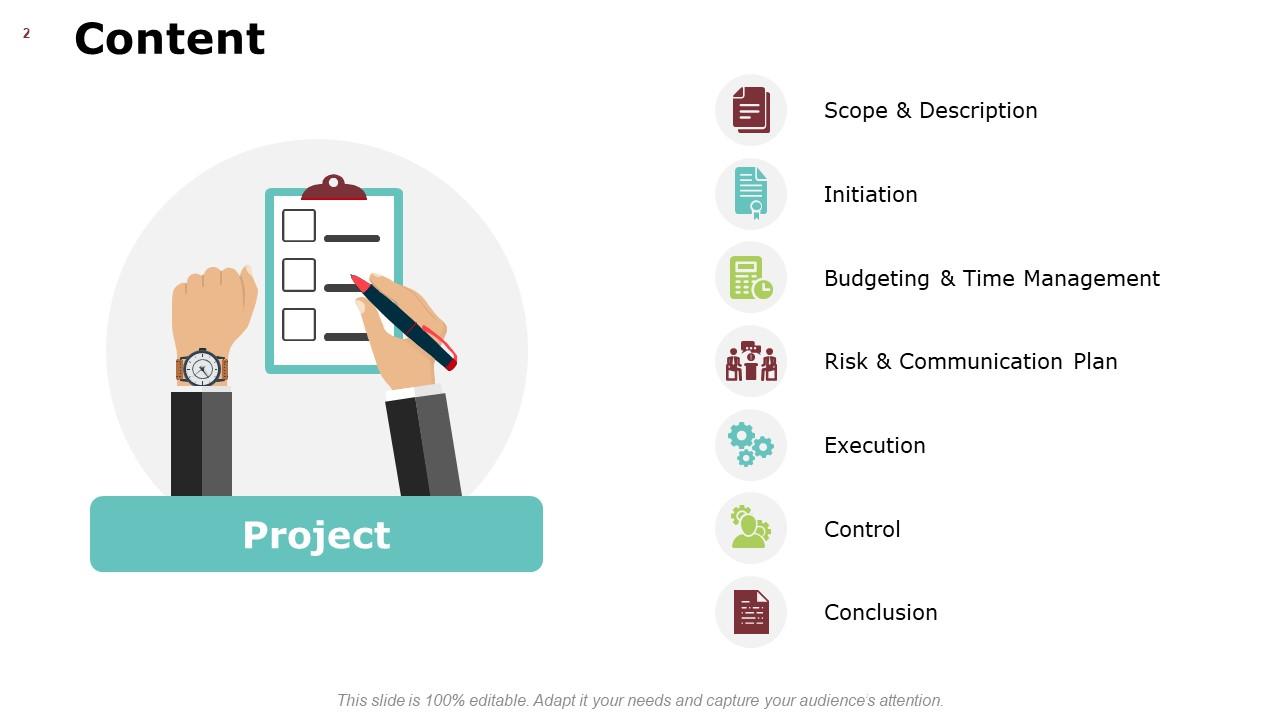
Slide 2: This slide shows Content of the presentation.
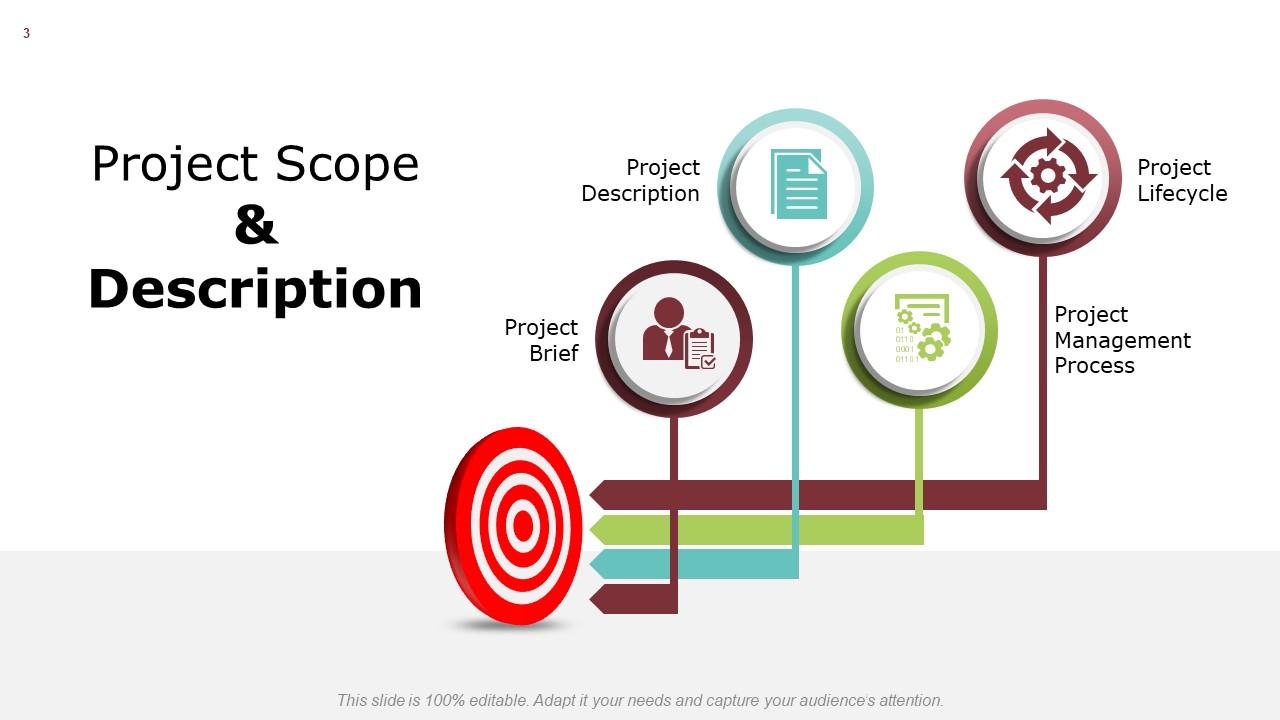
Slide 3: This slide presents Project Scope & Description with imagery describing- Project Brief, Project Description, Project Lifecycle, Project Management Process.
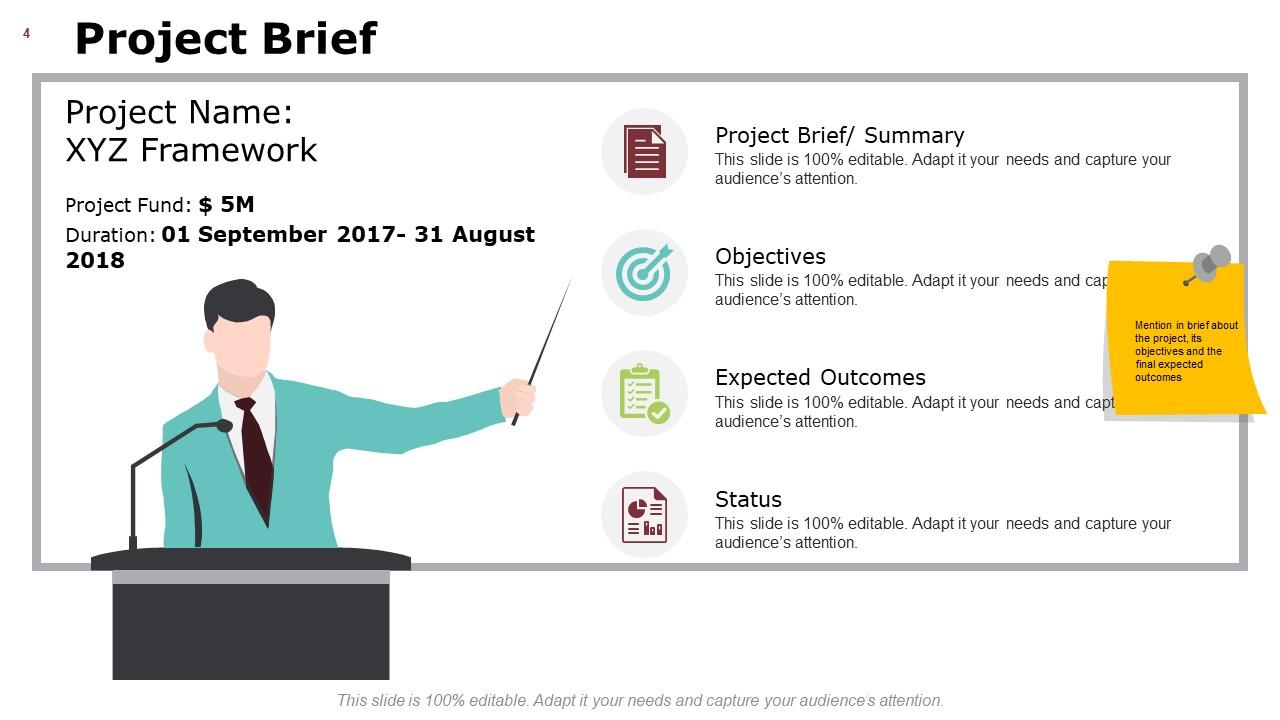
Slide 4: This slide displays Project Brief describing- Project Brief/ Summary, Objectives, Expected Outcomes, Status.
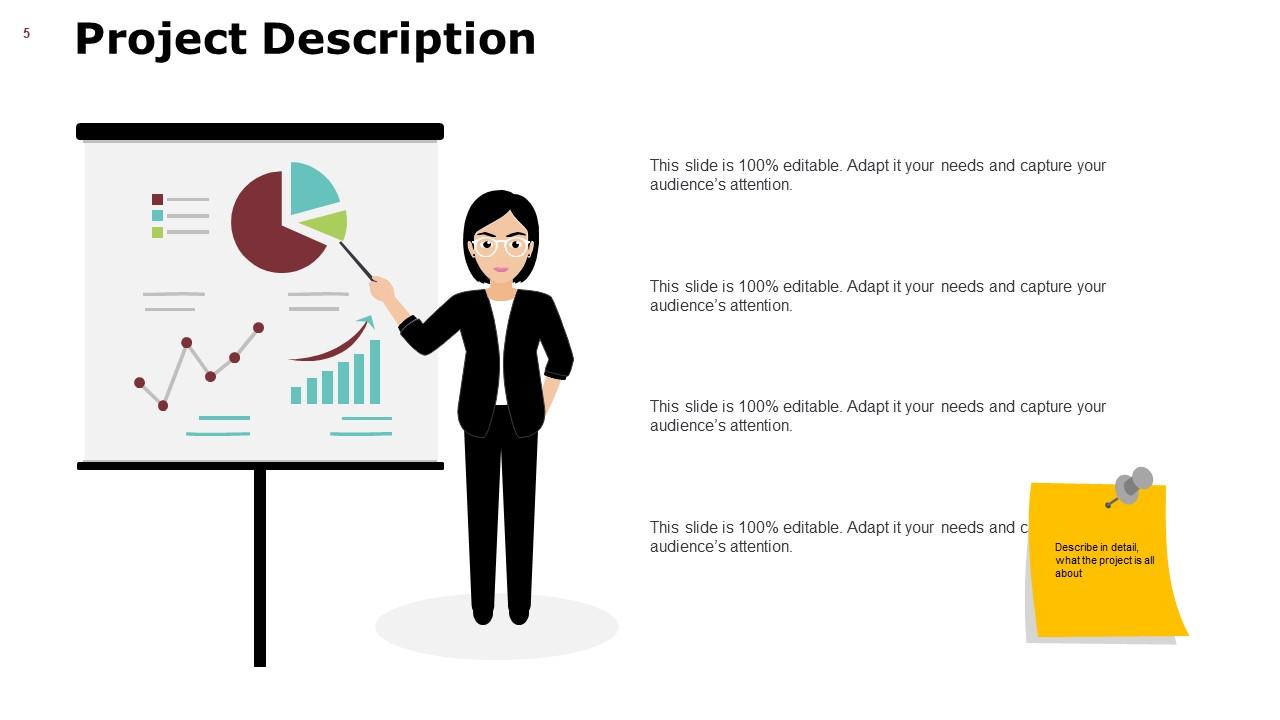
Slide 5: This slide showcases Project Description with related imagery and text boxes to show information.
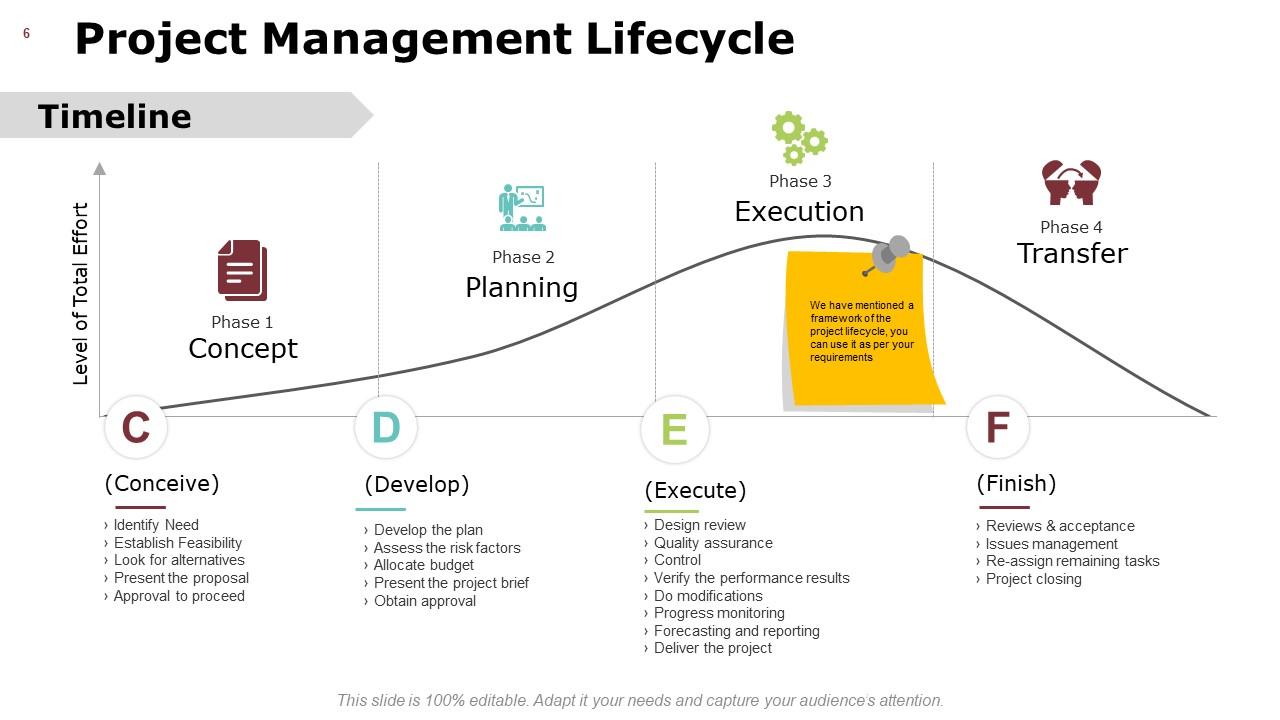
Slide 6: This slide represents Project Management Lifecycle describing- Finish, Conceive, Develop, Execute.
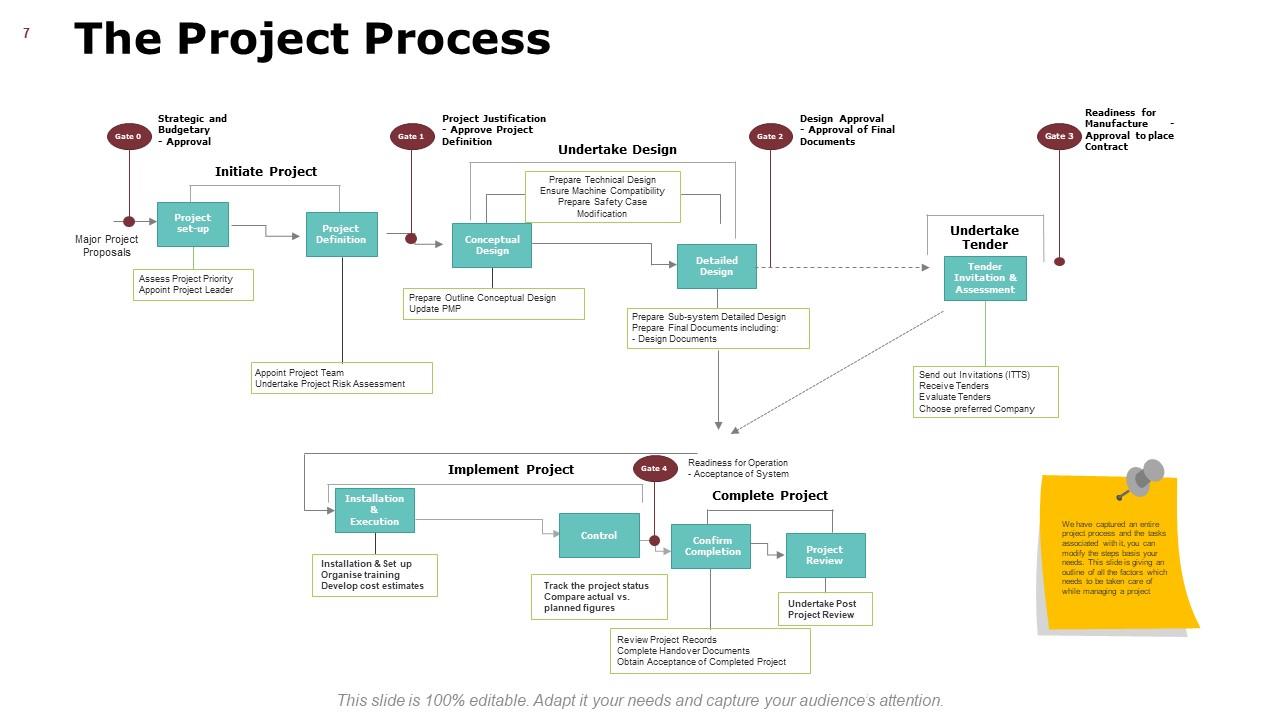
Slide 7: This slide shows The Project Process as- Initiate Project, Undertake Design, Undertake Tender, Implement Project, Complete Project.
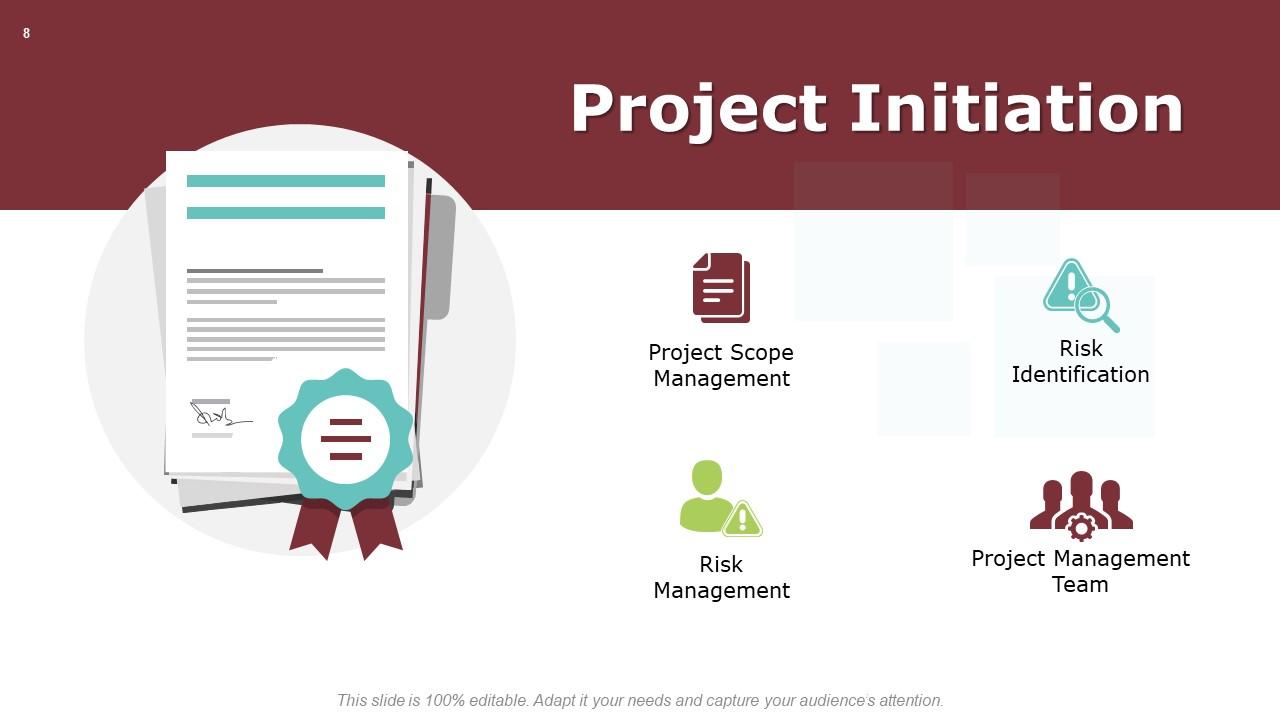
Slide 8: This slide presents Project Initiation with- Project Scope Management, Risk Management, Risk Identification, Project Management Team.
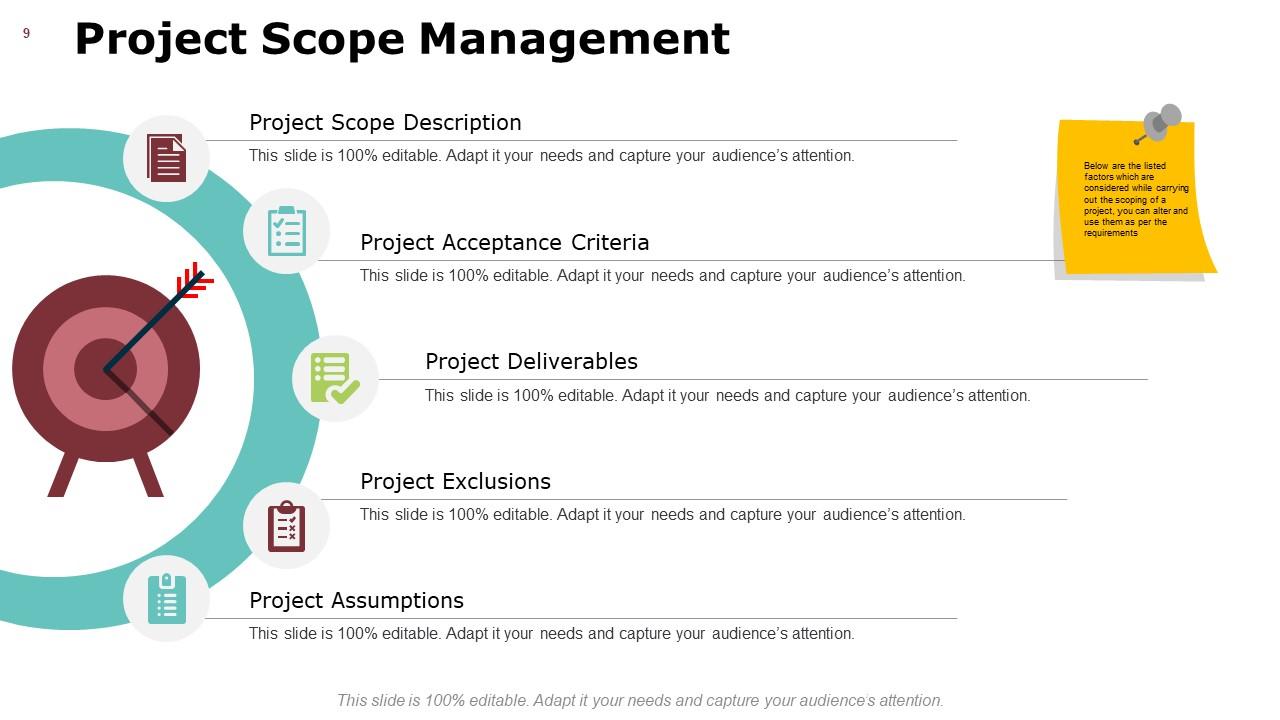
Slide 9: This slide represents Project Scope Management describing- Project Deliverables, Project Assumptions, Project Exclusions, Project Scope Description, Project Acceptance Criteria.
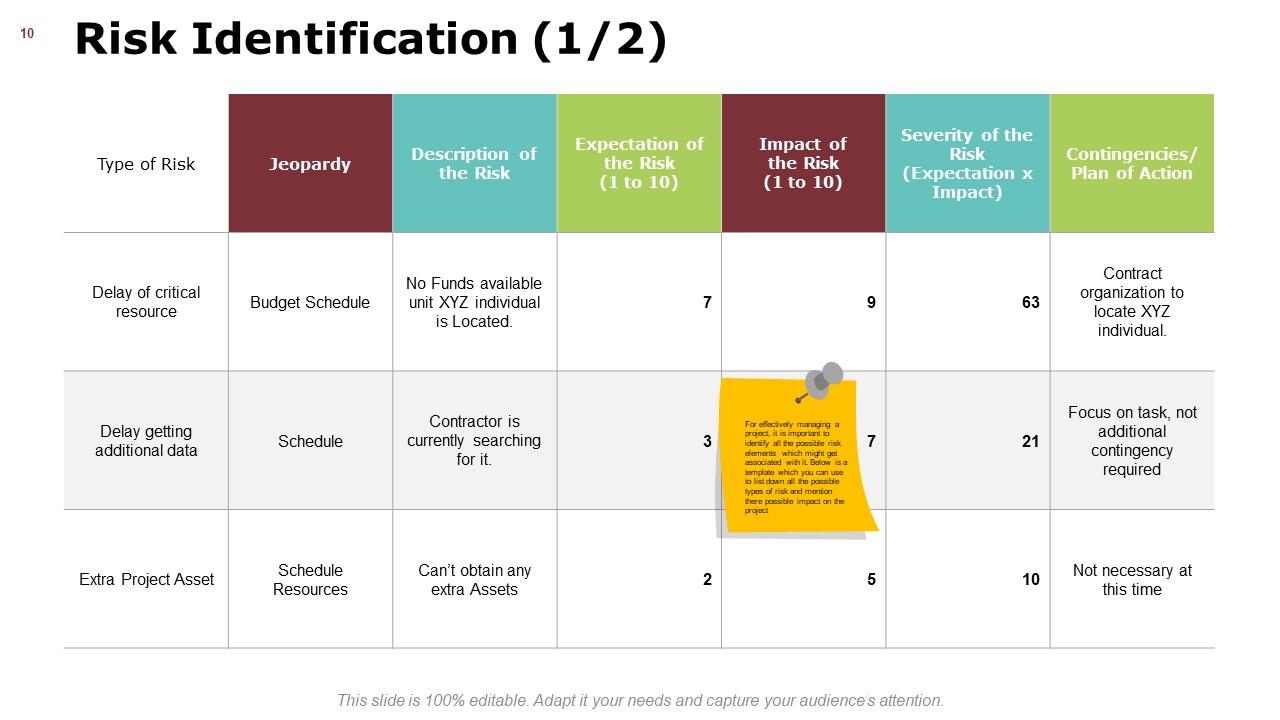
Slide 10: This slide displays Risk Identification in a table form describing- Tyoe of risk, Delay of critical resource, delay getting additional data and extra project asset.
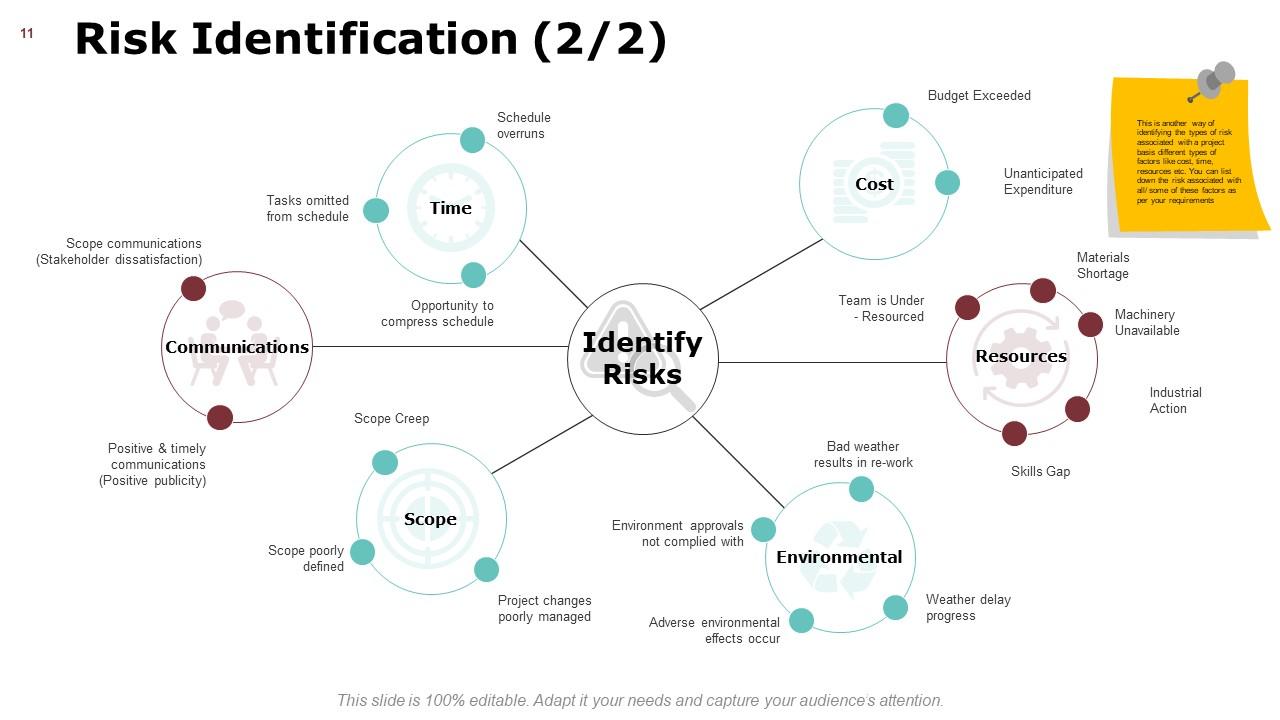
Slide 11: This is another slide on Risk Identification describing- Cost, Resources, Environmental, Scope, Communications, Time.
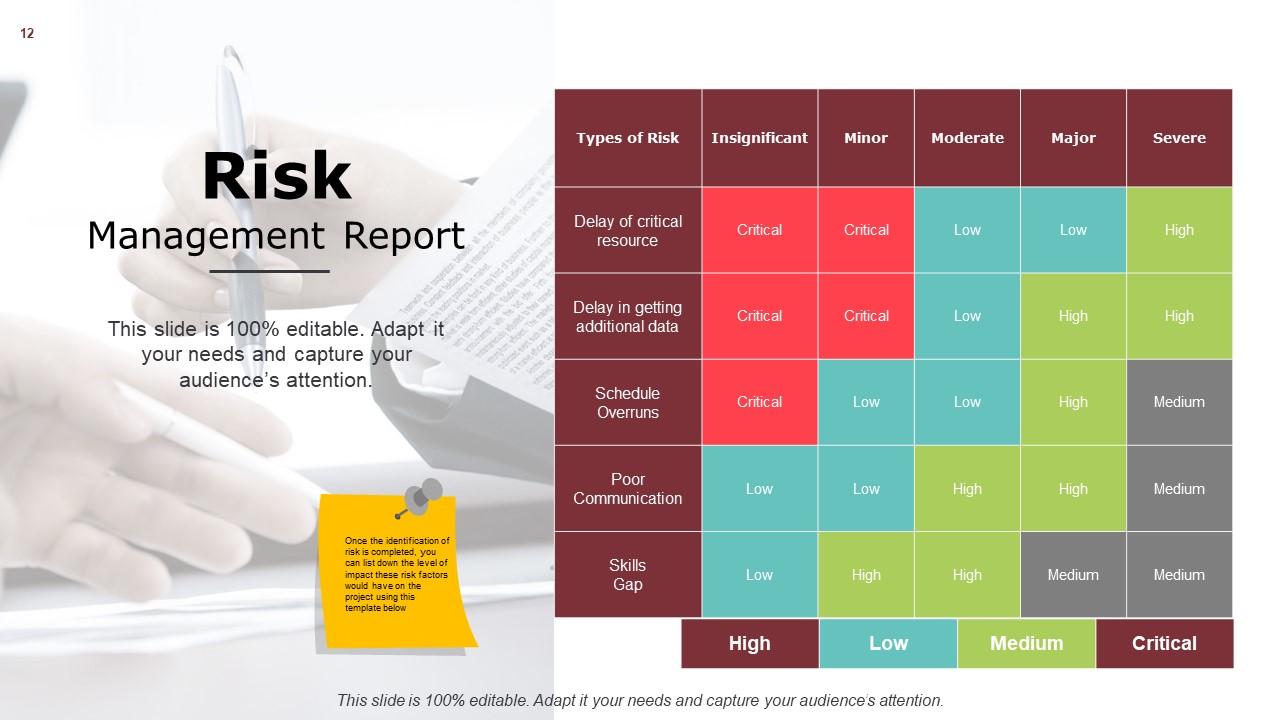
Slide 12: This slide gives Risk Management Report describing types and degree of risk.
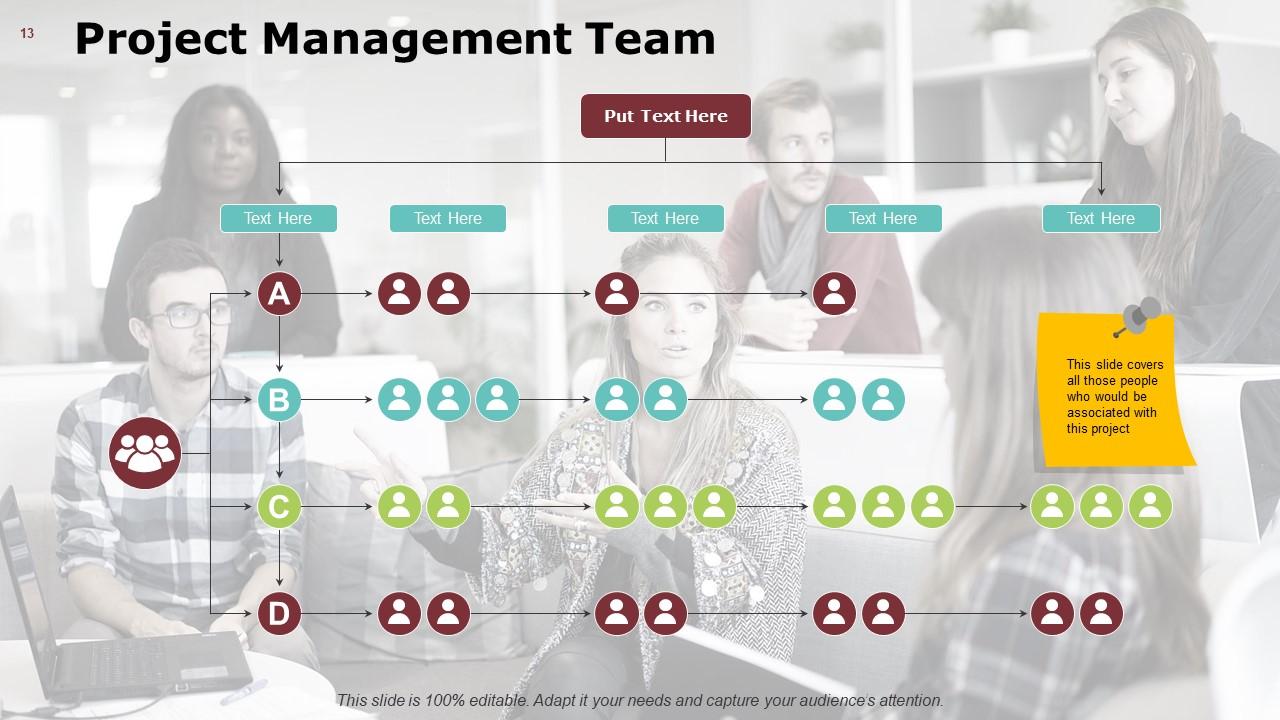
Slide 13: This slide shows Project Management Team in a hierarchy for to show employees with their designation.
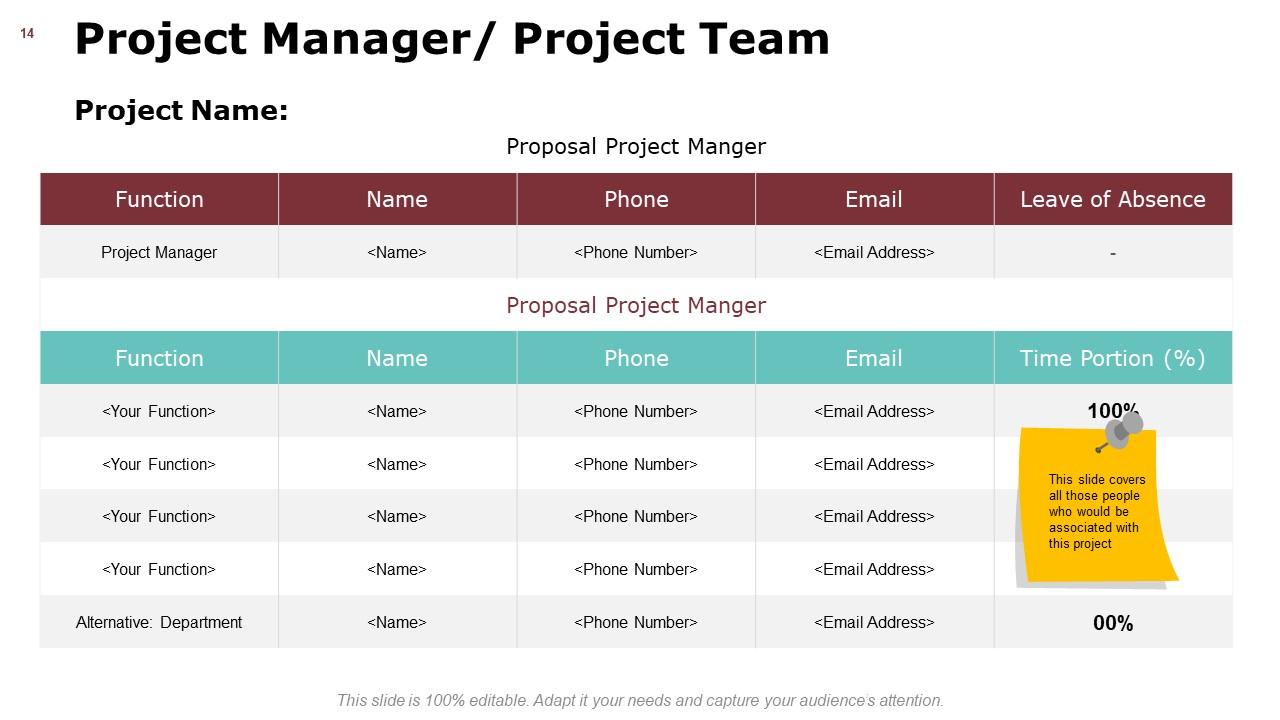
Slide 14: This slide presents Project Manager/ Project Team with functions, name, phone, email etc.
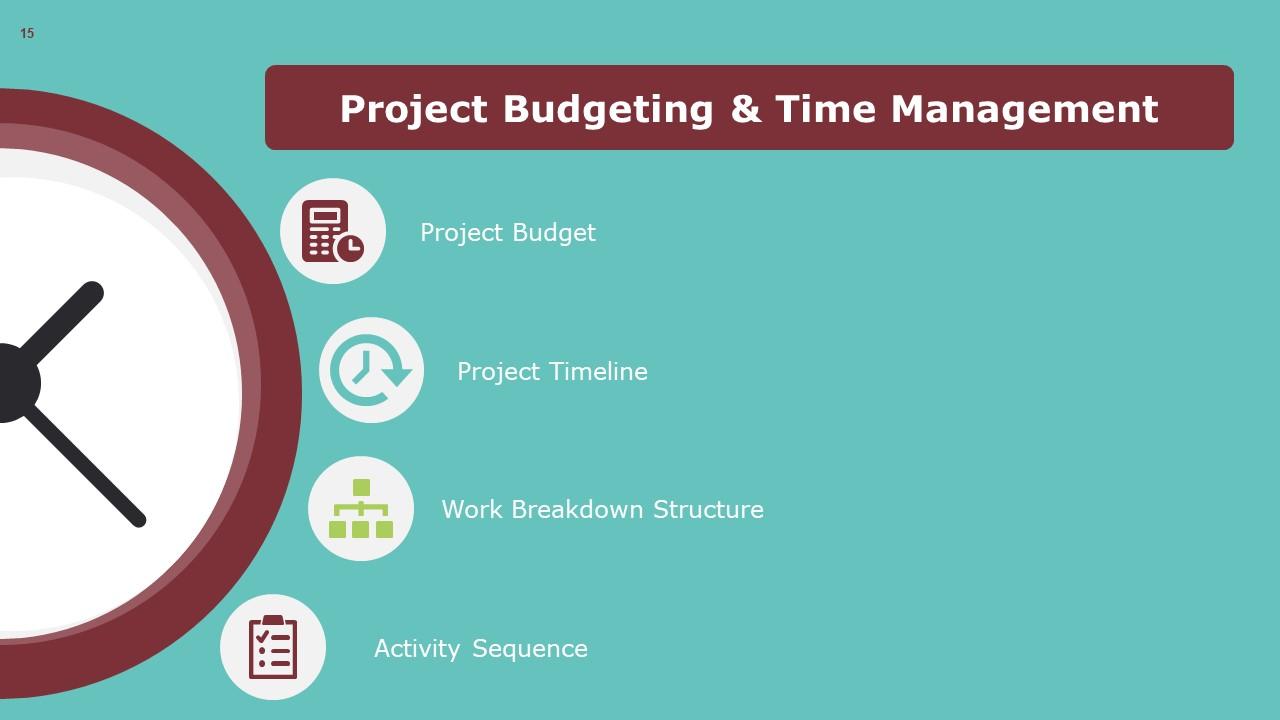
Slide 15: This slide displays Project Budgeting & Time Management with- Project Budget, Project Timeline, Work Breakdown Structure, Activity Sequence.
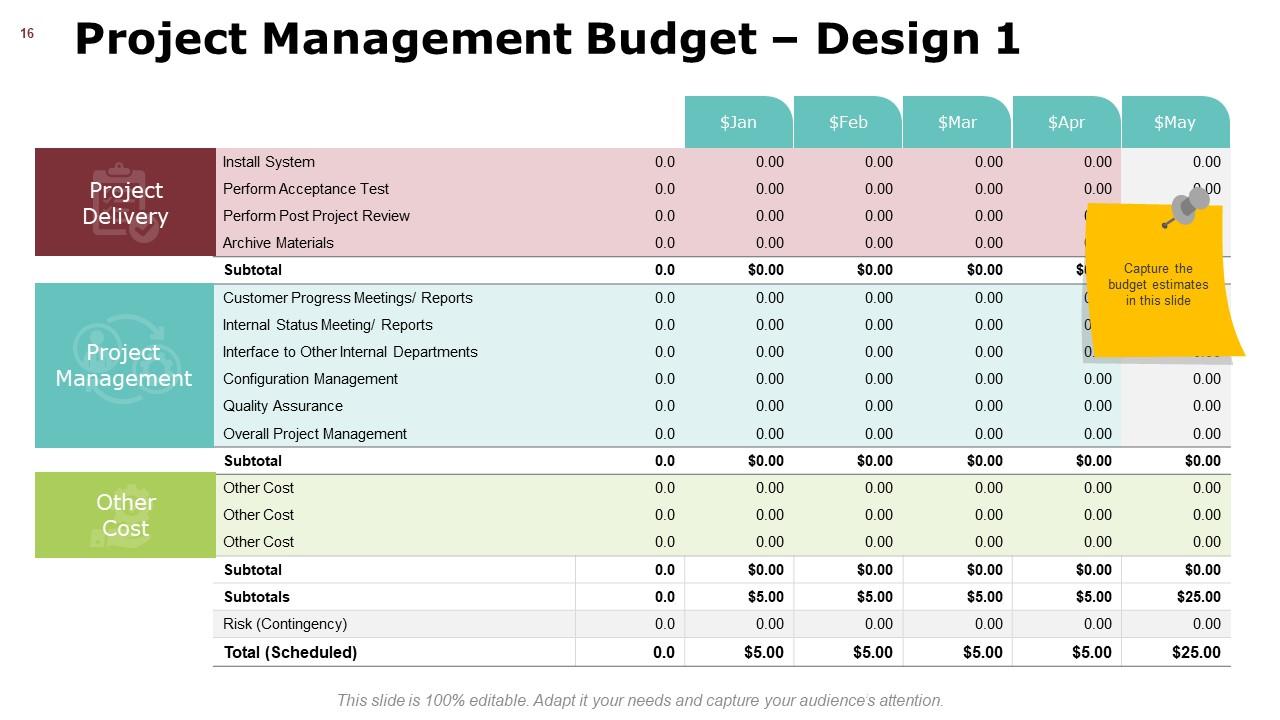
Slide 16: This slide represents Project Management Budget with project delivery, project management and other costs.
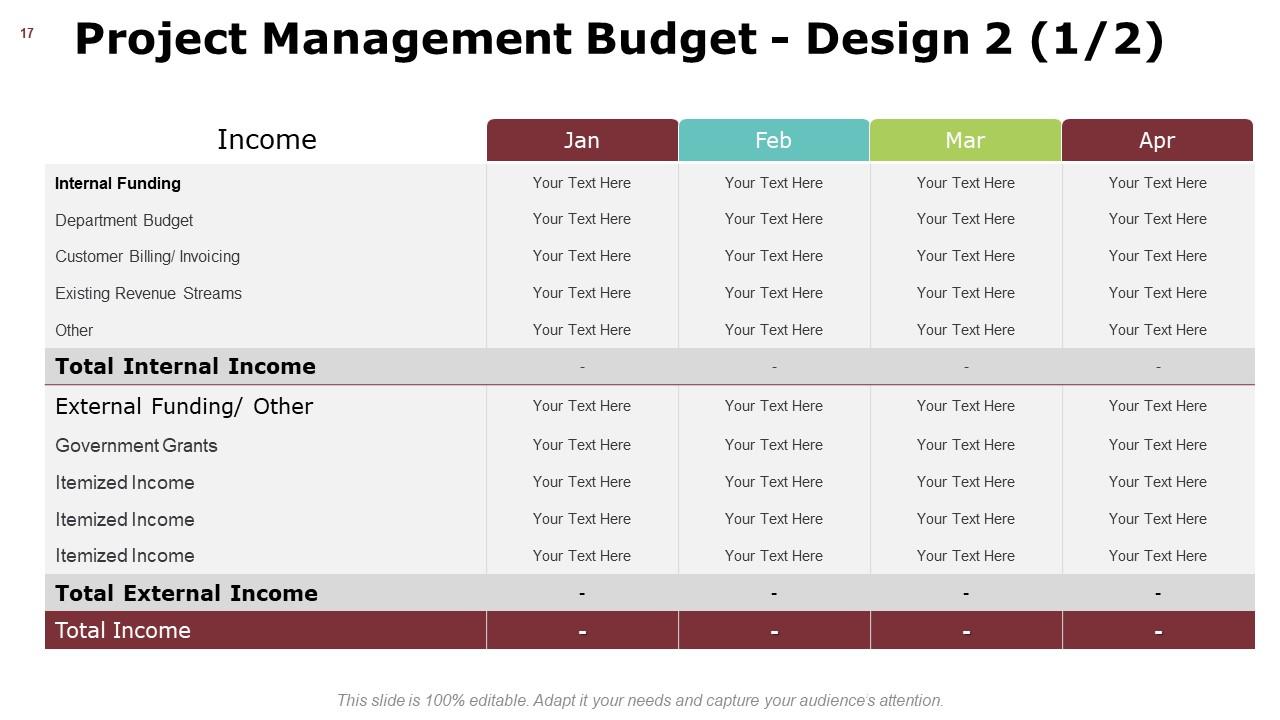
Slide 17: This is another slide on Project Management Budget with internal and external income.
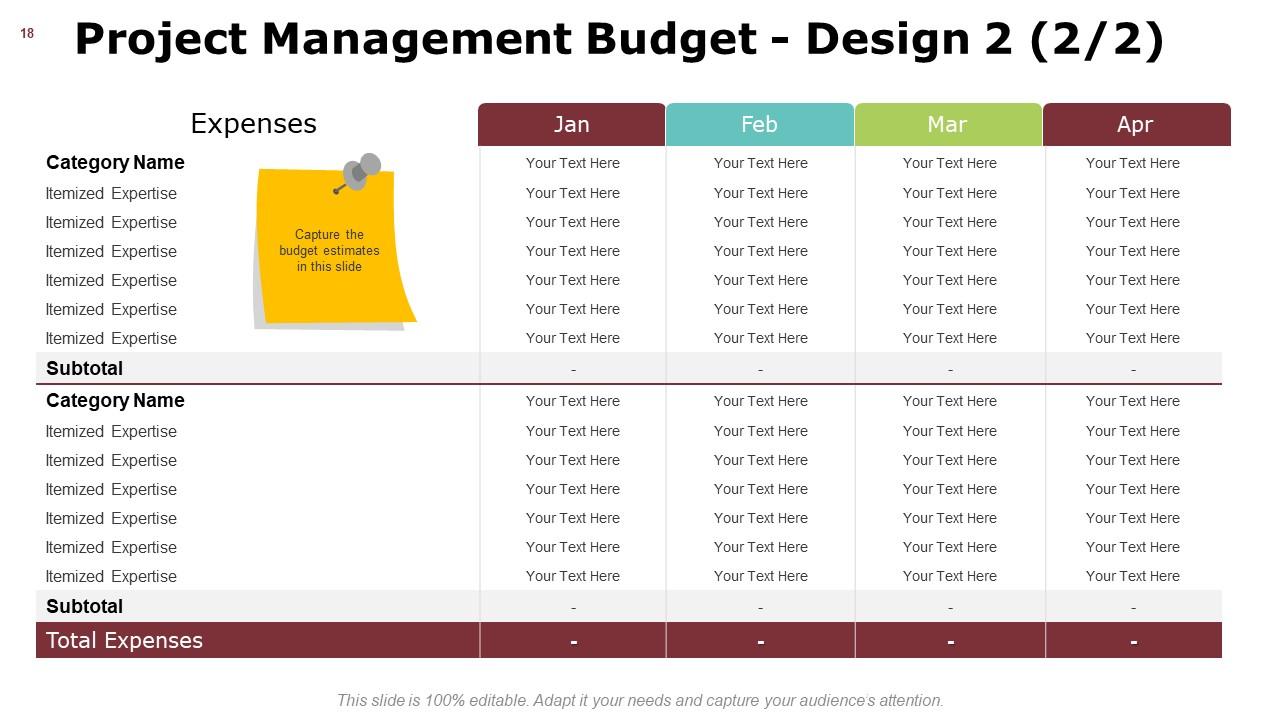
Slide 18: This is another slide continuing Project Management Budget describing expenses.
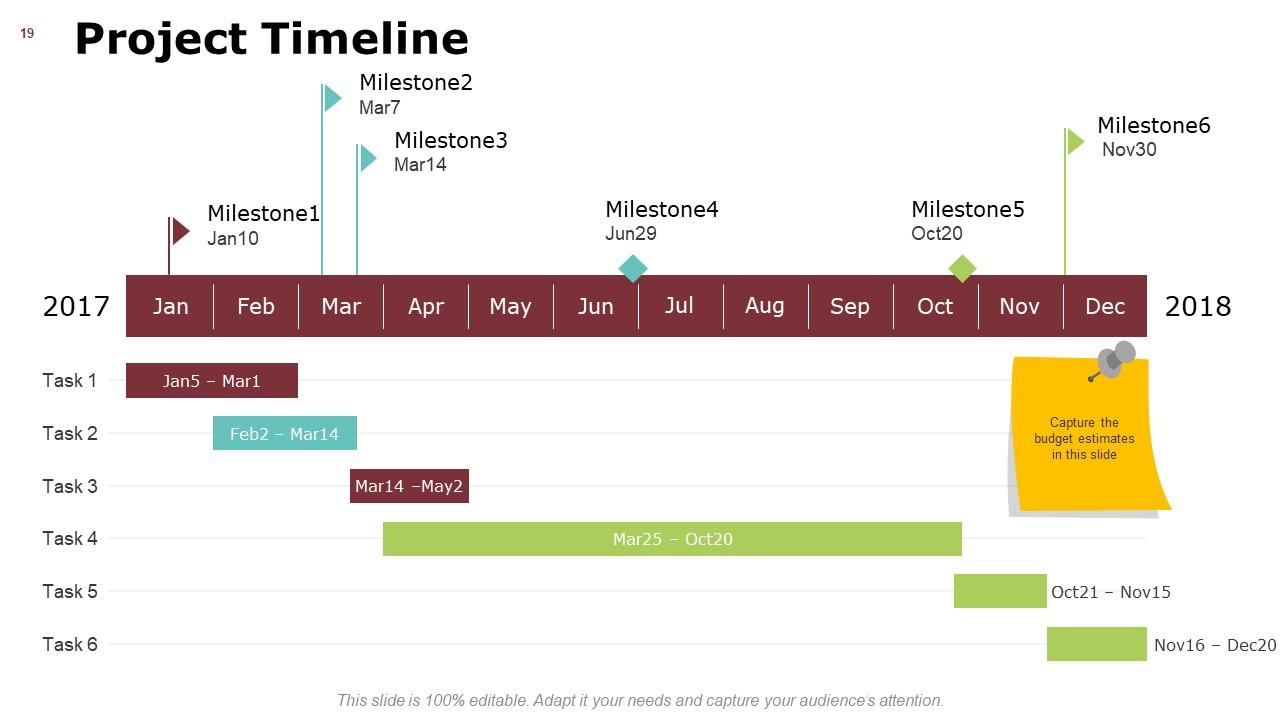
Slide 19: This slide showcases Project Timeline with months, milestones etc.
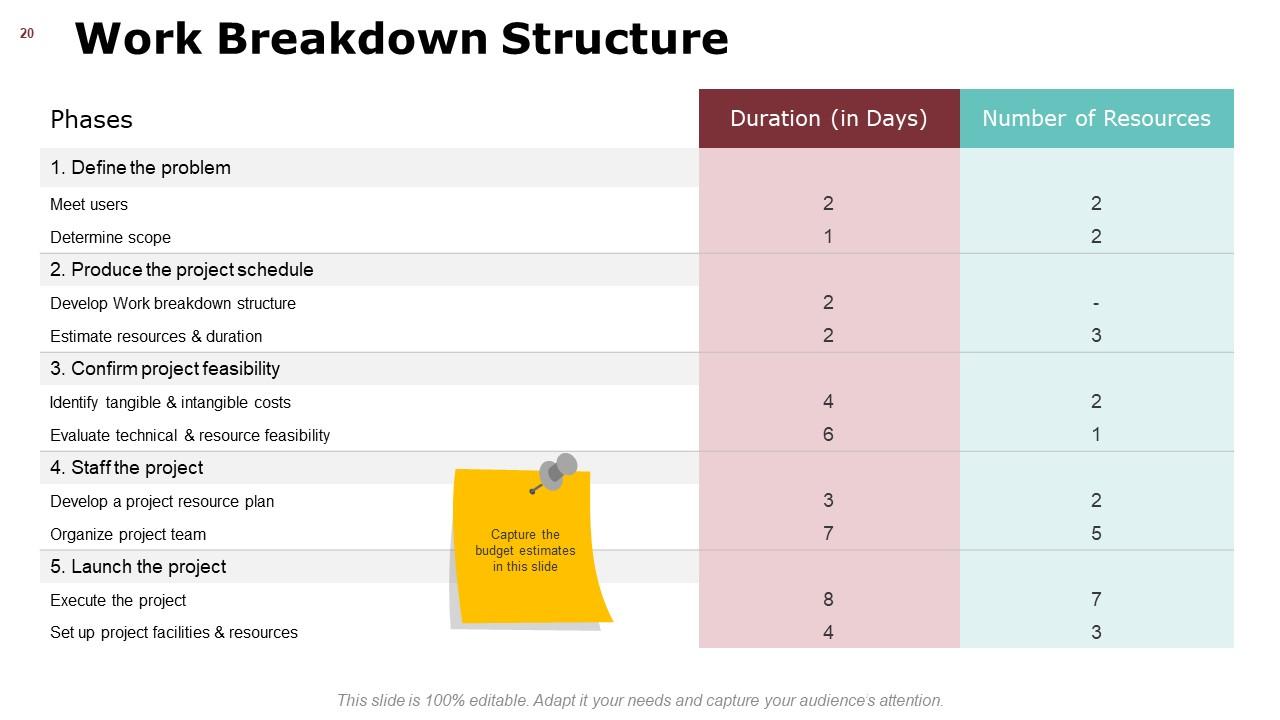
Slide 20: This slide shows Work Breakdown Structure with Phases, duration and number of resources.
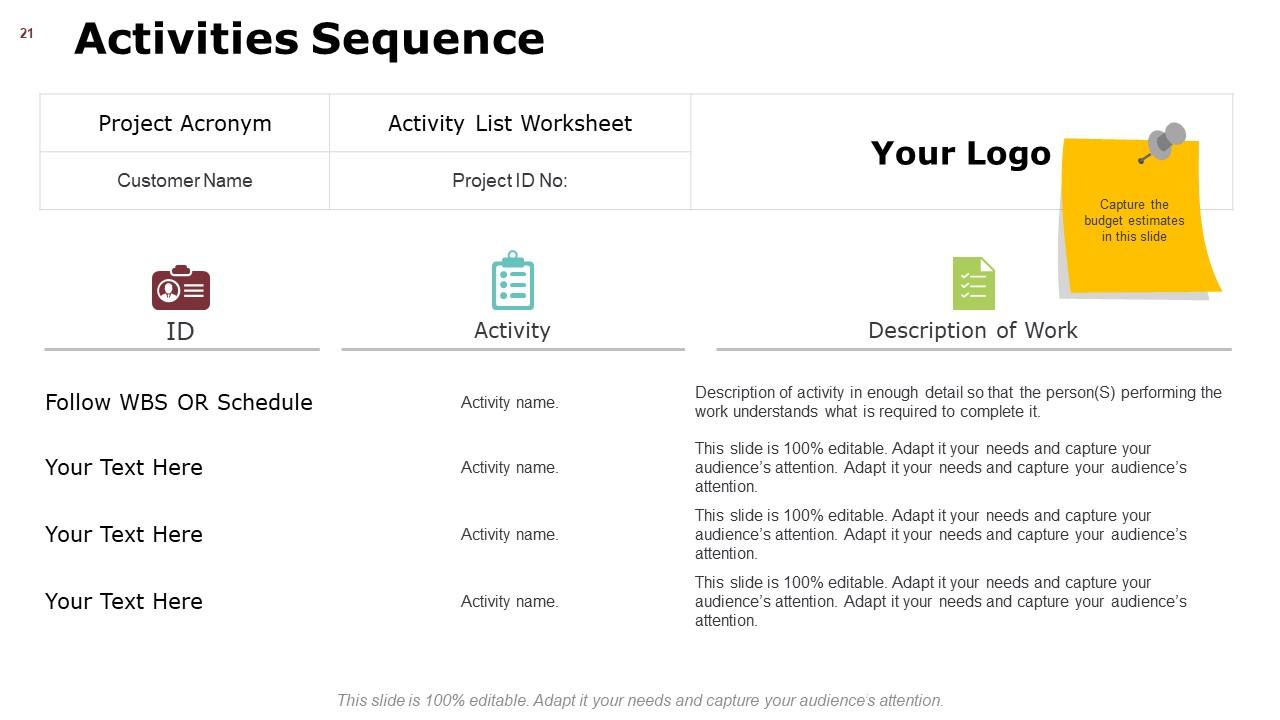
Slide 21: This slide presents Activities Sequence with Project Acronym, Activity list worksheet, ID, Activity, Description of Work.
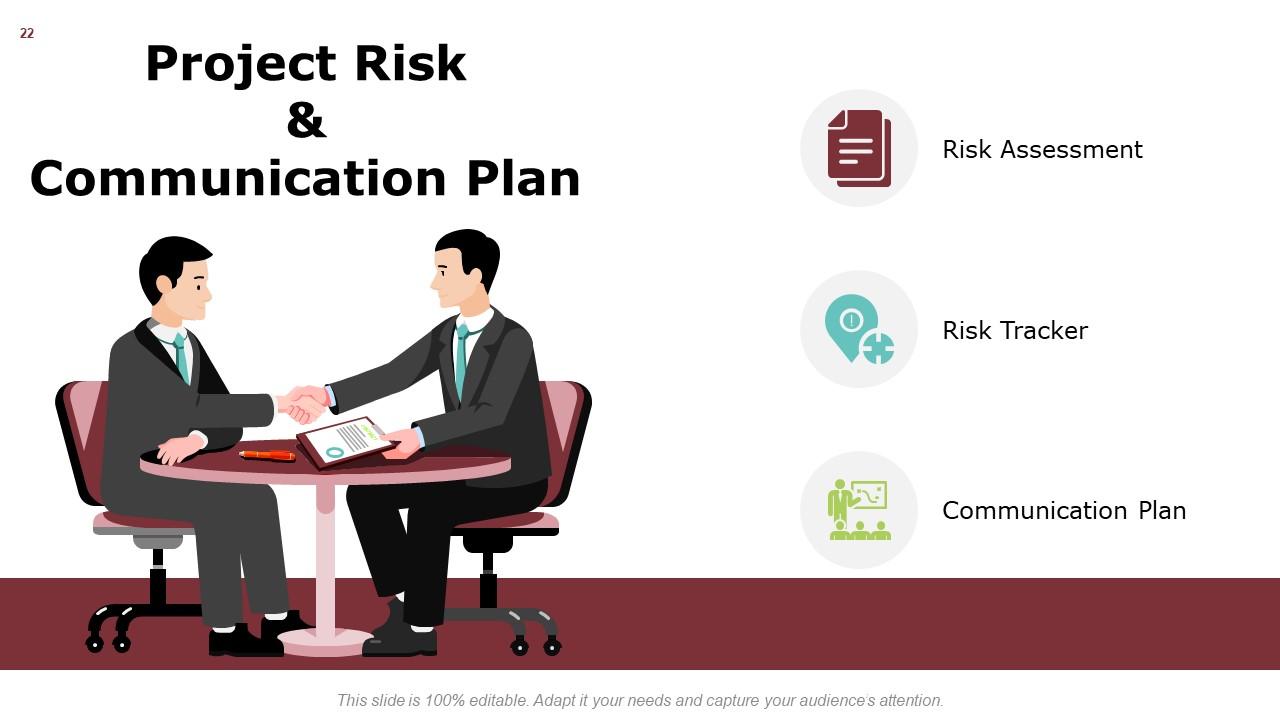
Slide 22: This slide displays Project Risk & Communication Plan with- Risk Assessment, Risk Tracker, Communication Plan.
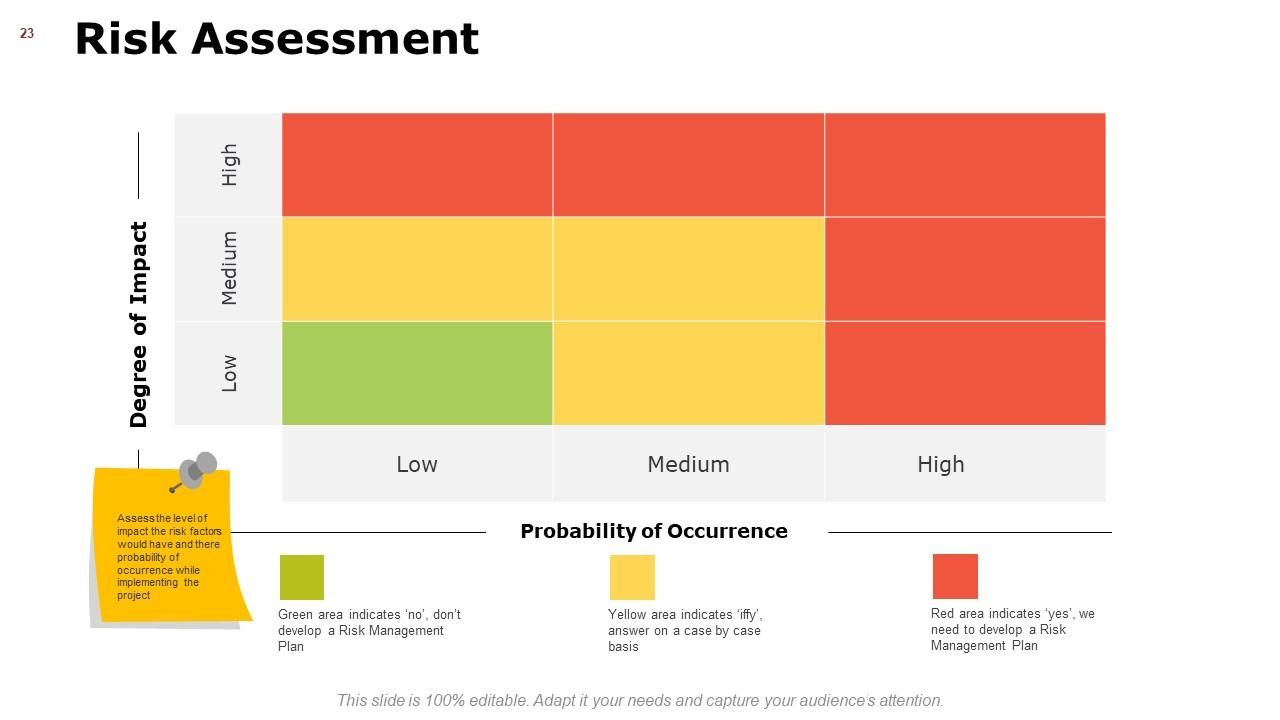
Slide 23: This slide represents Risk Assessment in a graph form with low, medium and high as degree of impact.
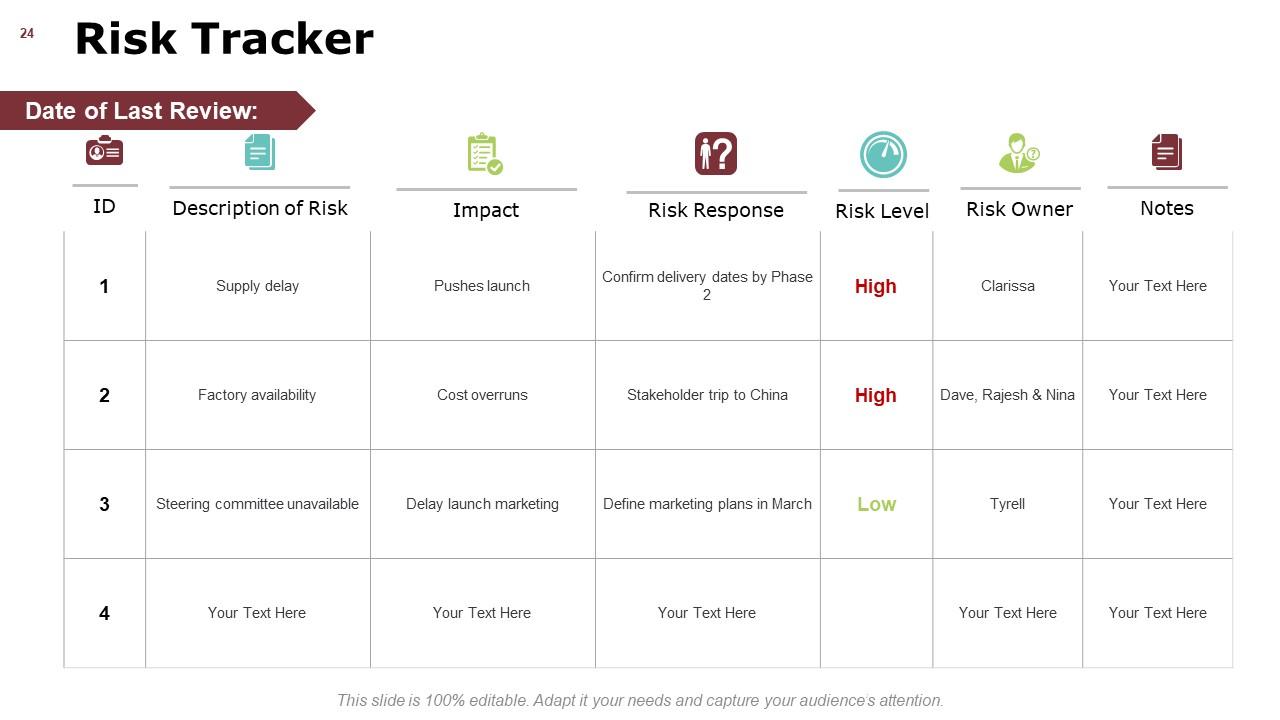
Slide 24: This slide showcases Risk Tracker describing- ID, Description of Risk, Impact, Risk Response, Risk Level, Risk Owner, Notes.
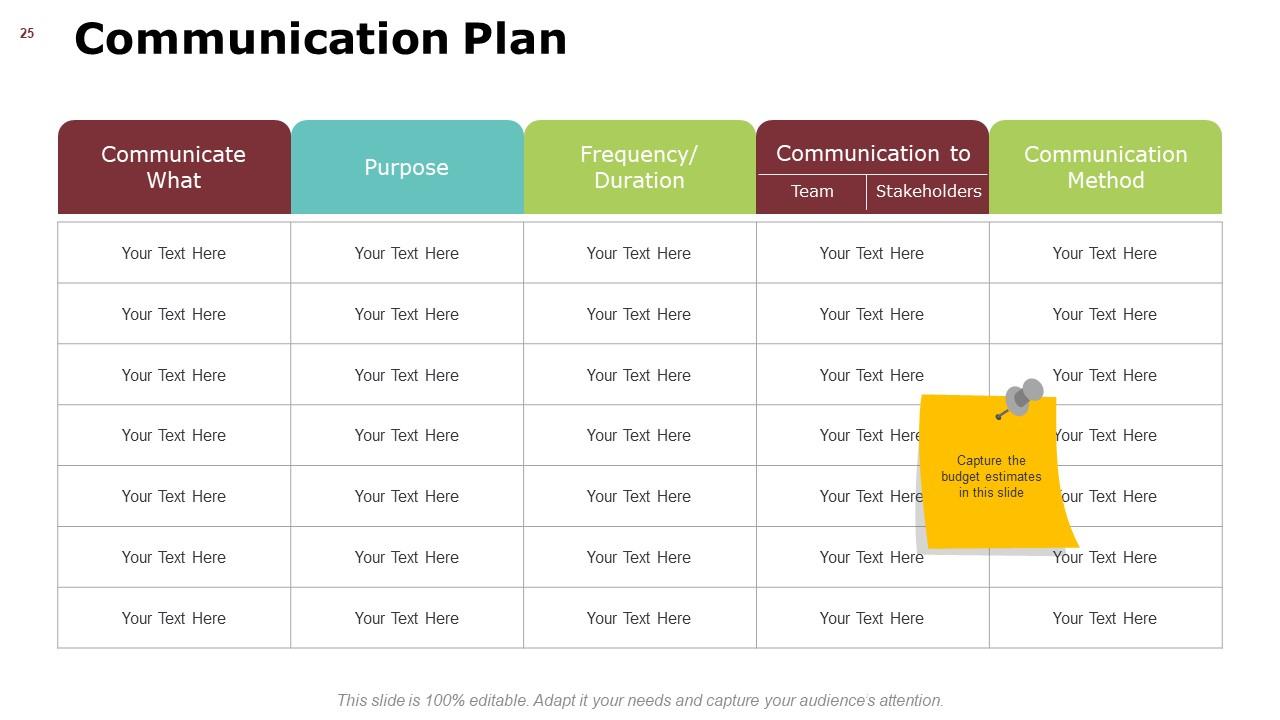
Slide 25: This slide shows Communication Plan describing- Communicate What, Purpose, Frequency/ Duration, Communication to Team/Stakeholders, Communication Method.
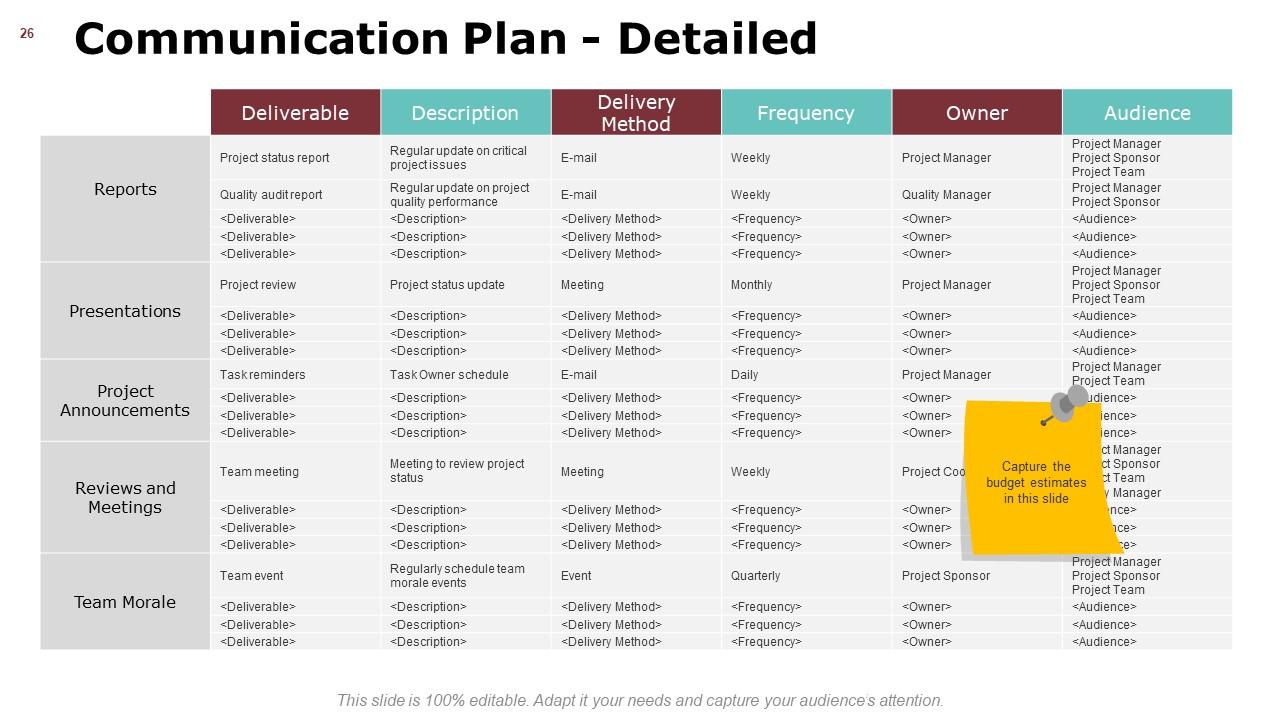
Slide 26: This slide presents Communication Plan - Detailed ina a table form with related text boxes to show information.
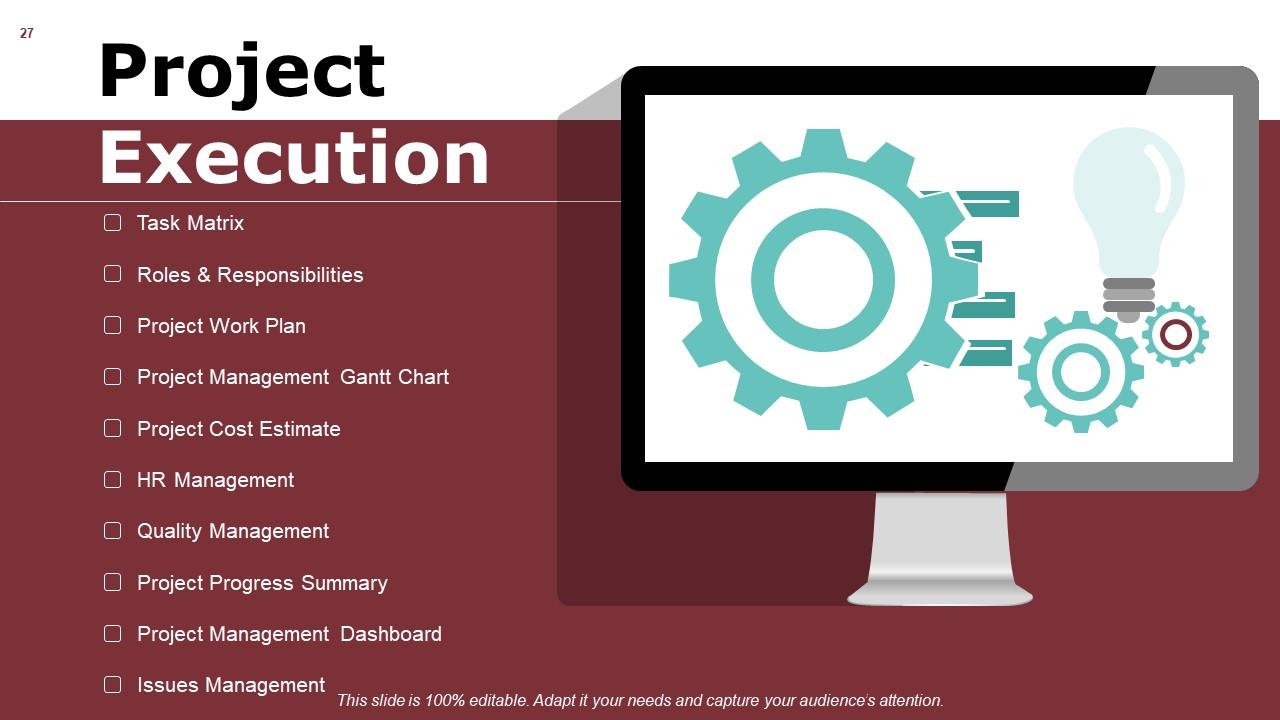
Slide 27: This slide displays Project Execution describing- Task Matrix, Roles & Responsibilities, Project Work Plan, Project Management Gantt Chart, Project Cost Estimate, HR Management, Quality Management, Project Progress Summary, Project Management Dashboard, Issues Management.
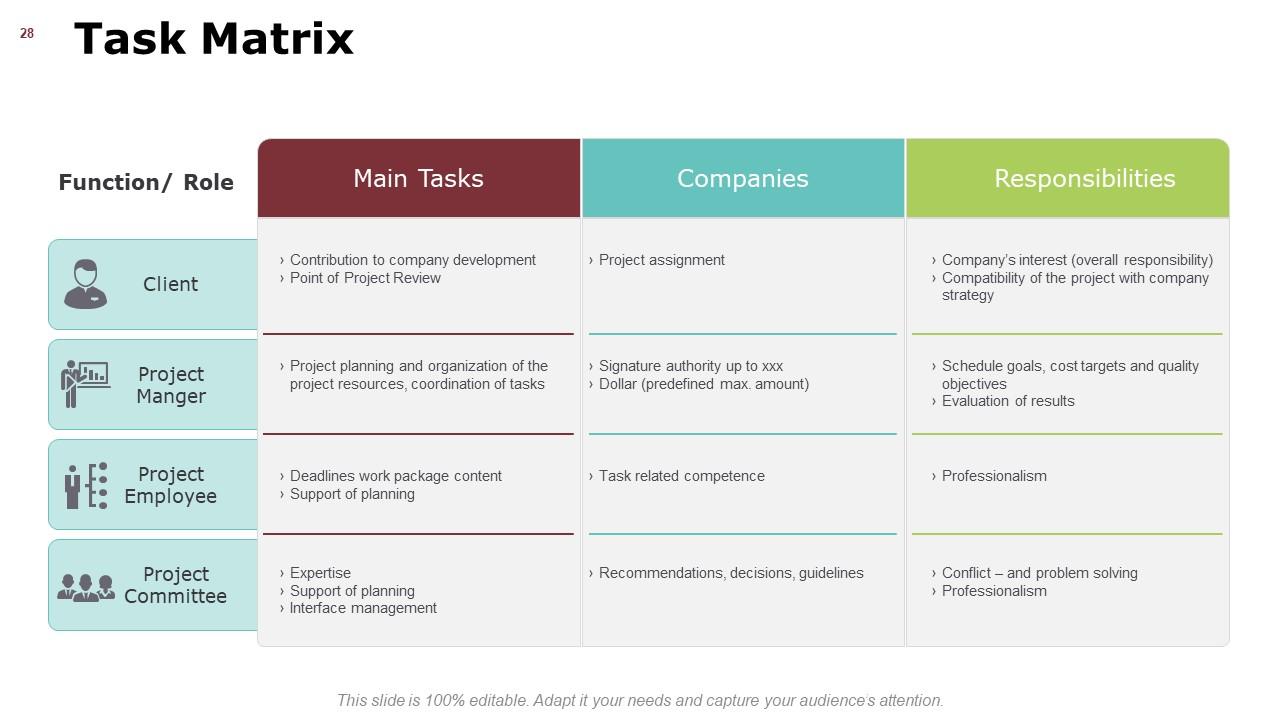
Slide 28: This slide represents Task Matrix describing- Main tasks, functions, responsibilities, client, project manager, project employee, project committee.
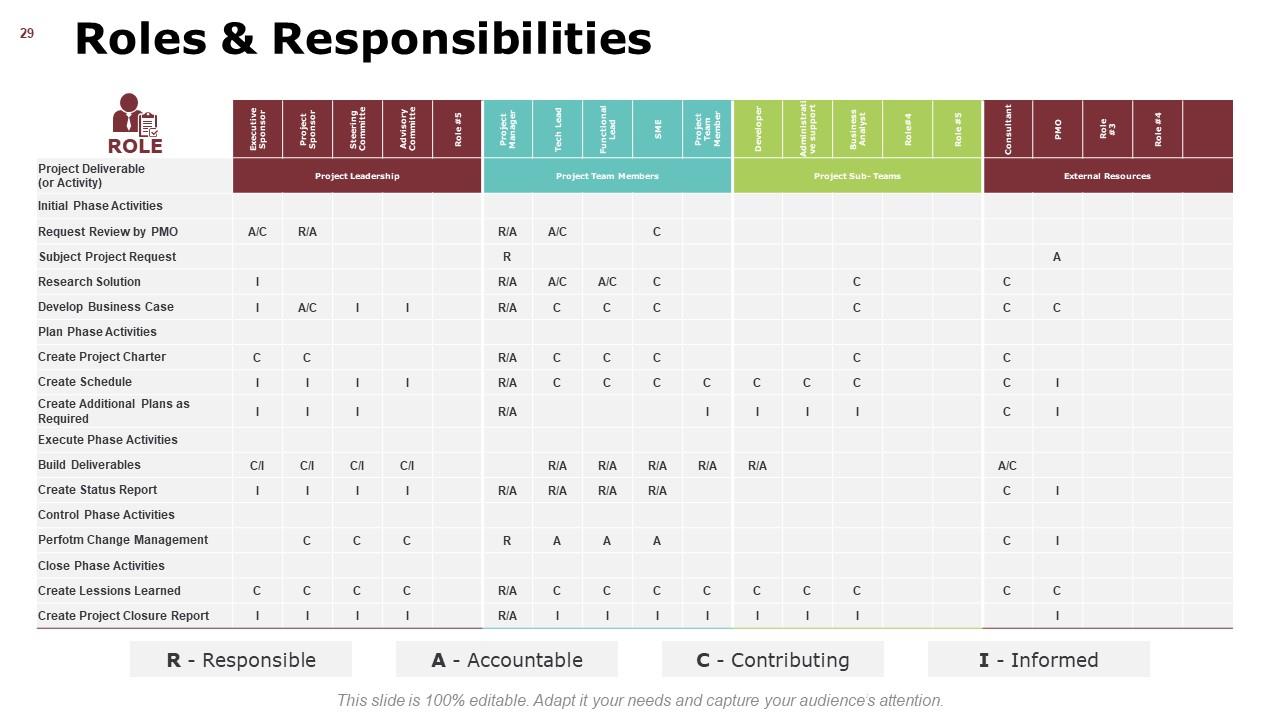
Slide 29: This slide showcases Roles & Responsibilities with related text to show information.
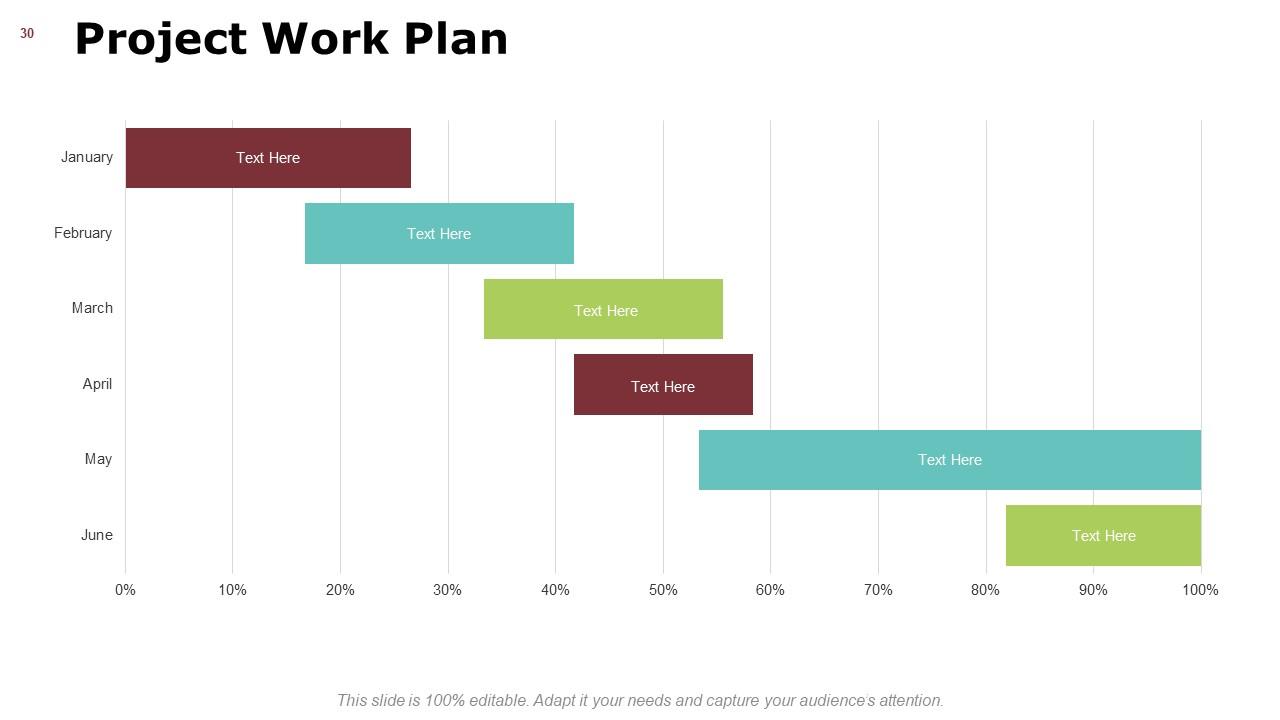
Slide 30: This slide shows Project Work Plan in a graph form with months and percentage. Put relevand data accordingly.
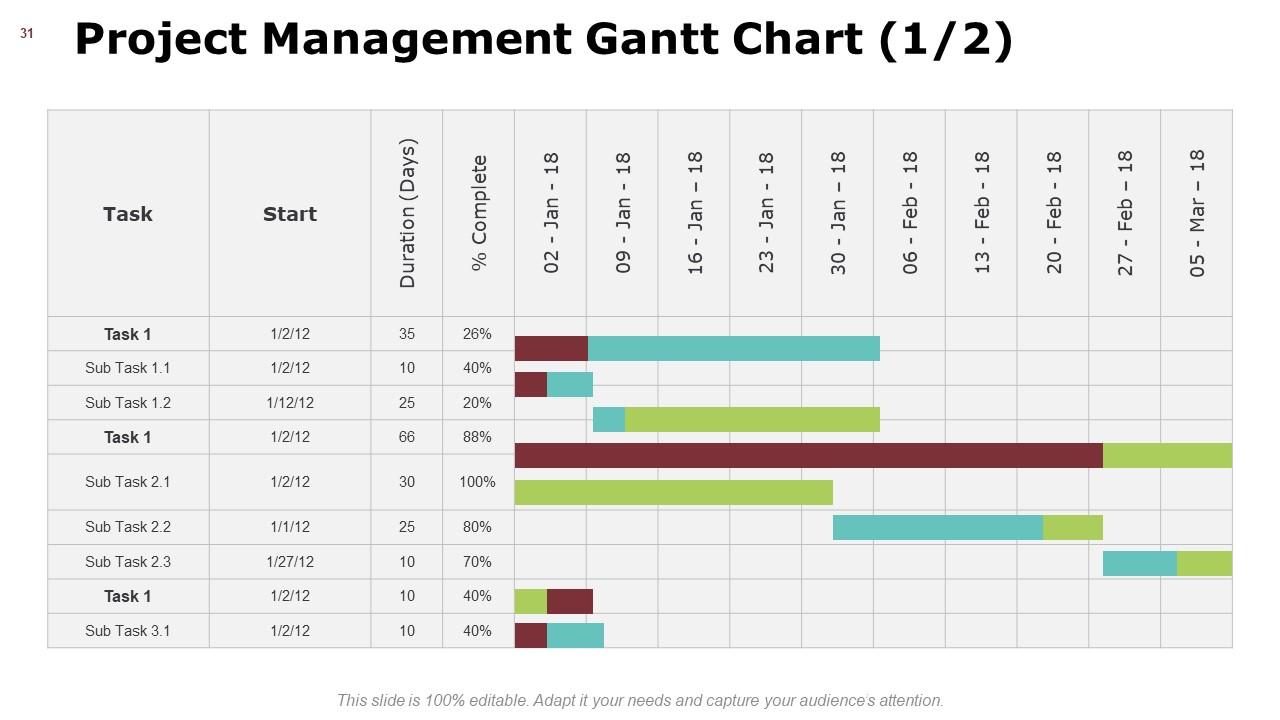
Slide 31: This slide presents Project Management Gantt Chart with additional text boxes to show information.
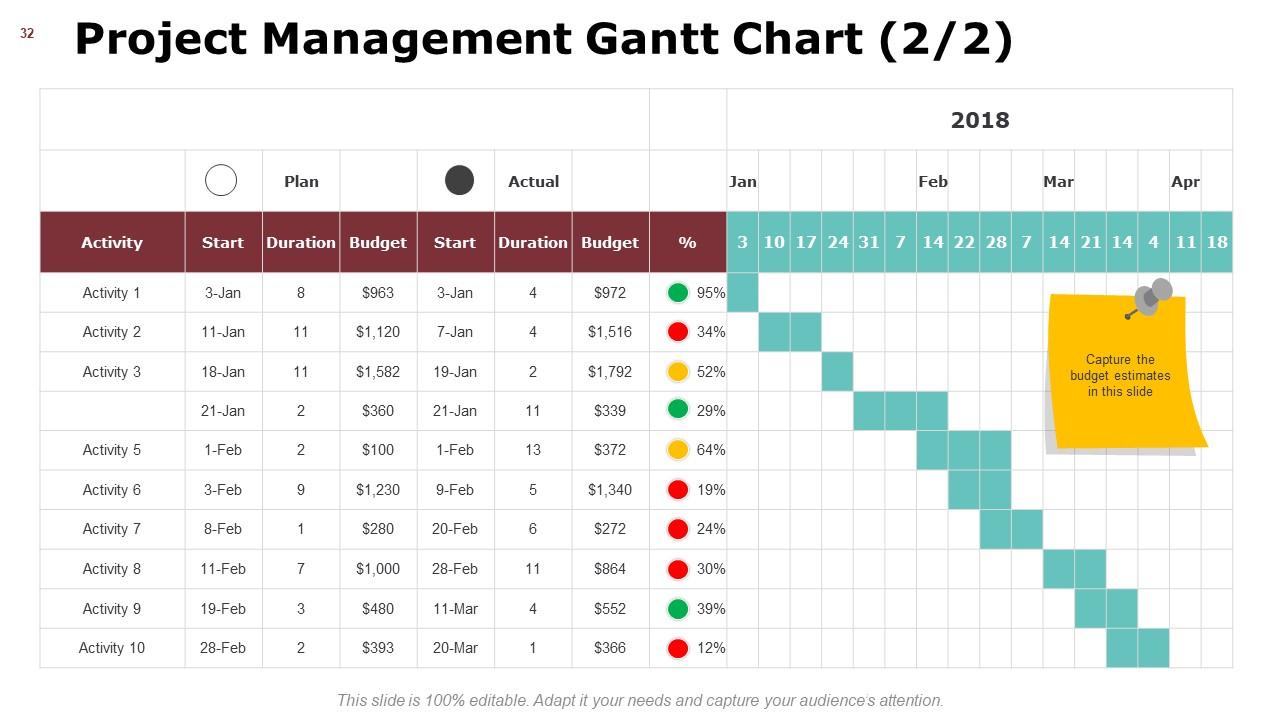
Slide 32: This is another slide presenting Project Management Gantt Chart with related information and text.
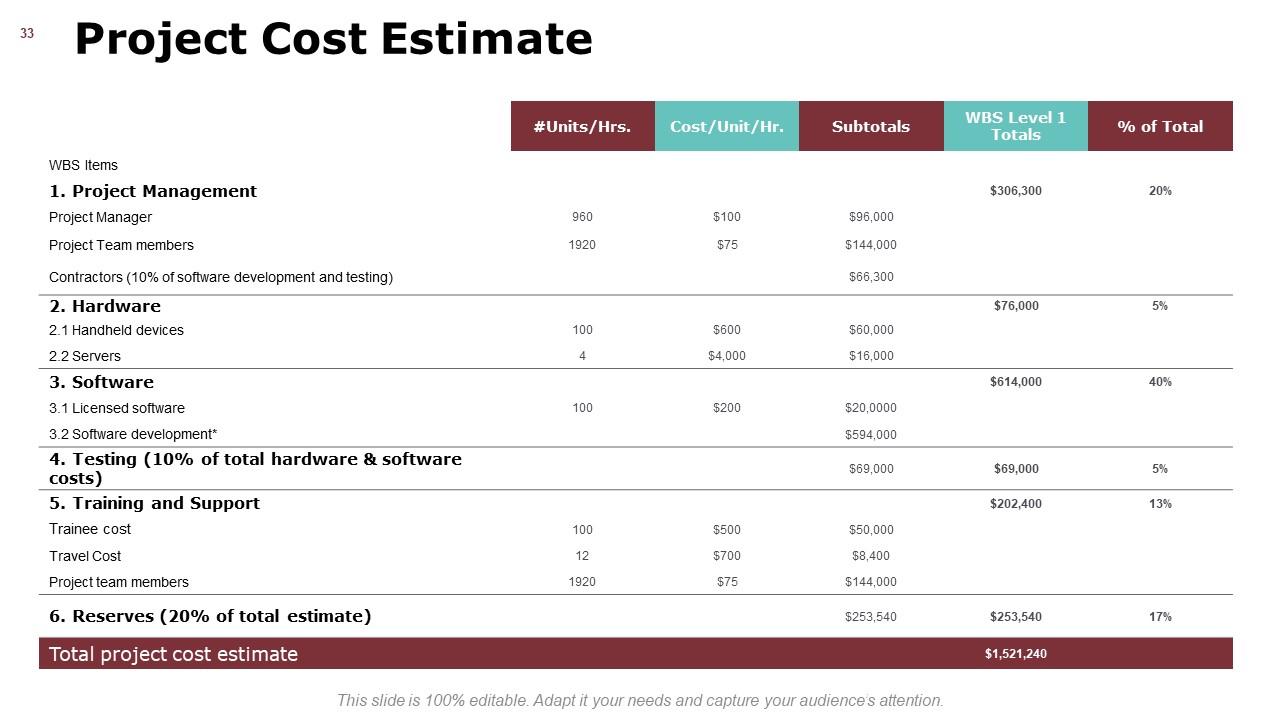
Slide 33: This slide displays Project Cost Estimate in a table form with related text to show information.
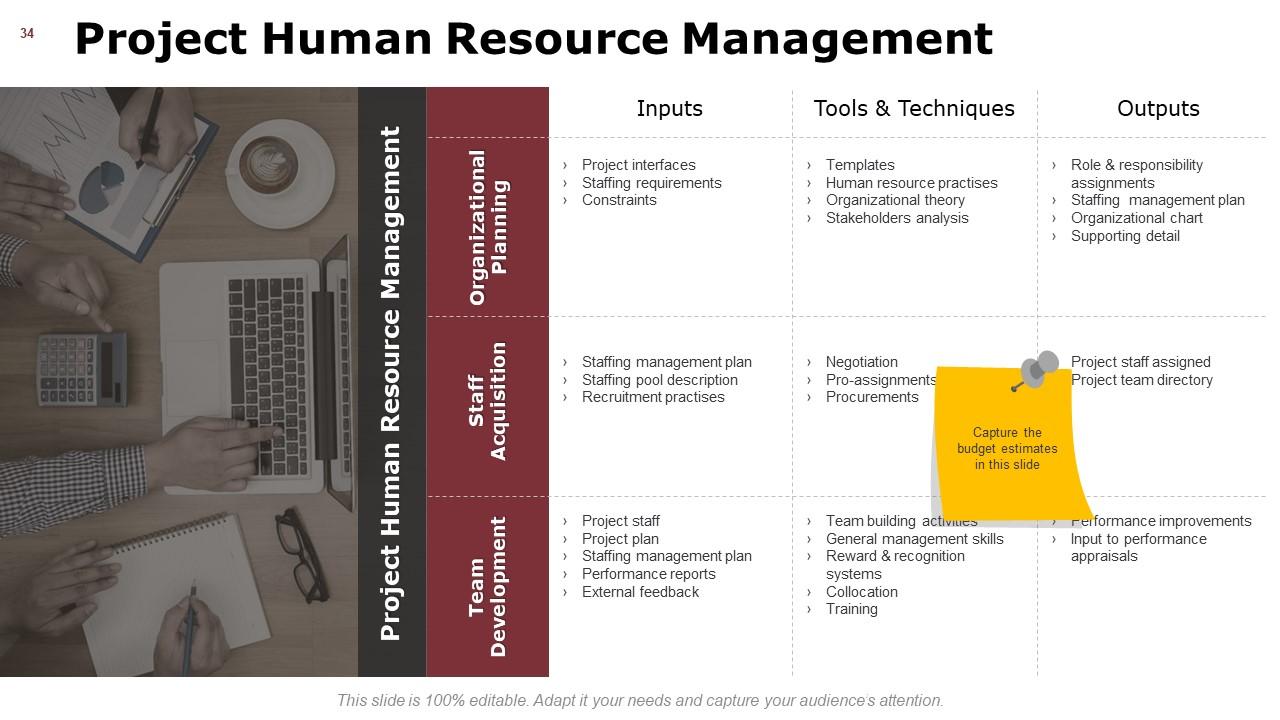
Slide 34: This slide represents Project Human Resource Management describing- Team development, Staff acquisition, organisational planning, Inputs, Tools and techniques, outputs.
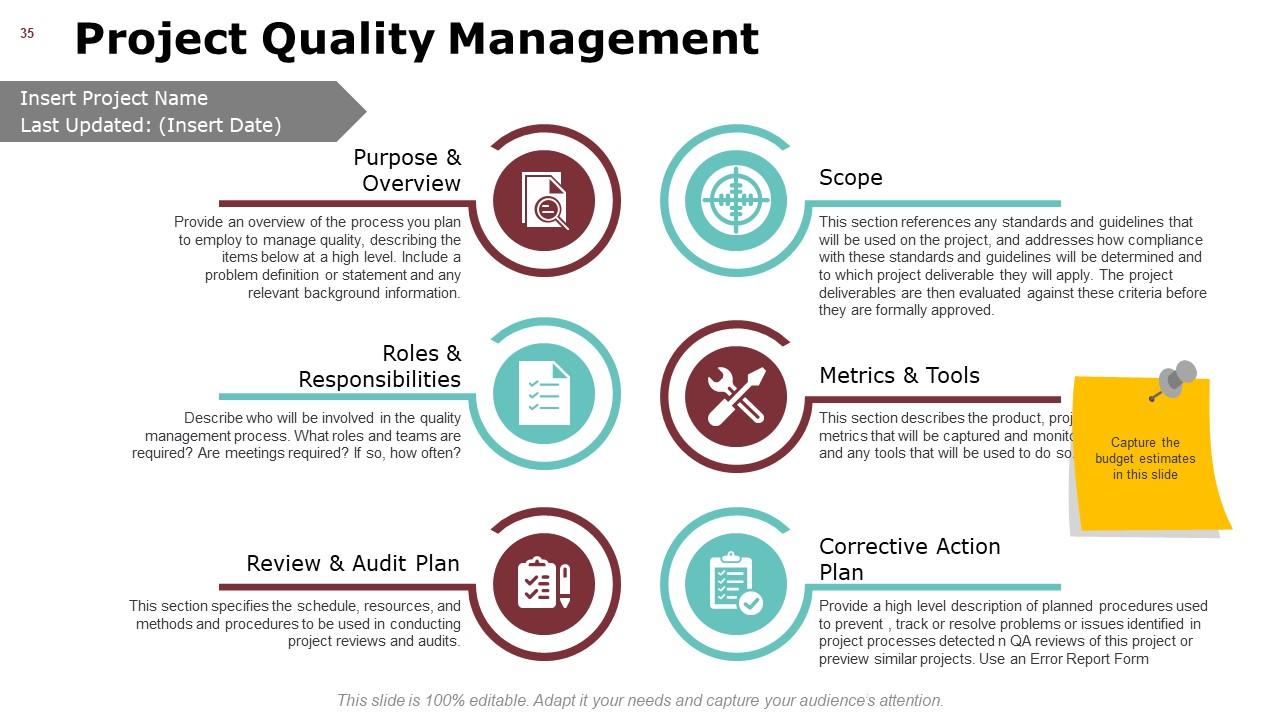
Slide 35: This slide showcases Project Quality Management describing- Purpose & Overview, Corrective Action Plan, Metrics & Tools, Review & Audit Plan, Scope, Roles & Responsibilities.
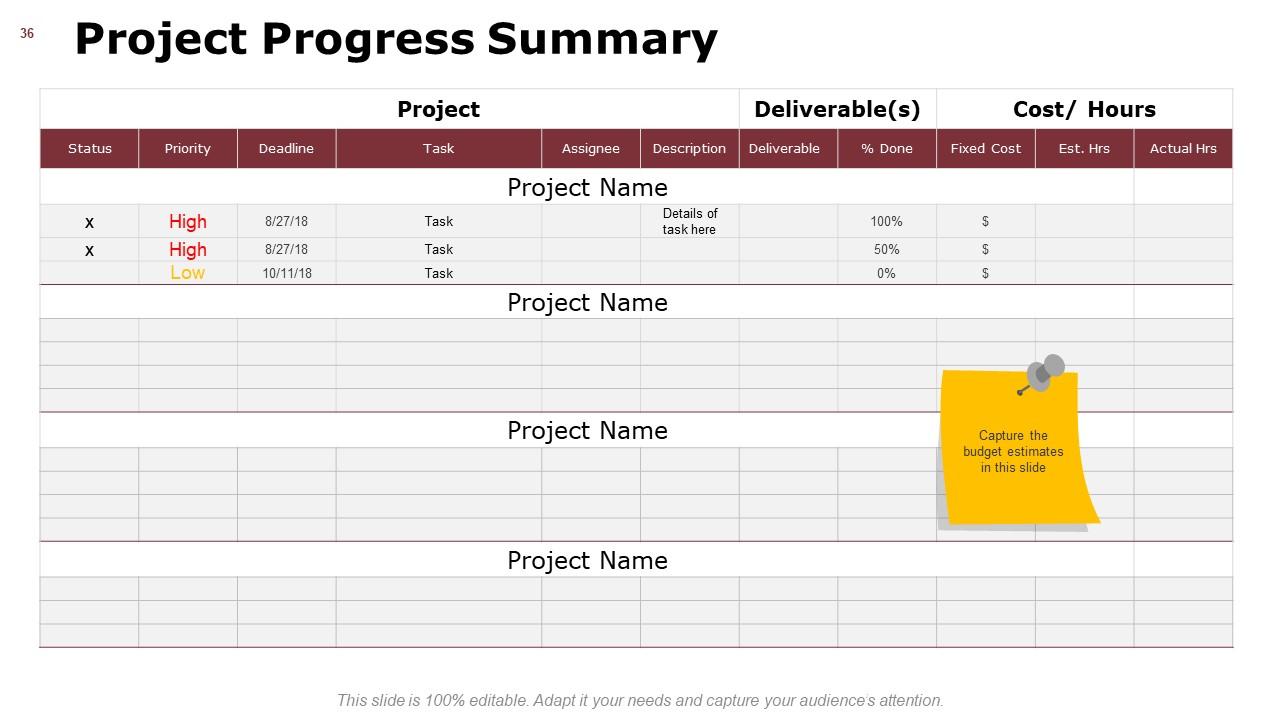
Slide 36: This slide shows Project Progress Summary with related table and text boxes.
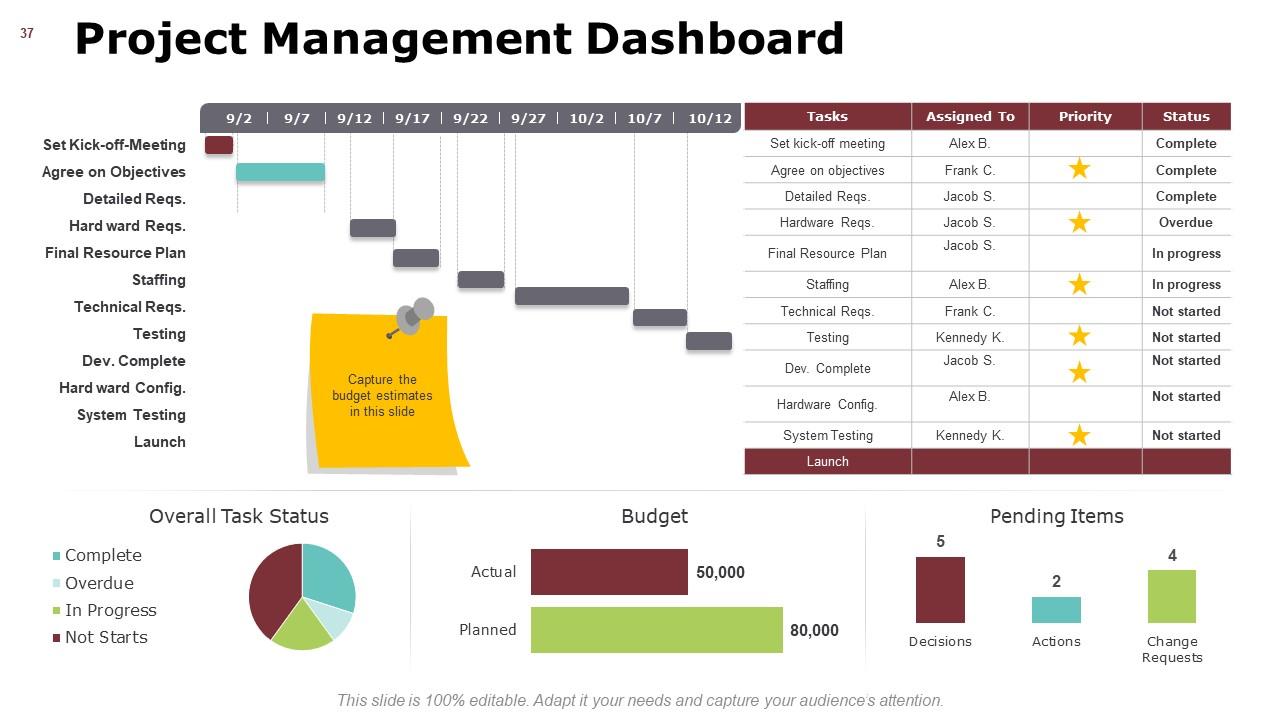
Slide 37: This slide presents Project Management Dashboard with graphs, pie chart etc. to show information.
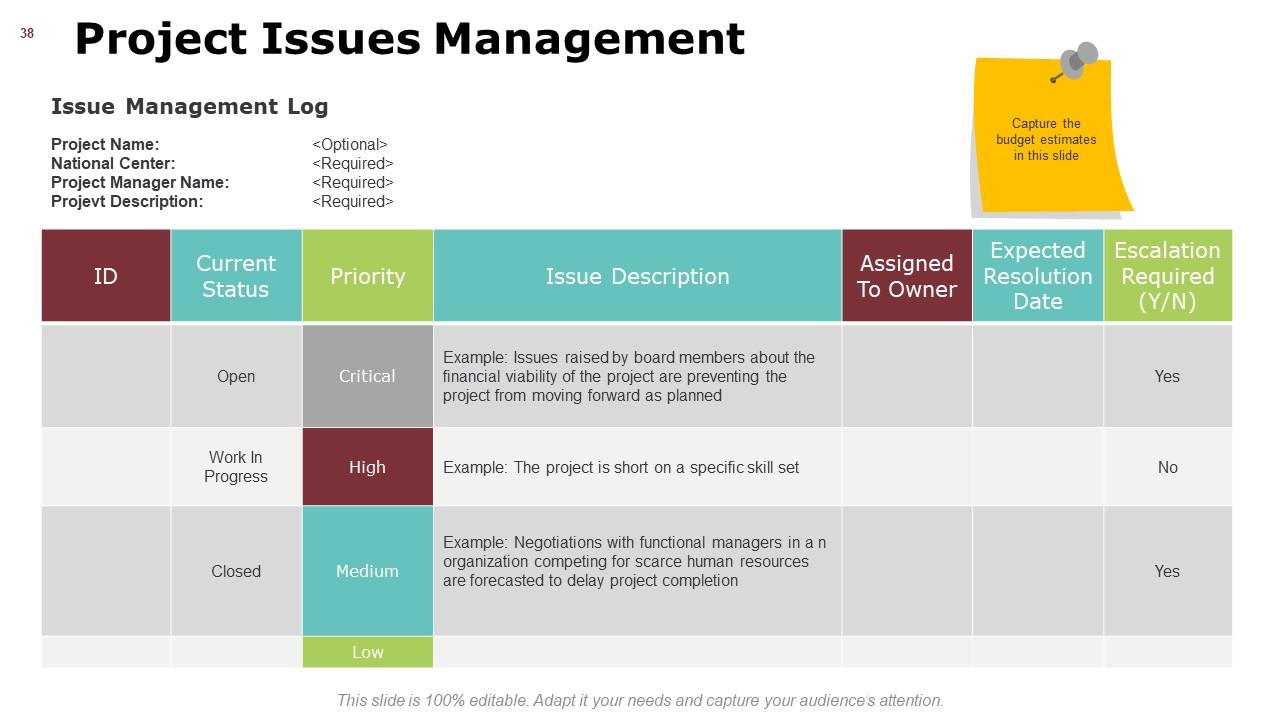
Slide 38: This slide represents Project Issues Management with- ID, current status, priority, issue description etc.
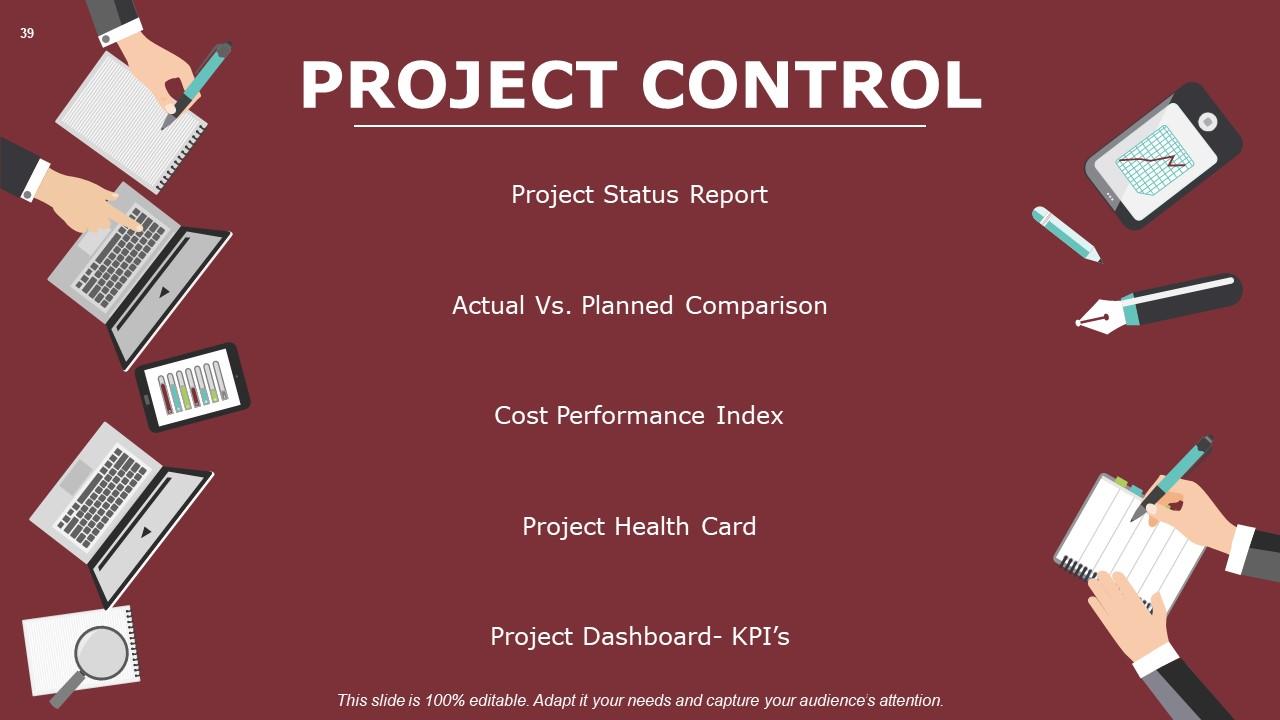
Slide 39: This slide showcases PROJECT CONTROL describing- Project Status Report, Actual Vs. Planned Comparison, Cost Performance Index, Project Health Card, Project Dashboard- KPI’s.
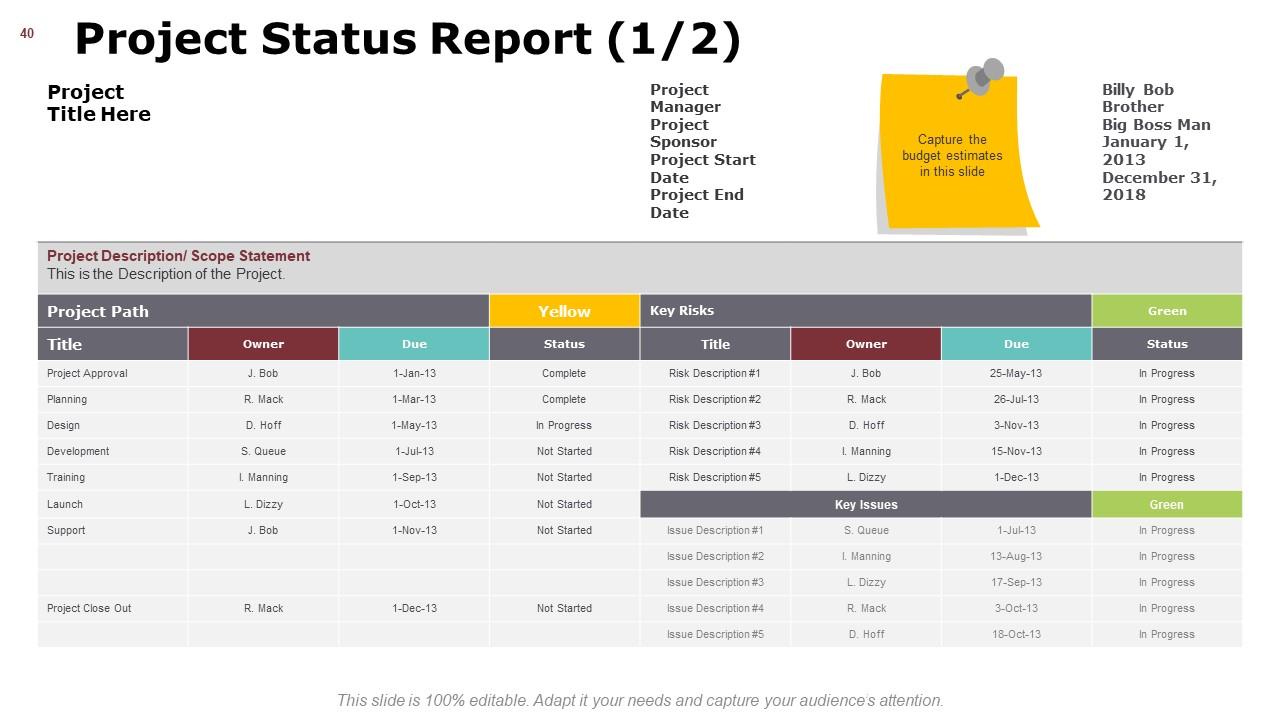
Slide 40: This slide shows Project Status Report in a table form with related text to show information.
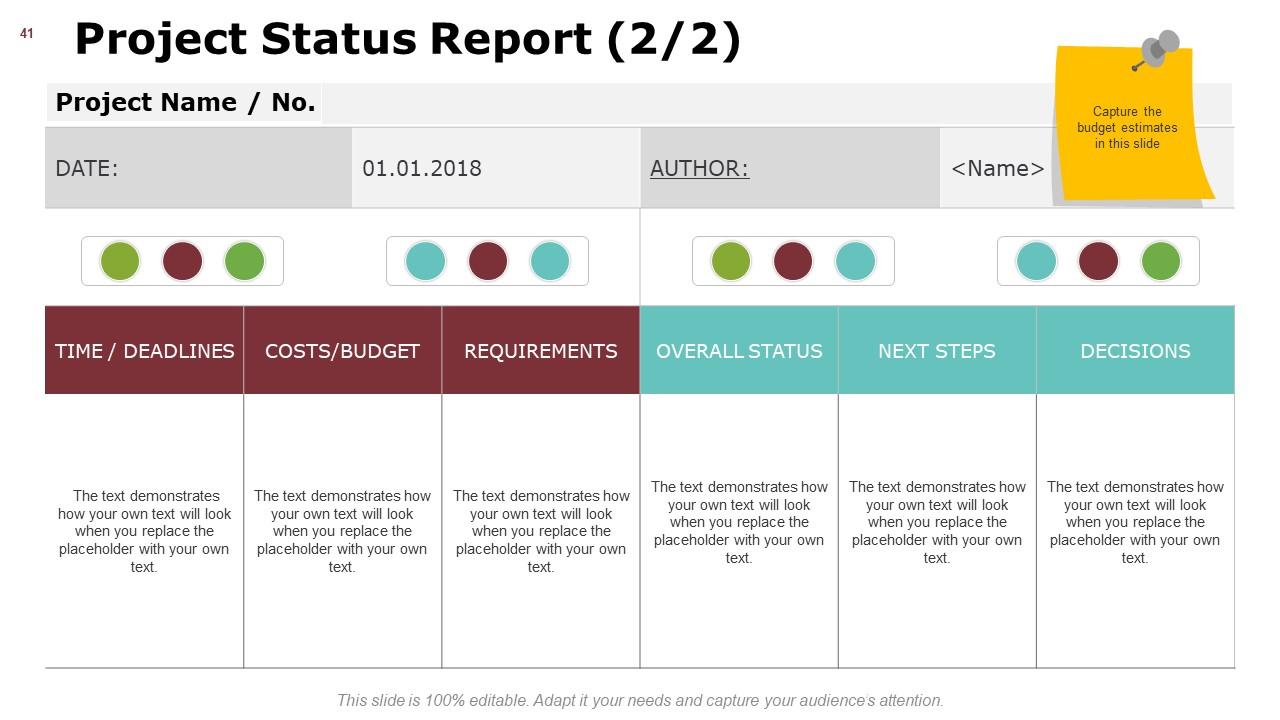
Slide 41: This is another slide presenting Project Status Report with Deadlines, costs/budget, requirements, overall status etc.
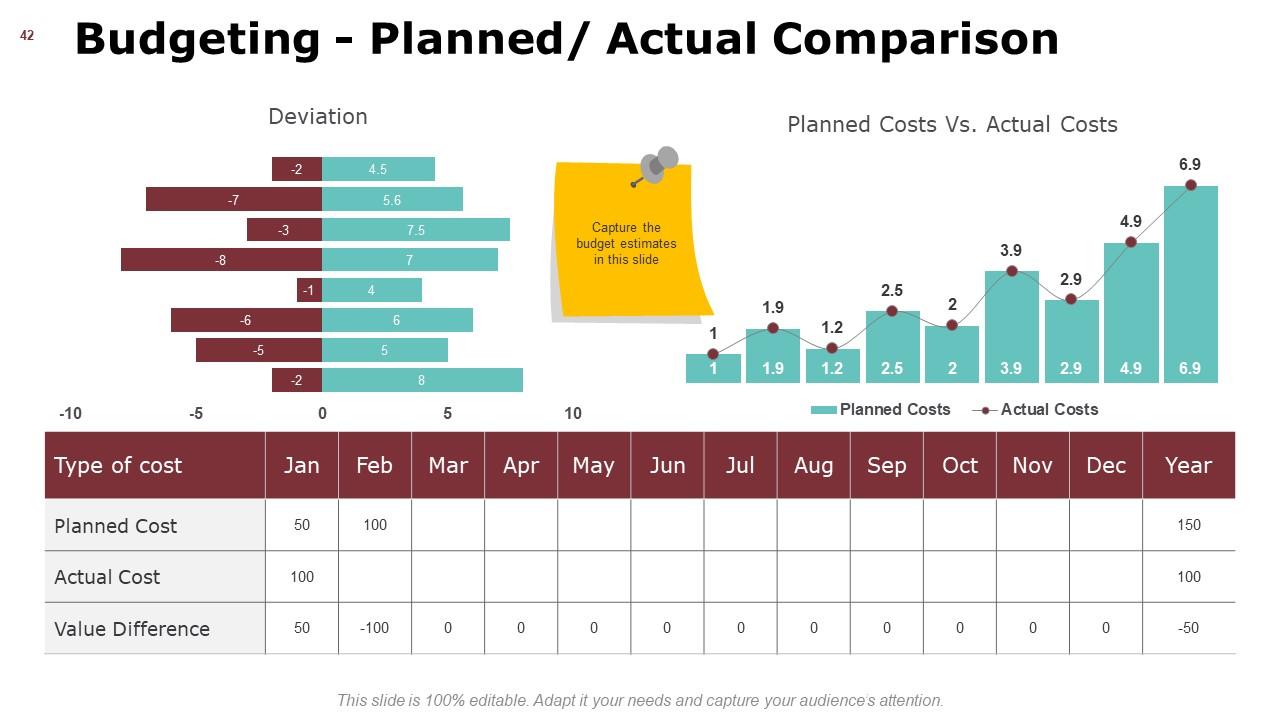
Slide 42: This slide displays Budgeting - Planned/ Actual Comparison with the help of graphs and table.
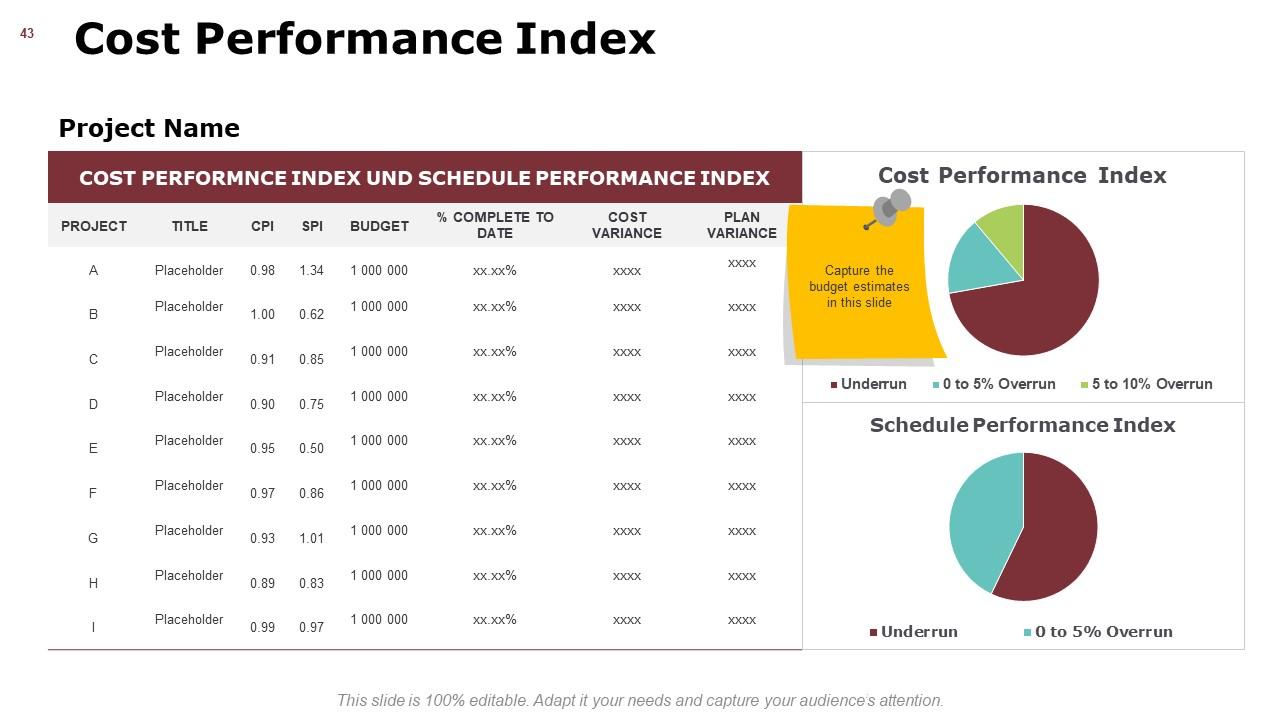
Slide 43: This slide represents Cost Performance Index with pie chart to show information.
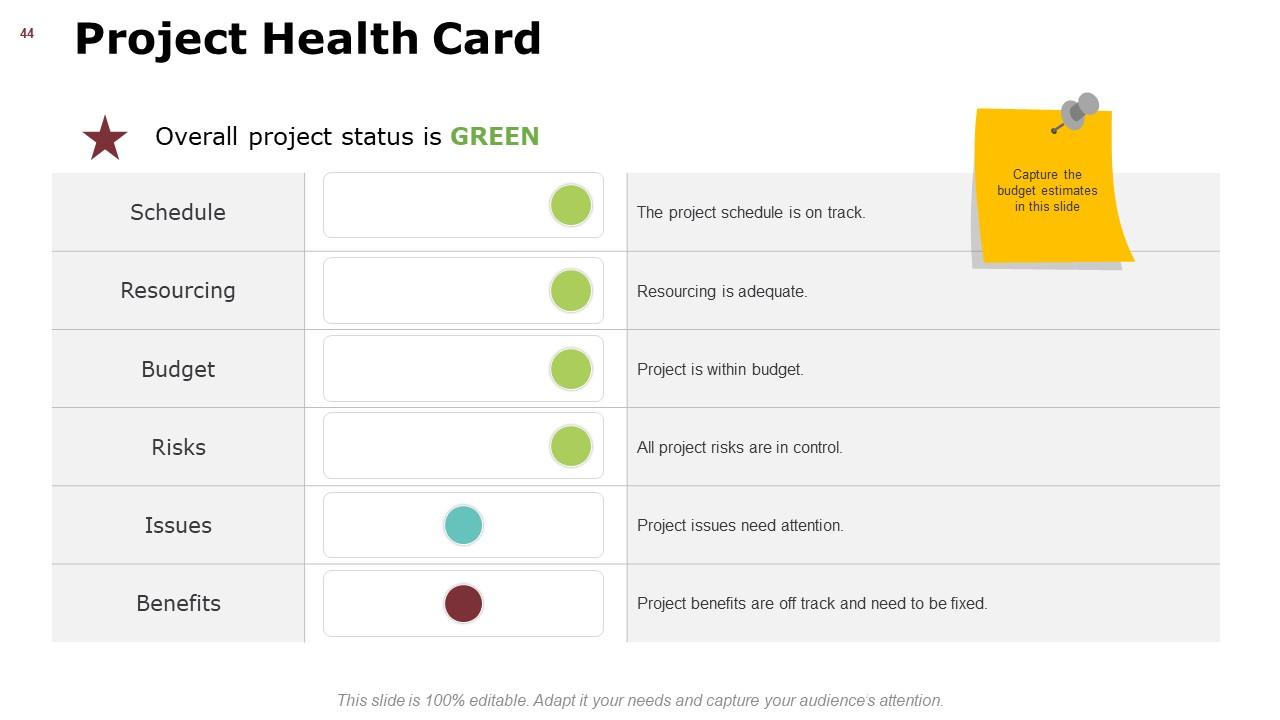
Slide 44: This slide showcases Project Health Card with schedule, resourcing, Budget, risks, issues and benefits.
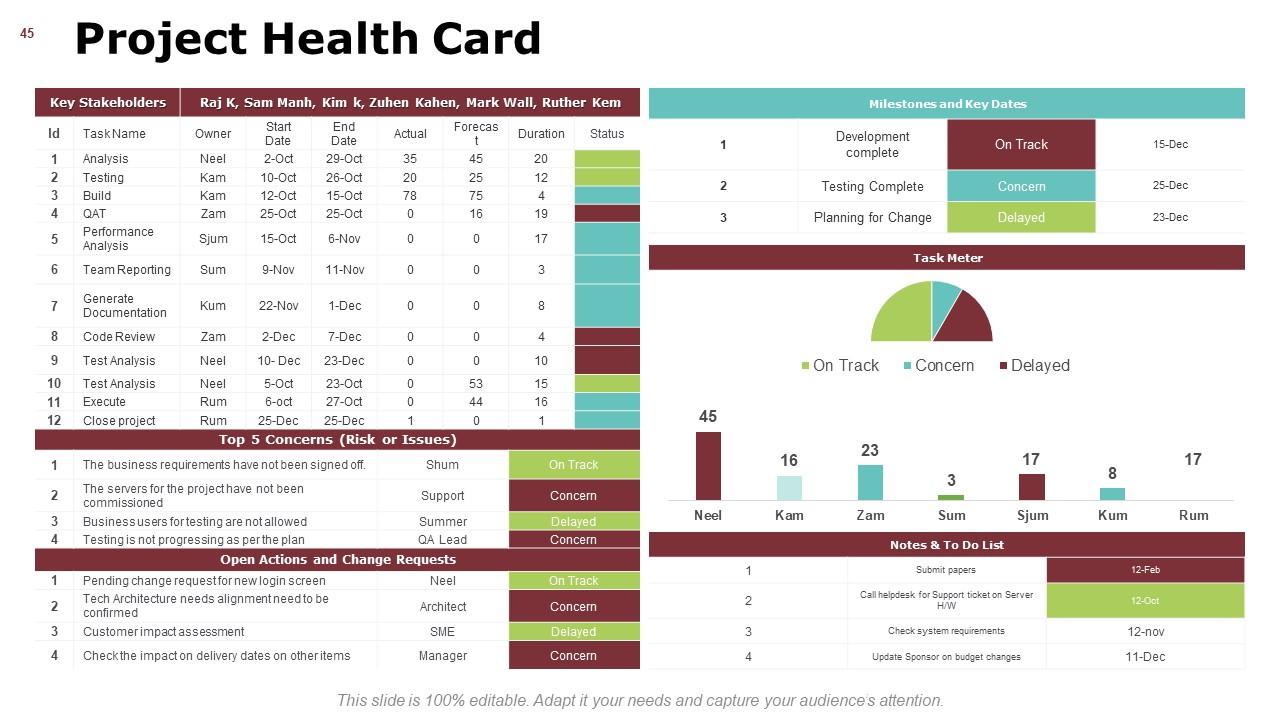
Slide 45: This is another slide on Project Health Card with pie chart, status and other information.
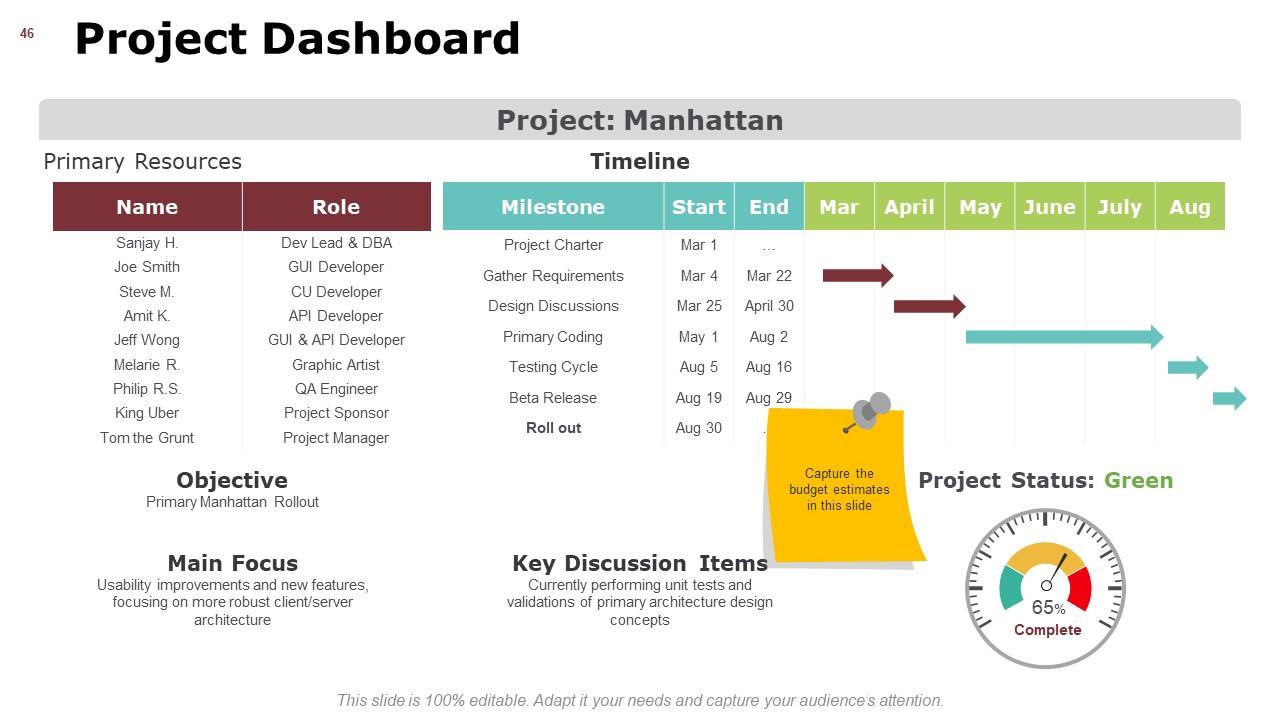
Slide 46: This slide shows Project Dashboard describing- Name, role, milestone etc.
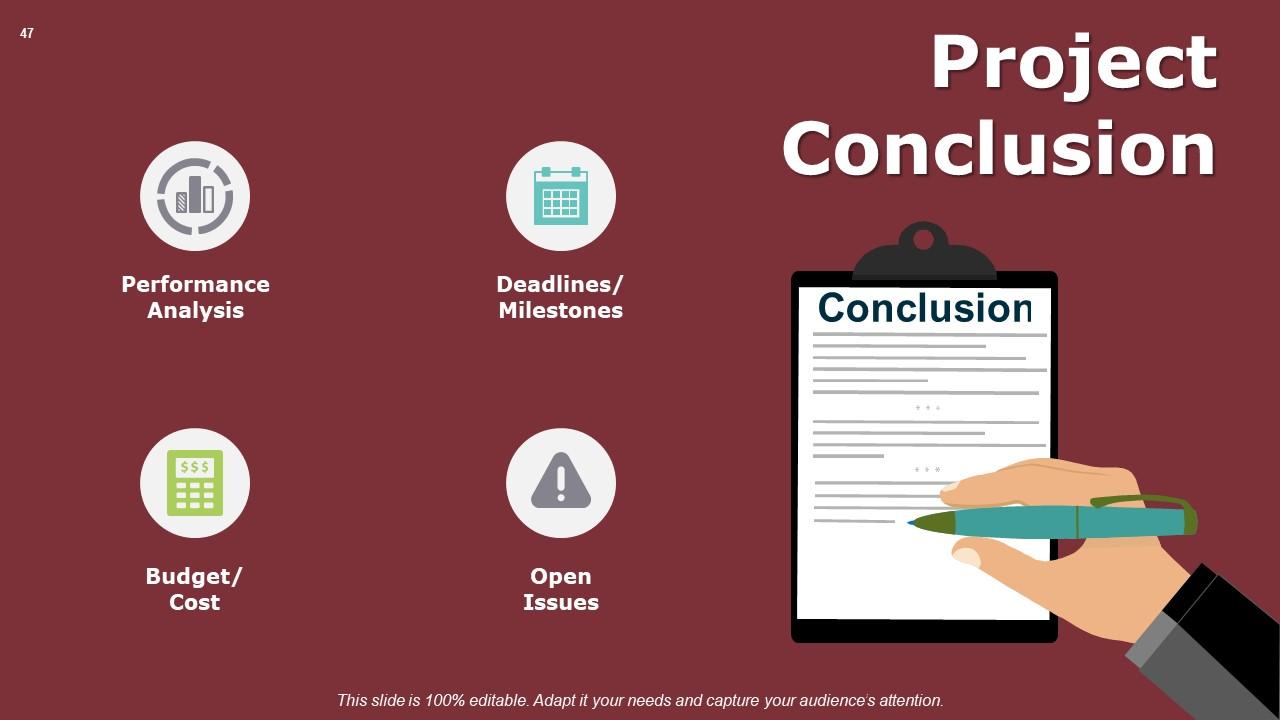
Slide 47: This slide presents Project Conclusion with- Deadlines/ Milestones, Open Issues, Performance Analysis, Budget/ Cost.
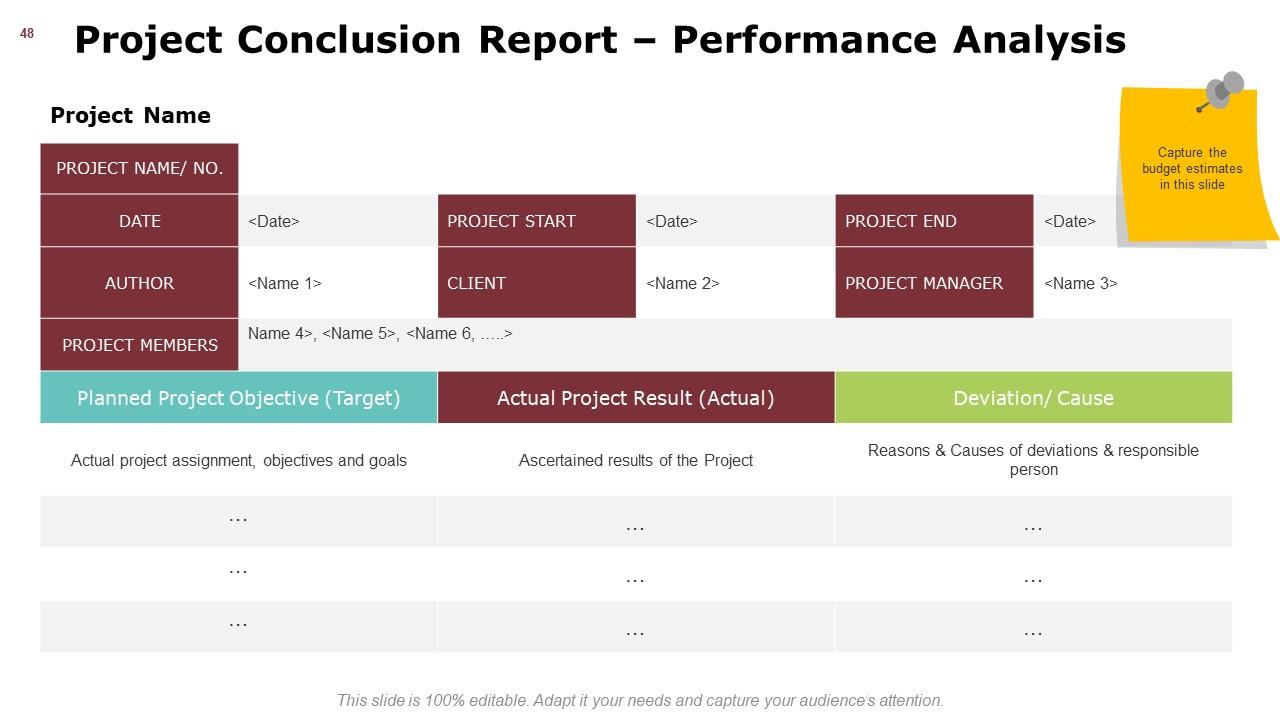
Slide 48: This slide displays Project Conclusion Report – Performance Analysis with project name, members, project manager, start and end date etc.
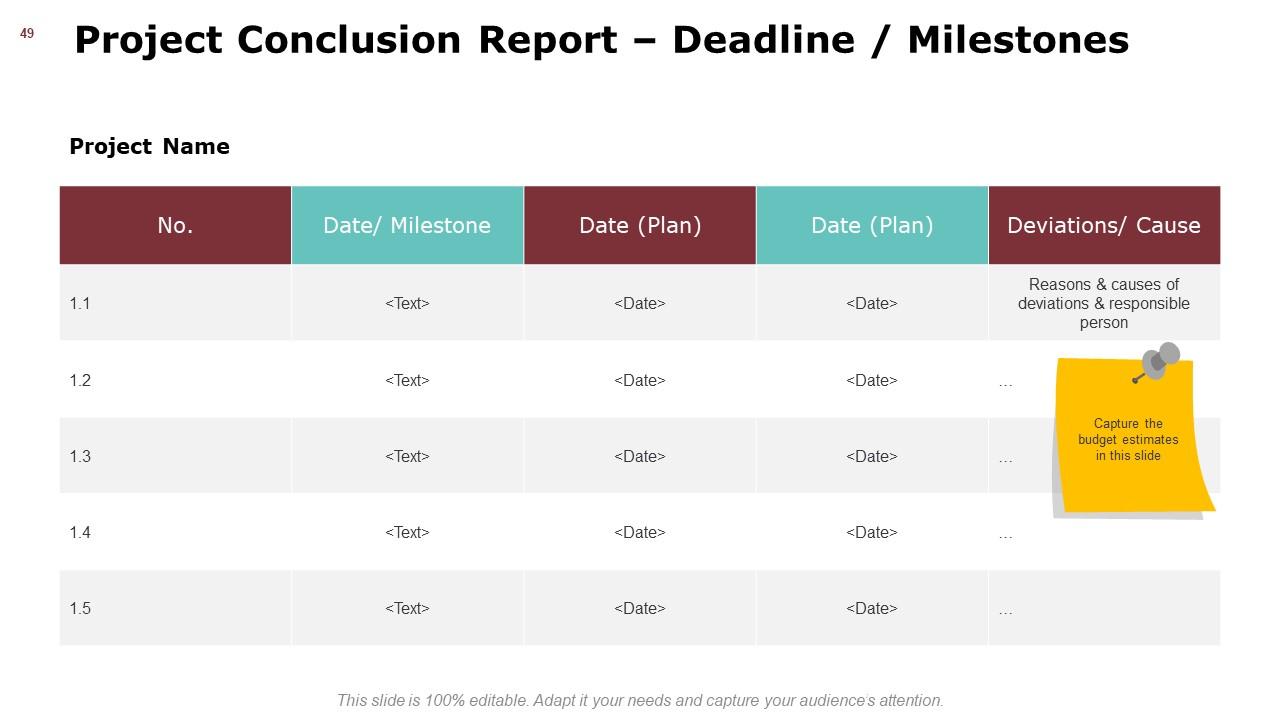
Slide 49: This slide represents Project Conclusion Report – Deadline / Milestones with milestone, date, deviation, causes etc.
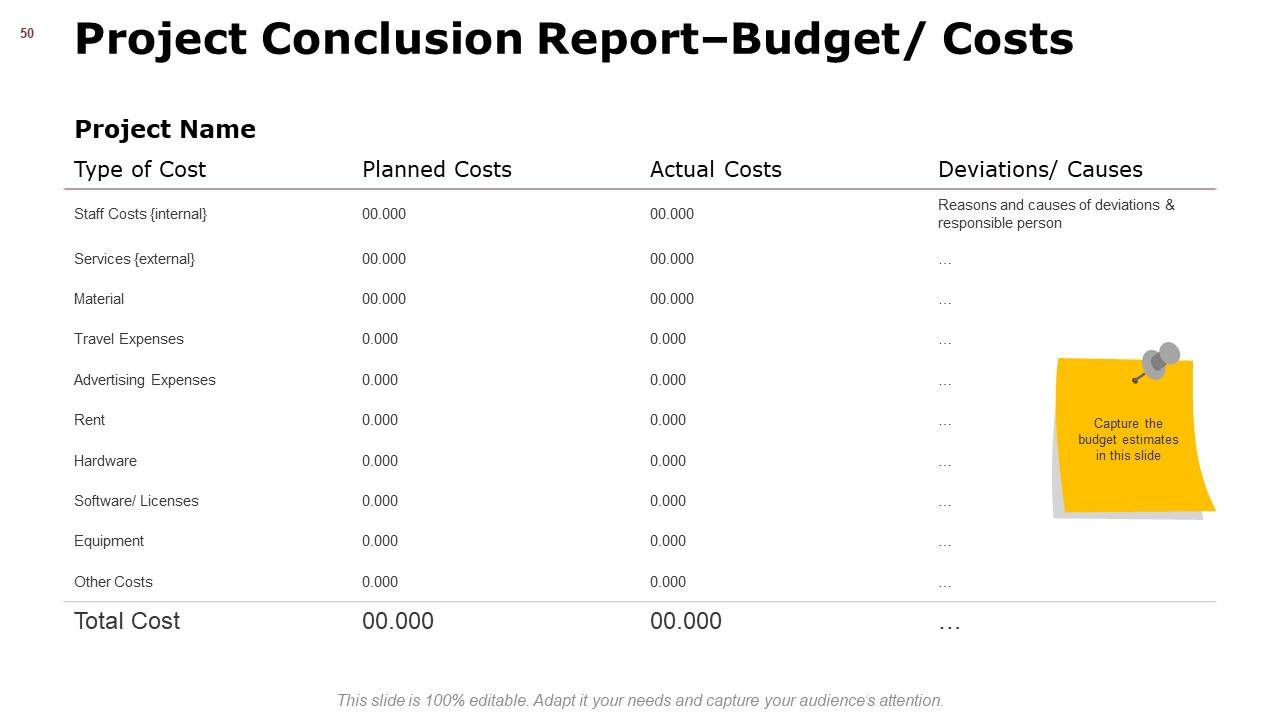
Slide 50: This slide showcases Project Conclusion Report–Budget/ Costs describing- Type of cost, planned costs, actual costs, deviations/causes.
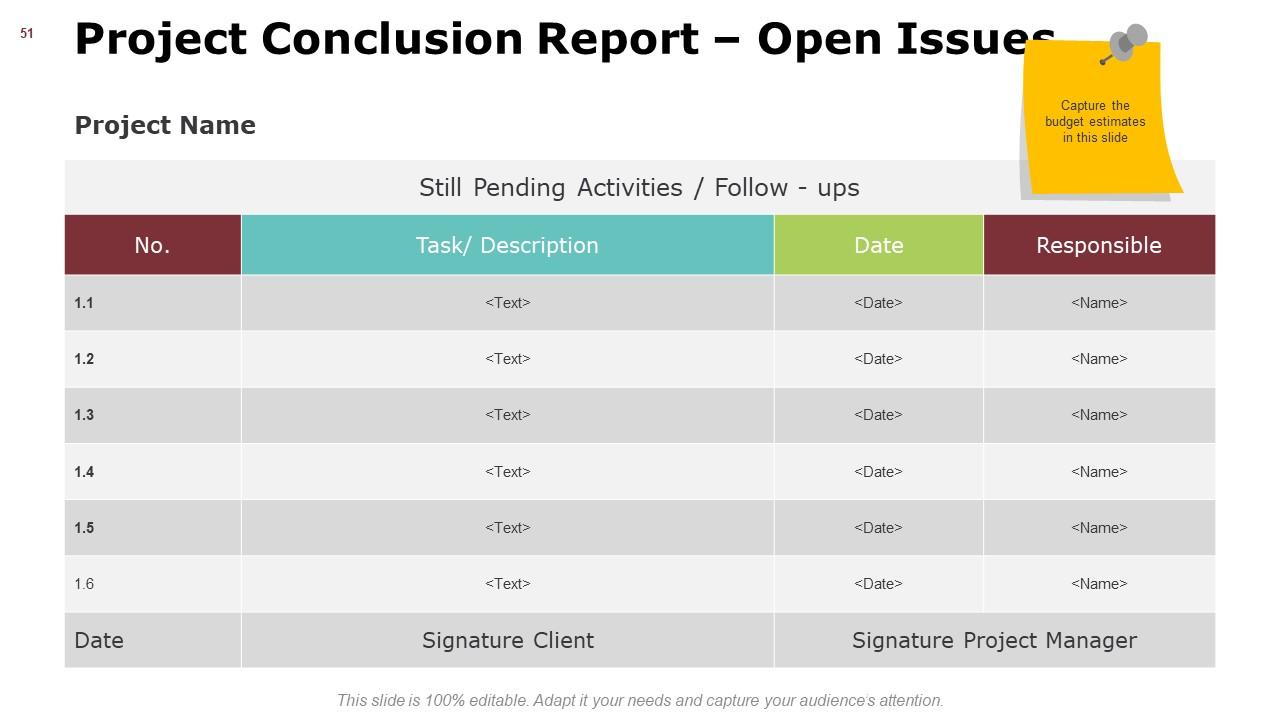
Slide 51: This slide shows Project Conclusion Report – Open Issues with task/description, date and responsible.
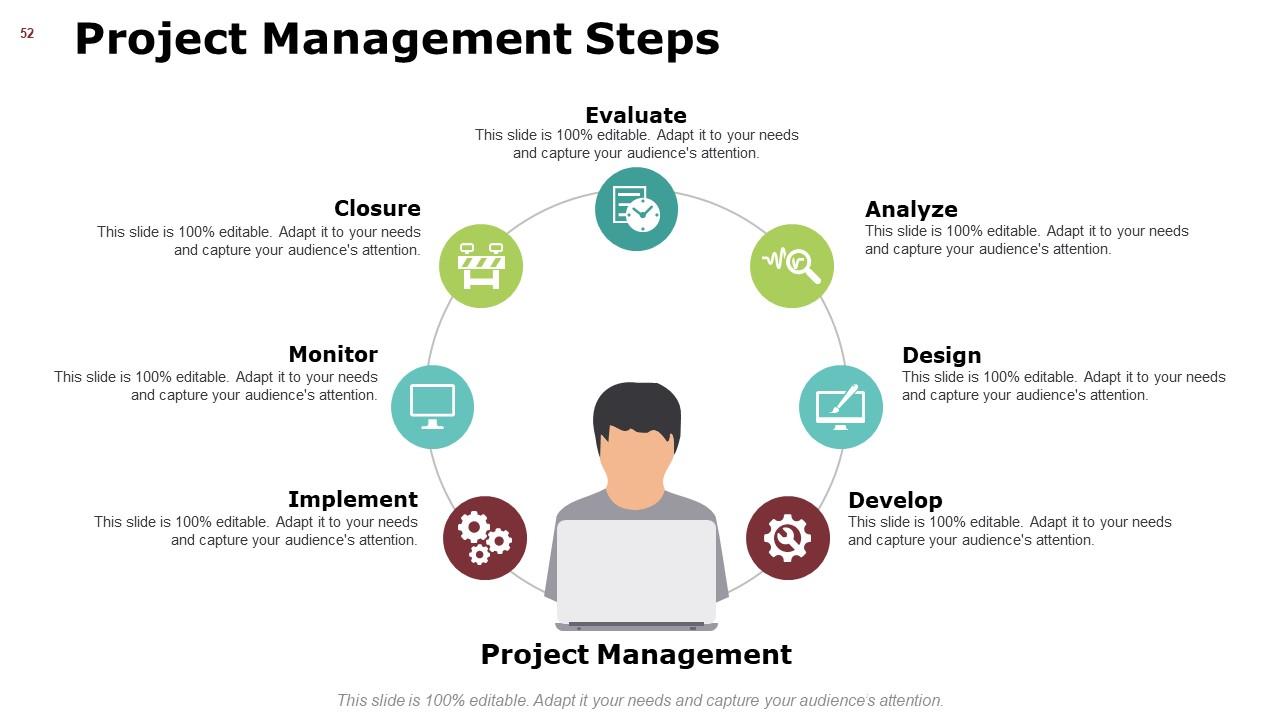
Slide 52: This slide presents Project Management Steps describing- Evaluate, Closure, Monitor, Implement, Develop, Design, Analyze.
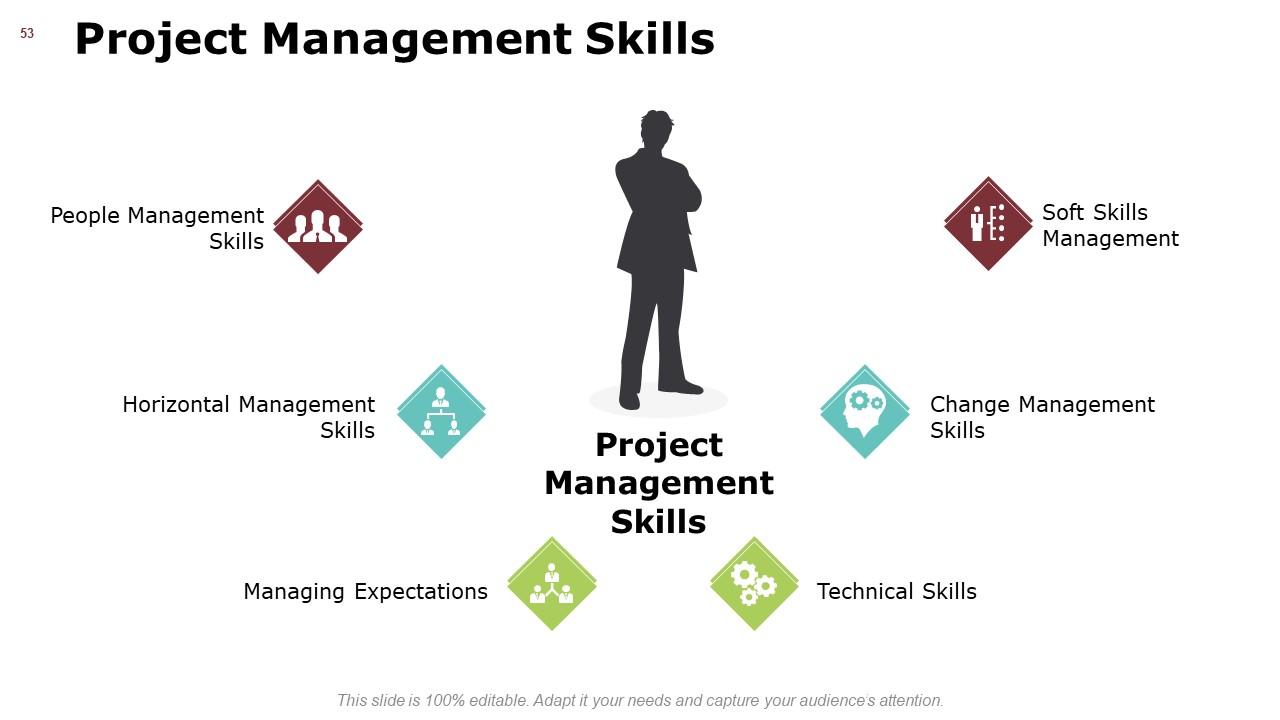
Slide 53: This slide displays Project Management Skills including- People Management Skills, Technical Skills, Horizontal Management Skills, Soft Skills Management, Managing Expectations, Change Management Skills.
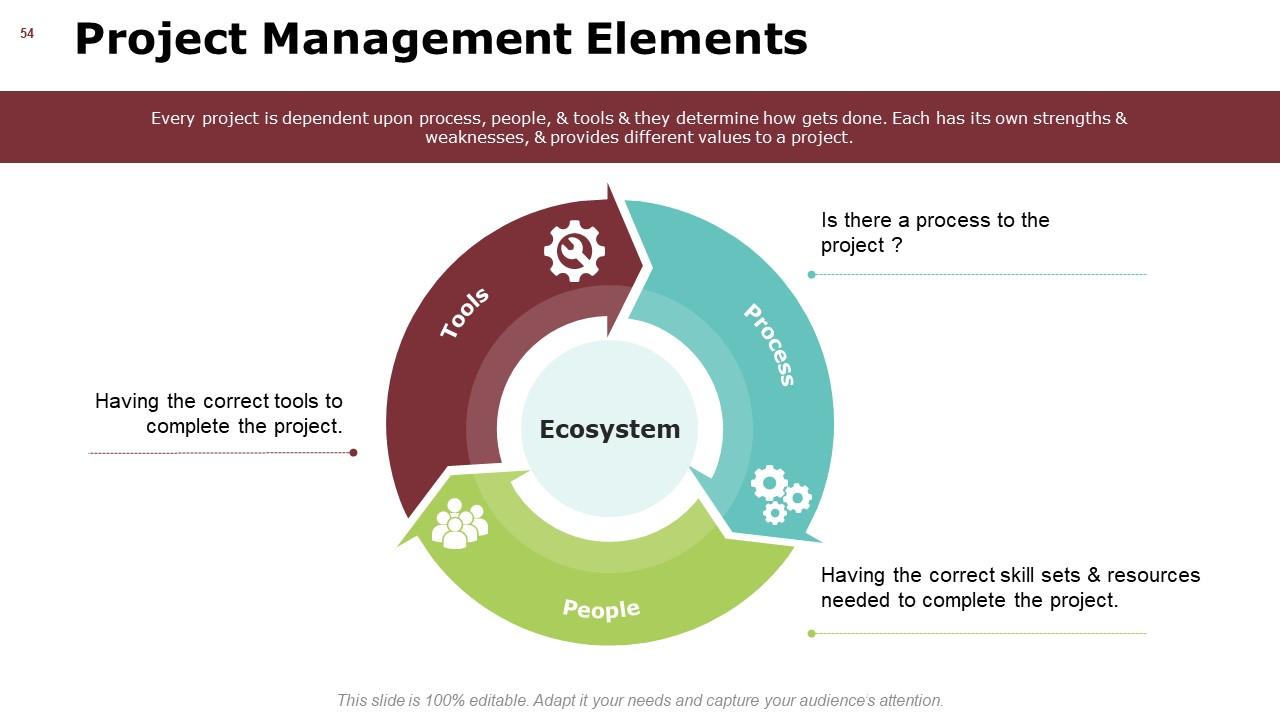
Slide 54: This slide represents Project Management Elements including- Tools, process, people.
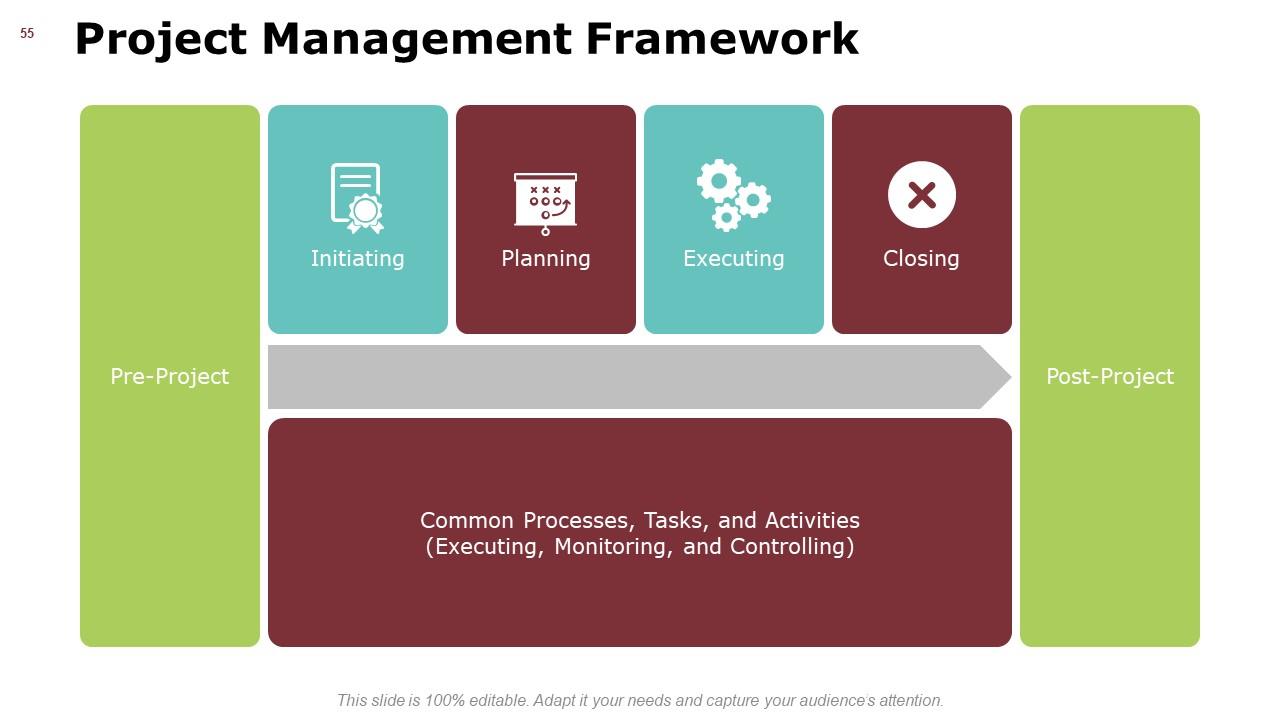
Slide 55: This slide displays Project Management Framework including- Initiating, Planning, Executing, Closing.
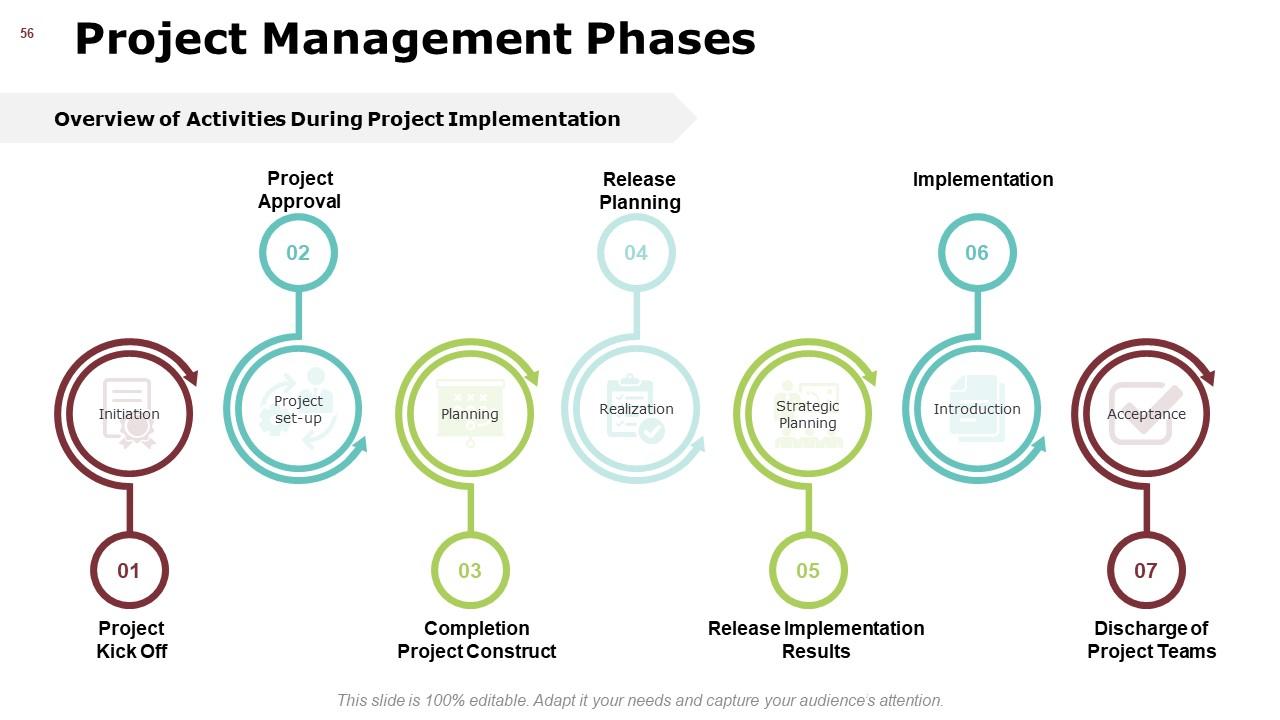
Slide 56: This slide showcases Project Management Phases which includes- Project Kick Off, Project Approval, Completion Project Construct, Release Planning, Release Implementation Results, Implementation, Discharge of Project Teams.
Slide 57: This slide shows Project Governance Framework Icons.
Slide 58: This slide is titled as Additional Slides for moving forward.
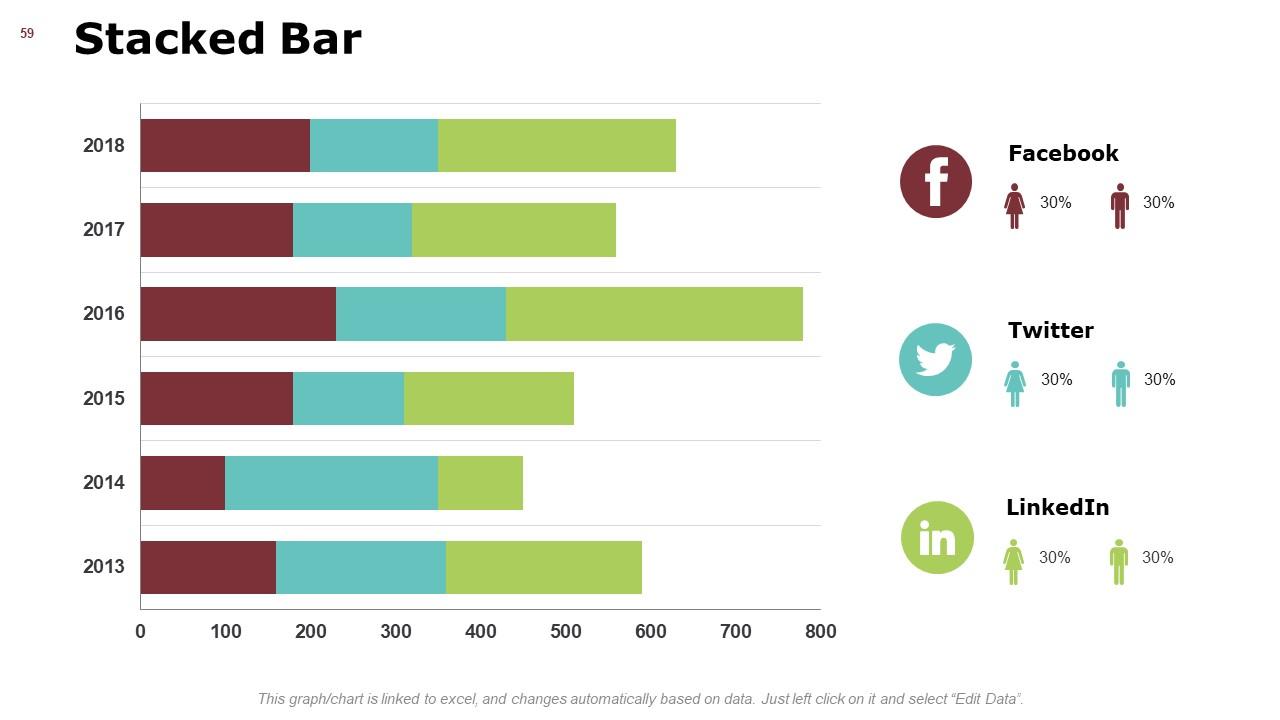
Slide 59: This slide shows Stacked Bar graph chart with three products comparison.
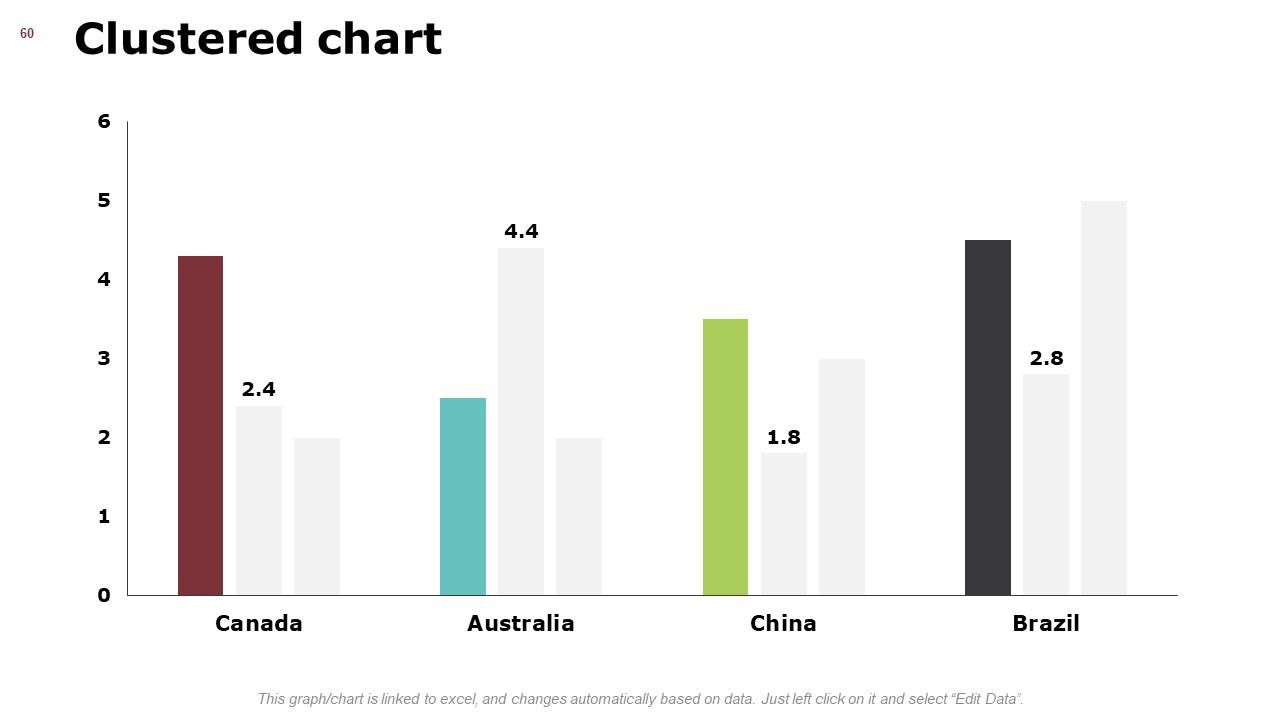
Slide 60: This slide presents Clustered chart to show information.
Slide 61: This is Our Team slide with names and designation.
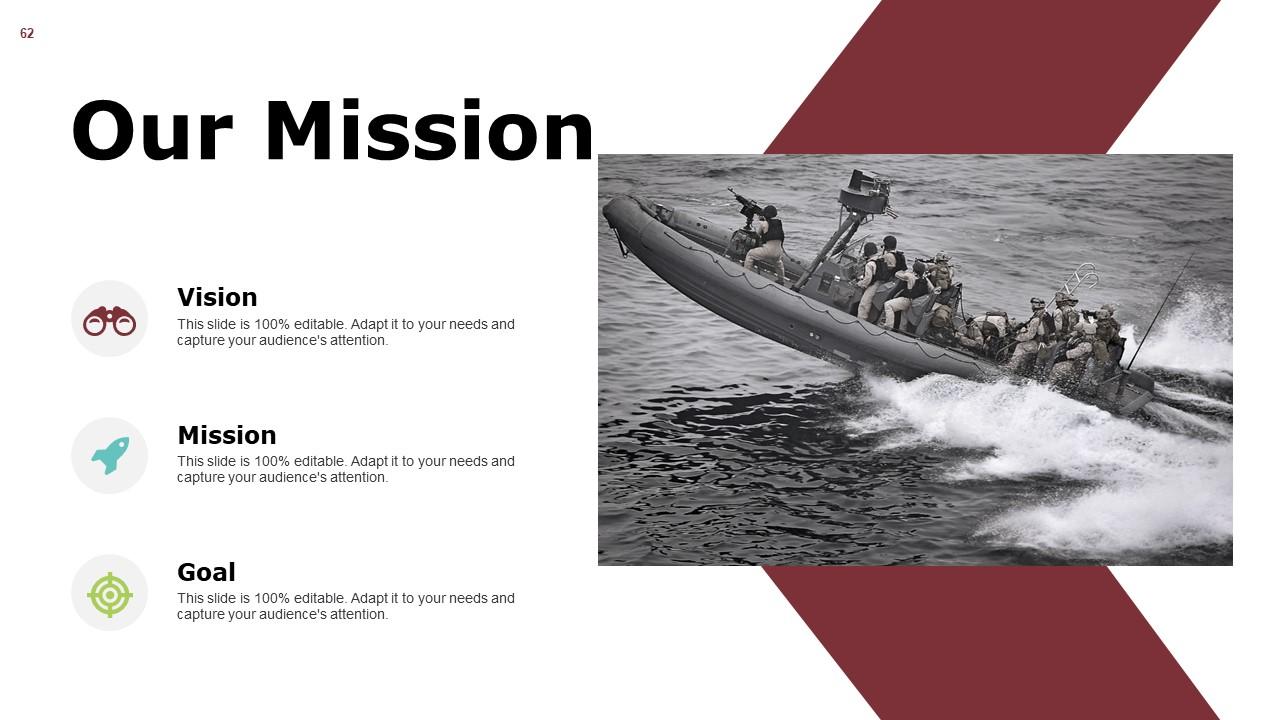
Slide 62: This slide shows Our Mission with imagery and text.
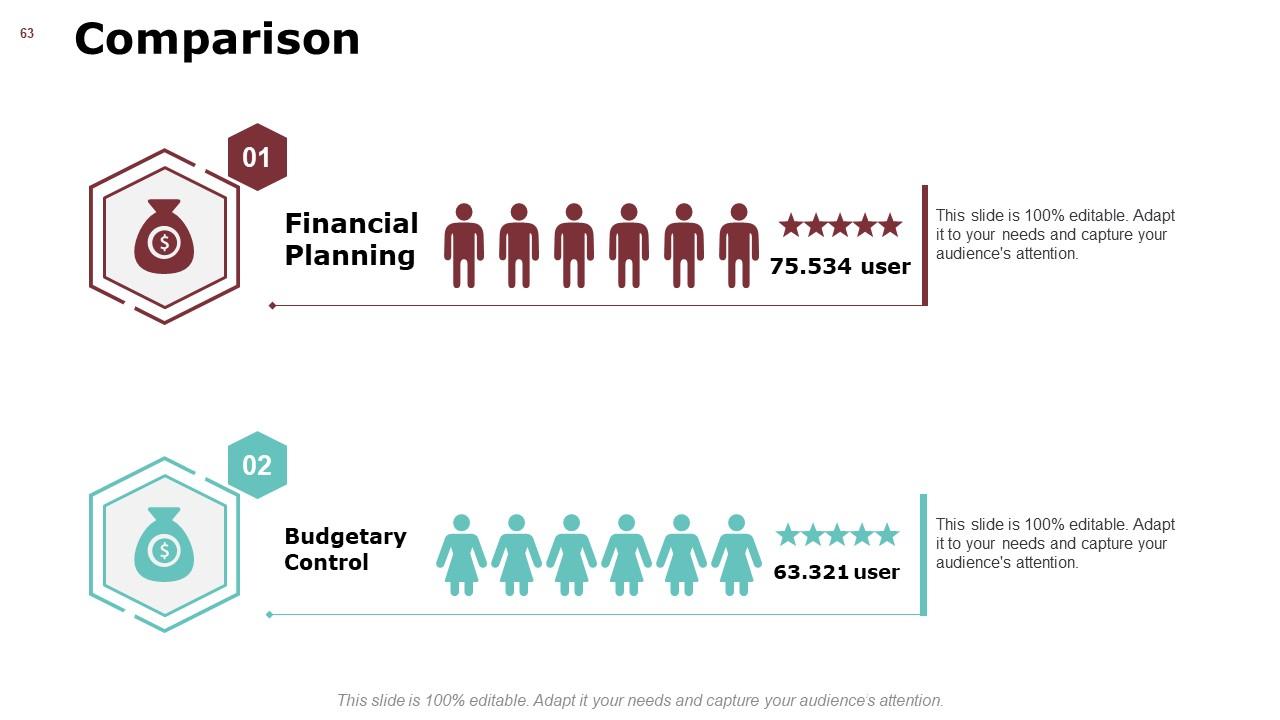
Slide 63: This is a Comparison slide to state comparison between commodities, entities etc.
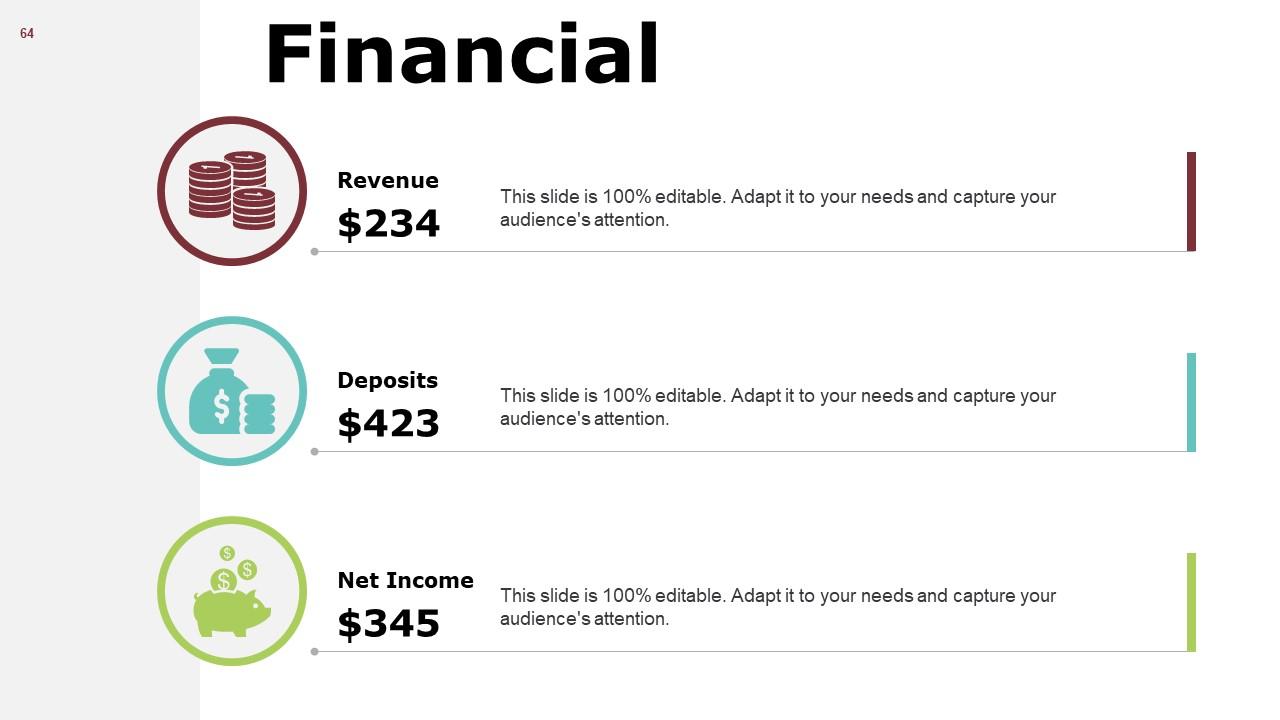
Slide 64: This is a Financial slide. Show finance related stuff here.
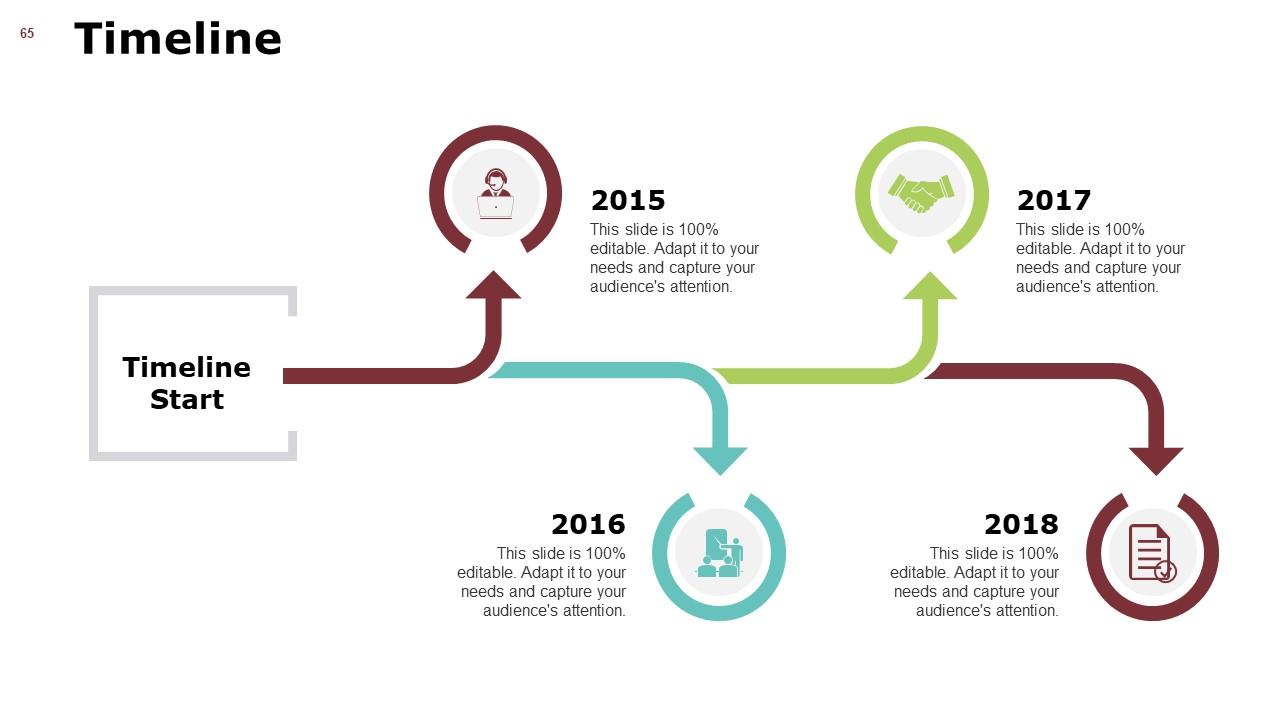
Slide 65: This is a Timeline slide. Show information related with time period here.
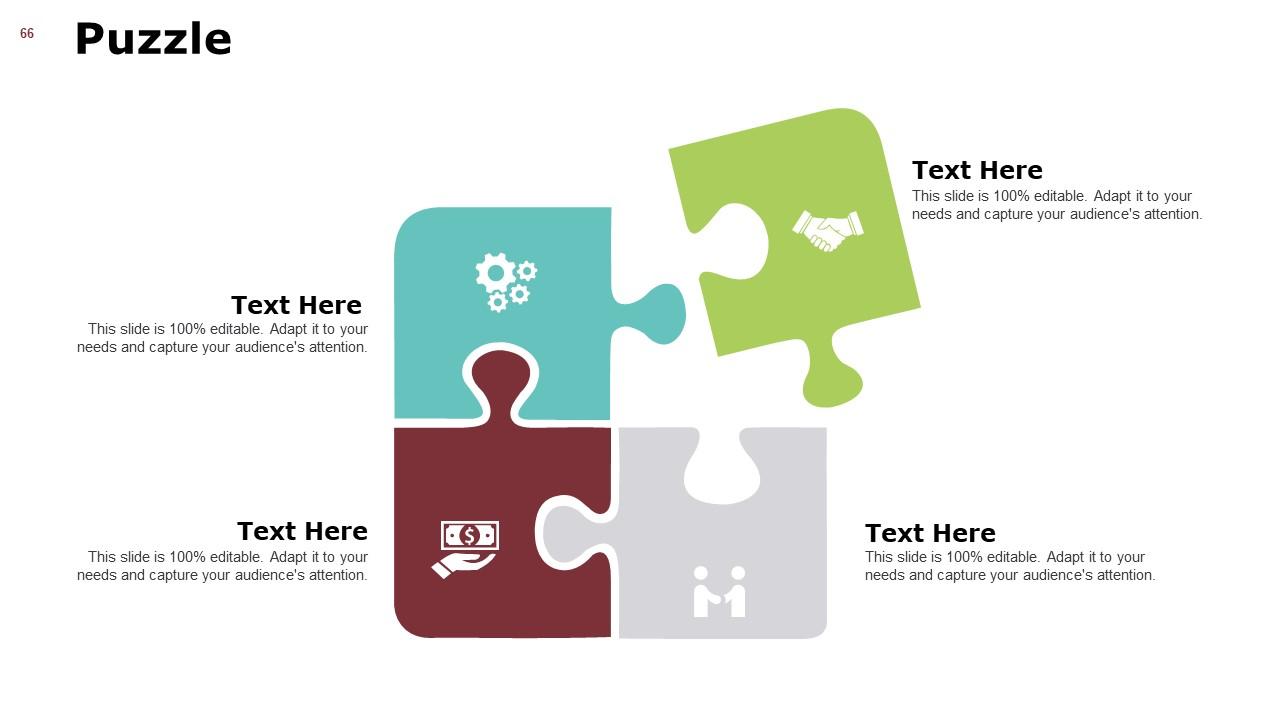
Slide 66: This is a Puzzle slide with text boxes to show information.
Slide 67: This is a Thank You slide with address, contact number, email address.
Project Governance Framework PowerPoint Presentation Slides with all 67 slides:
Use our Project Governance Framework PowerPoint Presentation Slides to effectively help you save your valuable time. They are readymade to fit into any presentation structure.
-
Visually stunning presentation, love the content.
-
The Designed Graphic are very professional and classic.


