


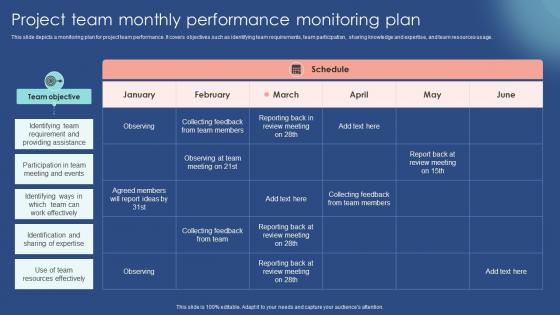
Project Team Monthly Performance Monitoring Plan




Try Before you Buy Download Free Sample Product
 Impress Your
 Audience
 100%
100% Editable
 Save Hours
 of Time


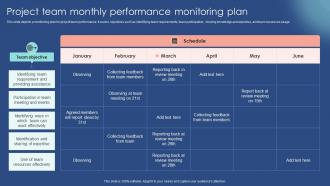
This slide depicts a monitoring plan for project team performance. It covers objectives such as identifying team requirements, team participation, sharing knowledge and expertise, and team resources usage.
People who downloaded this PowerPoint presentation also viewed the following :
Project Team Monthly Performance Monitoring Plan with all 6 slides:
Use our Project Team Monthly Performance Monitoring Plan to effectively help you save your valuable time. They are readymade to fit into any presentation structure.





FAQs for Project Team Monthly
So basically you want to track four main things: how fast your system responds, how many requests it can handle per second, error rates (which are kinda obvious but super important), and resource usage like CPU and memory. That last one helps you catch bottlenecks before everything goes to hell. If you've got customers using it directly, throw in some user experience stuff too. Honestly, I'd start simple with alerts on those basics first - you can always get more sophisticated later once you're not putting out fires constantly.
Look, monitoring tools are a game changer - they show you what's actually going down with your systems in real time. Catch problems before they blow up into disasters. See which processes are eating all your resources. I swear there's something weirdly satisfying about those green dashboards too, maybe I'm just a nerd like that. Don't try tracking everything though, you'll go crazy. Pick 3-4 metrics that actually matter to your team and set up smart alerts. That way you're not staring at screens all day but still catch issues fast.
Okay so real-time data is huge for monitoring because you'll spot problems while they're actually happening, not hours later when users are already pissed. You get instant visibility into response times, error rates, system health - all that stuff. This way you can fix things before they get worse instead of being the poor guy dealing with outages at like 3am (been there, not fun). Set up good alerting thresholds so you're notified when things go sideways. Trust me, catching issues early beats scrambling to fix disasters later.
So basically, leading indicators predict what's coming - stuff like customer satisfaction scores, training hours, website traffic. You can actually control these before results hit. Lagging indicators? That's what already happened. Revenue, profits, churn rates. Here's the thing though - everyone gets obsessed with lagging metrics because they're concrete numbers. But honestly, that's backwards thinking. It's like only checking your rearview mirror while driving. The real game is finding 2-3 leading indicators that actually move your important lagging ones. That's where you can change things before it's too late.
Honestly, the worst part is drowning in data - your systems will spit out tons of metrics but most are useless noise. I've seen dashboards with like 50 charts that just sit there collecting digital dust. Teams also get super defensive thinking you're trying to spy on them, which is... fair, I guess? Performance hits from monitoring tools can bite you too. Oh, and good luck getting everything to play nice across different platforms - legacy systems are the worst for this. My advice? Pick maybe 3-4 metrics everyone actually cares about first. Don't go crazy right away.
Set up automated alerts that kick off review sessions when your metrics go wonky. Make it a two-way street - dashboards show problems, you pull in the affected teams for feedback, then tweak your monitoring based on what they tell you. Honestly, most monitoring systems just become these forgotten data graveyards. Ask your stakeholders monthly if you're actually tracking stuff they care about. Which alerts helped vs which ones were just annoying noise? I'd start there and work backwards.
Honestly, engagement and performance monitoring are super connected. Your engaged people hit targets way more consistently and actually improve over time. They produce better work, meet deadlines, and solve problems before you even know there's an issue. Reviews go smoother too since they don't get defensive about feedback. Disengaged employees? Total opposite - their performance data shows clear declining patterns that stick out like a sore thumb. If you're scratching your head over weird performance trends, I'd check engagement first. Nine times out of ten, that's where you'll find your answer.
Run your system for at least a week while monitoring everything - response times, throughput, CPU, memory, errors. Different times matter too: peak hours vs weekends hit differently. I grab data points every 5-10 minutes since hourly averages can totally miss those nasty spikes. Write down any weird events like deployments or big campaigns that'll throw off your numbers. Honestly, this part's boring but you'll thank yourself later. After you've got clean data, set alerts maybe 10-20% above your normal ranges. That way you'll catch real problems without getting pinged every time someone sneezes.
Stick with simple charts that actually tell a story. Line graphs work great for trends, bar charts for comparisons. Your audience should get the point in like 3 seconds - I can't tell you how many messy graphs I've sat through that just made everyone more confused. Keep your colors consistent and label stuff clearly. Oh, and always mention the time period you're measuring. Here's the thing though - lead with why the data matters before you show all the numbers. Trust me, your stakeholders will actually pay attention instead of checking their phones.
Yeah, GDPR basically ruined the "collect everything and figure it out later" approach. Now you've got to justify why you're tracking each thing, especially if it touches user identity. Honestly kind of annoying at first, but it actually makes you think harder about what metrics you really need. Get consent when you have to, anonymize stuff early in the pipeline, and don't just grab data because you can. Oh and document your reasoning - auditors love that. It's more work upfront but your monitoring strategy ends up way cleaner.
Dude, AI-powered anomaly detection is huge right now - cuts down on so much noise. OpenTelemetry finally gives us consistent instrumentation (thank god). Real-time observability platforms are solid too, they mesh metrics, logs, and traces together nicely. Synthetic monitoring's getting more attention, plus chaos engineering tools that actually test if your stuff breaks gracefully. Oh, and edge computing monitoring since everyone's pushing workloads closer to users these days. Honestly? Just see what your current APM vendor's doing with AI insights first. That'll probably give you the biggest bang for your buck on alert fatigue.
Honestly, performance monitoring is just about getting real data so you know what's actually happening vs. what you think is happening. Track your key metrics over time and you'll start seeing patterns - like where things are getting stuck or what's really moving the needle. Way better than just guessing, you know? I'd say pick maybe 3-5 metrics that tie to your actual goals and check them weekly. Don't go overboard with too many at first though - you'll just overwhelm yourself. It's kinda like checking your bank account regularly instead of avoiding it and hoping for the best.
Think of performance monitoring as your reality check - it cuts through all the BS about what you *think* is happening. Real data beats gut feelings every time when you're deciding where to throw money or change direction. Honestly, I've watched too many teams crash because leadership just winged it without looking at actual numbers. Set up dashboards that match your goals, then actually use them before making big moves. Short sentences work. The metrics you track will tell you whether to keep pushing forward, adjust course, or bail entirely. Pretty straightforward stuff.
Honestly, most teams get this backwards - they track whatever's easiest instead of what actually matters. Start with your company's real goals first, then work backwards to find metrics that actually impact revenue or customer happiness. I've seen so many dashboards full of impressive-looking numbers that mean absolutely nothing for the business. Quarterly reviews are clutch for catching when you're drifting off track. Oh, and make sure executives can actually understand how your metrics connect to money - they don't care about your technical performance stats if it doesn't tell a clear story about business impact.
Honestly, transparency is everything here. Pick 2-3 metrics that actually move the needle for your team - not just busy work numbers. Then put that data where everyone can see it, like a shared dashboard or something. Regular check-ins beat those awful annual reviews every time. Nobody wants to get blindsided in December about stuff from March, you know? Make sure people can see how their work connects to the bigger picture. When someone crushes it, celebrate that publicly. Problems? Jump on them fast before they get messy. Oh, and definitely avoid tracking too many things at once - that's where accountability systems go to die.
-
I was confident and well prepared for my presentation for the first time ever. With SlideTeam’s templates, I could deliver one of my best presentations. Will be coming back for more!
-
“Slides are formally built and the color theme is also very exciting. This went perfectly with my needs and saved a good amount of time.”