


Quality Metrics Project Management With Non- Conformance Dashboard





Try Before you Buy Download Free Sample Product
 Impress Your
Audience
 100%
Editable
 Save Hours
of Time


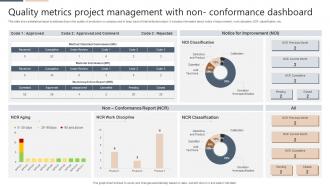
This slide shows statistical report to address drop in the quality of products in a company and to keep track of total defected output. It includes information about notice of improvement, work discipline, NCR classification, etc.
People who downloaded this PowerPoint presentation also viewed the following :
Quality Metrics Project Management With Non- Conformance Dashboard with all 7 slides:
Use our Quality Metrics Project Management With Non- Conformance Dashboard to effectively help you save your valuable time. They are readymade to fit into any presentation structure.






FAQs for Quality Metrics Project Management With
Honestly, start simple - pick defect density (bugs per lines of code) and test coverage percentage. Those two will tell you the most right away. Mean time to resolution is clutch too if you're drowning in bug fixes. Code review metrics are where it gets interesting though - track how long reviews take and how many defects they catch. Trust me, good reviews save your ass later. Oh, and if you're doing CI/CD, definitely watch deployment frequency and rollback rates. Customer-reported bugs vs internal ones is another good split to track. Don't go crazy with metrics at first - just focus on whatever's causing you the biggest headaches right now.
Track the obvious stuff first - NPS and customer satisfaction scores are solid starting points. Resolution times matter too. But here's the thing: those numbers only tell half the story. Customer effort scores show you how hard people have to work to get help (which honestly bugs me more than slow service sometimes). Retention rates and repeat purchases reveal what customers actually think versus what they say in surveys. Oh, and read the written feedback! I know it's tedious, but that's where you'll spot patterns the metrics miss.
Defect rate, first-pass yield, and cycle time - start with those three. They'll show you what's actually happening with your process. Customer complaints and rework costs are worth watching too since they mess with your profits. Too many companies go crazy tracking like 15-20 metrics and it just becomes overwhelming noise honestly. Get good at measuring these basics first. You can always add more later if you need process-specific stuff. Oh, and definitely establish baselines for each one - otherwise you won't know if you're actually improving or just spinning your wheels.
So here's the thing - better quality actually makes your operations way smoother. When customers stop complaining as much, your team isn't scrambling to fix stuff constantly. First-call resolution is huge for this. Sure, you might need to go slower at first (which honestly feels counterintuitive), but it pays off. I'd focus on maybe 2-3 quality metrics that hit your biggest headaches. Track those for three months and you'll probably see your costs drop while productivity goes up. It's one of those rare win-wins that actually works.
Quality metrics are basically your proof you're hitting industry standards - auditors and regulators want to see measurable evidence. Start by figuring out which standards actually apply to you (ISO, FDA, whatever). Then map your current metrics against what they require so you can spot gaps. Honestly, most companies collect way too much useless data. The trick is tracking the RIGHT metrics consistently, not just everything you can measure. You need this stuff to demonstrate compliance during assessments and catch problems before they turn into violations. It's all about having documented proof you're meeting their benchmarks.
Start by measuring where you're at now - that's your baseline. Pick metrics that actually mean something to your customers, not just random data points because they're easy to track. Honestly, too many companies get metric-crazy and lose focus. Watch for trends in defect rates, customer satisfaction, that kind of stuff. Negative patterns? That's where you dig in. Set up monthly reviews with your team to look at the numbers together and figure out what's going wrong. Don't forget to measure whether your fixes actually worked - I've seen teams implement changes and never check if they helped.
Honestly, data consistency is gonna be your biggest headache. Teams will define "defects" totally differently, and once people know they're being measured, they'll start gaming the system - Goodhart's Law in action. Integration between tools is usually a nightmare too. Then there's the timing problem where defects show up weeks after you've already collected your data. I learned this the hard way on my last project. Set clear definitions from day one and audit your process regularly. Otherwise you'll end up with garbage data that looks impressive but tells you nothing useful.
So basically, quality metrics show you exactly what's going wrong and where. Like if people keep messing up data entry or missing deadlines, boom - there's your training gap right there. I honestly think it's way better than just guessing what people need help with. You can look at individual trends too, see if someone's scores are tanking in specific areas. Then instead of doing the same boring training for everybody, you actually target what needs fixing. Oh and definitely look at patterns over time though - we all have crappy days that don't mean anything.
There's a bunch of ways to go here depending on what you're working with. SonarQube and CodeClimate are pretty solid for code quality - they play nice with most CI/CD setups. Jira's great for tracking bugs, TestRail handles test management well, and New Relic or Datadog will cover your performance stuff. The real trick is finding tools that actually integrate with each other. I've wasted way too much time copying data between systems that don't talk. Sometimes a simple Grafana dashboard does the job better than some fancy tool anyway. Start with whatever fits your current workflow best.
Figure out what your company actually wants first. Customer retention matters most? Track defect rates and how happy users are. More about growth? Focus on how fast you ship features. I've seen way too many teams obsess over metrics that literally don't matter. Work backwards from your top 2-3 business goals to find quality metrics that actually impact them. Don't go crazy measuring everything - that just makes you lose focus. Stick with maybe 3-5 key ones and track them religiously. Less is more here.
Look, quality metrics are basically a direct line to your profits. Track stuff like defect rates and customer complaints - you're literally watching where money's bleeding out. Better quality means fewer returns, less warranty headaches, and customers who actually stick around and tell their friends about you. Honestly, keeping existing customers is so much cheaper than chasing new ones. Here's what I'd do: find your top 3 quality problems that cost the most money. Set up basic tracking for those. You don't need anything fancy at first. The financial impact shows up faster than you'd think.
Make those quality metrics visual and tie them to what each team actually gives a shit about. Show support how bug rates mess with customer happiness. DevOps teams want to see how code quality connects to deployment speed - that's their jam. Honestly, just dumping spreadsheets on people is useless. Get everyone in a room for regular reviews where you actually walk through the numbers together. Teams need to see how their day-to-day work fits into the bigger quality story. Oh, and let them dig deeper into their own stuff when they want to.
Look, defect counts and test pass rates sound good on paper, but they're useless in agile. By the time you see those numbers, you've already shipped broken stuff weeks ago. Short sprints mean you need feedback that actually keeps up. Honestly, I've seen teams obsess over test coverage while their users are screaming about bugs they can't even measure. Focus on deployment frequency and lead times instead - that's where the real insights are. Customer satisfaction scores too, obviously. You want metrics that help you pivot fast, not ones that tell you what went wrong last month.
So B2B and B2C metrics are totally different beasts. With B2B, you're tracking things like implementation success and lifetime value - basically does this actually help their business? Meanwhile B2C is all about user experience stuff like satisfaction scores and whether people stick around. Here's the thing though - B2B customers will put up with complicated systems if they work. B2C users? They'll ditch you in seconds if it's confusing. My advice is figure out if you're solving business headaches or everyday consumer problems first. Then your metrics will be way more obvious.
Honestly, turning your quality data into charts is a game changer - no more drowning in spreadsheet hell. You'll actually see patterns jump out at you. Heat maps show where things are breaking down, trend lines reveal if you're improving or getting worse over time. Plus it's so much easier explaining problems to your boss when you can point to a visual instead of rambling about numbers. The coolest part? You start noticing connections between different metrics that you'd never catch otherwise. I'd say start with basic charts first - don't go crazy with fancy stuff until your team gets used to reading them.
-
Unique research projects to present in meeting.
-
Thank you for showering me with discounts every time I was reluctant to make the purchase.