


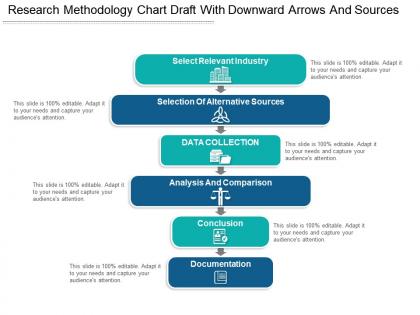
Research methodology chart draft with downward arrows and sources




Try Before you Buy Download Free Sample Product
 Impress Your
 Audience
 100%
100% Editable
 Save Hours
 of Time


Agreements emerge with our Research Methodology Chart Draft With Downward Arrows And Sources. They ensure conflicts fade away.
People who downloaded this PowerPoint presentation also viewed the following :
Research methodology chart draft with downward arrows and sources with all 5 slides:
Explain how to follow a balanced diet with our Research Methodology Chart Draft With Downward Arrows And Sources. Elaborate on the different ingredients.

FAQs for Research methodology chart draft with downward
So basically, quantitative is all about numbers and data you can measure - surveys, experiments, that kind of stuff. Qualitative? That's more like interviews and observations where you're trying to figure out the "why" behind what people do. I honestly used to think quantitative was more "real" research (probably because it looks more scientific), but they're just different approaches. Use quantitative when you need hard proof or want to measure something. Go with qualitative if you're exploring messy human stuff or need context. Really depends what you're trying to figure out.
Okay so first figure out what you're actually trying to learn - like are you exploring something totally new or testing out a specific idea? That'll basically decide your method for you. Quantitative is solid when you need hard numbers and want to measure relationships between things. Qualitative though? That's where you get the juicy "why" stuff behind people's behavior. Honestly, mixed methods sounds amazing in theory but it's a pain to pull off well. Also think about your timeline and budget - sometimes the "ideal" approach just isn't realistic. I'd probably sketch out pros/cons for 2-3 options and see what actually works with your constraints.
Your lit review is basically your roadmap for methodology - it shows what's worked before and what bombed. You'll spot gaps where your research fits in, plus it guides your data collection choices. Honestly, I learned this the hard way my first semester. Don't skip this step or you'll end up reinventing methods that already exist. It gives you solid reasoning for why you picked certain approaches too. The theoretical framework you build from it? That's what backs up your entire methodology section. Trust me, do this deep dive first - future you will thank you when everything clicks together.
Honestly, mixed-methods is where it's at. You get the hard numbers from surveys and stuff, but then interviews tell you *why* those patterns exist. Like, stats might show customer satisfaction dropped 20%, but talking to people reveals it's actually about your new checkout process being confusing. The combination is way stronger than doing just one or the other. I always recommend starting with a survey to spot trends, then interviewing a smaller group to dig deeper. It's more work upfront but you'll actually understand what's happening instead of just staring at charts wondering what they mean.
Okay so safety first - both physical and mental stuff. Make sure people actually get what they're signing up for and can bail whenever. Data privacy is massive, especially if you're dealing with personal topics. Some methods are just trickier ethically - like if you're observing people without them knowing versus just sending out surveys. Your IRB will catch the obvious red flags, but think about power imbalances and vulnerable groups too. Oh, and whether your research actually helps the people you're studying or just your CV. When in doubt, play it safe.
Your sampling method can totally make or break everything. Random sampling? That's your gold standard - gives you the best chance your results actually mean something beyond just your specific group. Convenience sampling is sketchy for validity (though honestly, sometimes you're just working with what you can get). Stratified and systematic methods are decent middle ground options. The key thing is being upfront about whatever approach you used and owning up to the limitations when you share your findings. Otherwise people might think your results apply way more broadly than they actually do.
It really depends on what kind of research you're doing. Surveys? Go with Qualtrics, SurveyMonkey, or just Google Forms if you're on a tight budget. SPSS and R are your friends for crunching numbers afterward. Doing interviews? Zoom works fine, then use NVivo or Atlas.ti for coding - though honestly, they have a bit of a learning curve. Otter.ai is clutch for transcriptions. Oh, and if you're doing fieldwork, KoBo Toolbox is pretty solid on mobile. Mixed methods gets messy since you'll need multiple tools. Figure out your data collection method first, then pick what fits your budget and how tech-savvy you are.
So you've got two things to tackle here - reliability and validity. Reliability's about consistency, like if different people code your data, do they get the same results? Test-retest stuff works too. Validity is trickier - are you actually measuring what you think you are? I always pilot test first because you'll catch weird issues early. Cross-checking with other methods helps tons. Get someone else to look at your instruments too, fresh eyes spot problems you miss. The theoretical side gets messy, but honestly the practical stuff matters way more. Just document everything so people can judge your work fairly.
Oh man, data collection is where everything goes sideways. People drop out constantly, and gatekeepers can be total roadblocks. Your target group? Way harder to find than you think. Equipment breaks at the worst times - I swear it's like Murphy's law specifically targets researchers. Budget stuff gets messy fast too. Then halfway through, you might realize ethical concerns mean changing your whole approach. Time always runs out quicker than expected. Honestly, just assume nothing will go according to plan. Build in extra time and have backup options ready from day one.
Don't get stuck thinking your methodology is perfect from day one. Run a pilot or start collecting data, then actually pay attention to what's working and what isn't. Your survey questions might be confusing (I've been there), or maybe you're not getting the diversity you wanted in your sample. Based on what you find, tweak your approach - change how you collect data, adjust your research questions, whatever needs fixing. Stay flexible but don't throw scientific rigor out the window. Just make sure you document everything you change so your final write-up matches what you actually did.
Honestly, pilot studies are a lifesaver. They let you test if your survey questions actually make sense to real people, figure out if your sample size is even doable, and catch any weird issues with how you're collecting data. It's like a practice run before the real thing - way less stressful than finding out your methodology is broken halfway through. Oh, and you get some early data to tweak your hypotheses too. I learned this the hard way my first year. Definitely set aside time and money for one upfront. Trust me, you'll thank yourself later when everything runs smoothly.
So your research design basically decides what analysis tools you can actually use later. Quantitative means you're stuck with stats - regression, correlations, all that fun math stuff. Go qualitative and you'll be coding interviews and doing thematic analysis instead. Mixed methods just means double the work honestly. The thing is, once you pick your design, you're kinda locked into certain analytical paths. I learned this the hard way on my thesis - picked something that didn't match what I wanted to find out. Just make sure your design actually fits the insights you're after.
Document literally everything - data collection, analysis steps, how you picked your samples, every decision you made. Put your raw data and code in public repos when you can. Seriously, I've watched so many studies crash and burn because people got lazy with the boring documentation stuff. Pre-register your hypotheses before you start collecting anything (saves you from p-hacking drama later). Stick to standard protocols where they exist. Be honest about limitations or when you had to deviate from your original plan. Oh, and start that research journal now - you'll be so grateful when reviewers come asking questions six months from now.
Honestly, yes - visuals save your methodology section from being a total snoozefest. Flowcharts work great for showing your process step-by-step. Timelines help people actually follow your project phases instead of getting lost in paragraph soup. I've sat through way too many presentations where everyone just checks out during the methods part. It's brutal. Diagrams are clutch for mapping sampling strategies too. Templates give you a starting point so you're not staring at a blank page forever. Pick something that fits your research type and tweak it from there. Your audience will actually pay attention.
Working with others on research is honestly a game-changer. Different people catch things you'd totally miss - like I've watched solo researchers completely overlook obvious methodology problems that any teammate would've spotted right away. Plus everyone brings their own expertise to the table, which just makes everything stronger. The peer review thing is clutch too. Better to have your colleagues poke holes in your approach early than discover major issues later (been there, not fun). You can also cross-check findings and cut down on personal bias. Set up regular check-ins where people can actually critique stuff openly.
-
Informative presentations that are easily editable.
-
Thanks for all your great templates they have saved me lots of time and accelerate my presentations. Great product, keep them up!