When a musician composes a song, he follows a course of steps to create the desired music. Similarly, a methodology chart consists of sequential steps and stages. Each stage in the chart must be executed in the correct order to complete the project successfully.
Methodology charts are mostly used in scientific, academic, industrial, and business settings to communicate the approach taken to design a product or plan an experiment. A methodology chart breaks down the process into multiple phases with steps that have to be taken for the success of each phase. This outlining of phases and activities helps team members and stakeholders understand the workflow and forces behind the decisions made.
A project management methodology highlights the principles, techniques, and process flow for the project managers to employ and manage projects. Explore our blog on Top 10 Project Methodology Templates to know more.
Why Should You Use a Methodology Chart?
A methodology chart facilitates managers or investors in evaluating the reliability of the anticipated results. When the team members understand the methodology, they can assess the soundness of the conclusion, align with the objectives, and identify potential risks. It also helps identify areas for improvement. Maintaining a chart also acts as a reference point for future projects that require the same approach.
According to a recent survey, 82% of the CEOs at established companies reported that implementing a clear project methodology chart has been one of the key growth drivers over the past 6 years.
For example, Spotify, a popular music streaming platform, implemented a methodology chart called the “Spotify Squad Model.” This methodology model utilizes an agile and Kanban methodology chart, which depicts its organizational skills. It highlights the company’s workflow, future projects, and development tasks. The chart monitors the team’s speed and delivery timelines and provides a roadmap to communicate the company’s future objectives. The visual nature of the chart promotes transparency, alignment, and collaboration among teams.
Methodology Chart Templates
The value of a robust methodology chart in an organization cannot be underscored. It's a map that guides the teams further towards the success of a project. It illustrates the job responsibility of every team member and makes sure that it aligns with the company objectives. These are the best PowerPoint templates on a methodology chart that you must include in your presentation.
These are on topics like research, management, the learning workshop process, PMO methodology, and more. You can utilize these pre-designed slides for any business or process.
They are 100% customizable and editable, giving you the flexibility to adapt them to your specific business needs.
Let's explore!
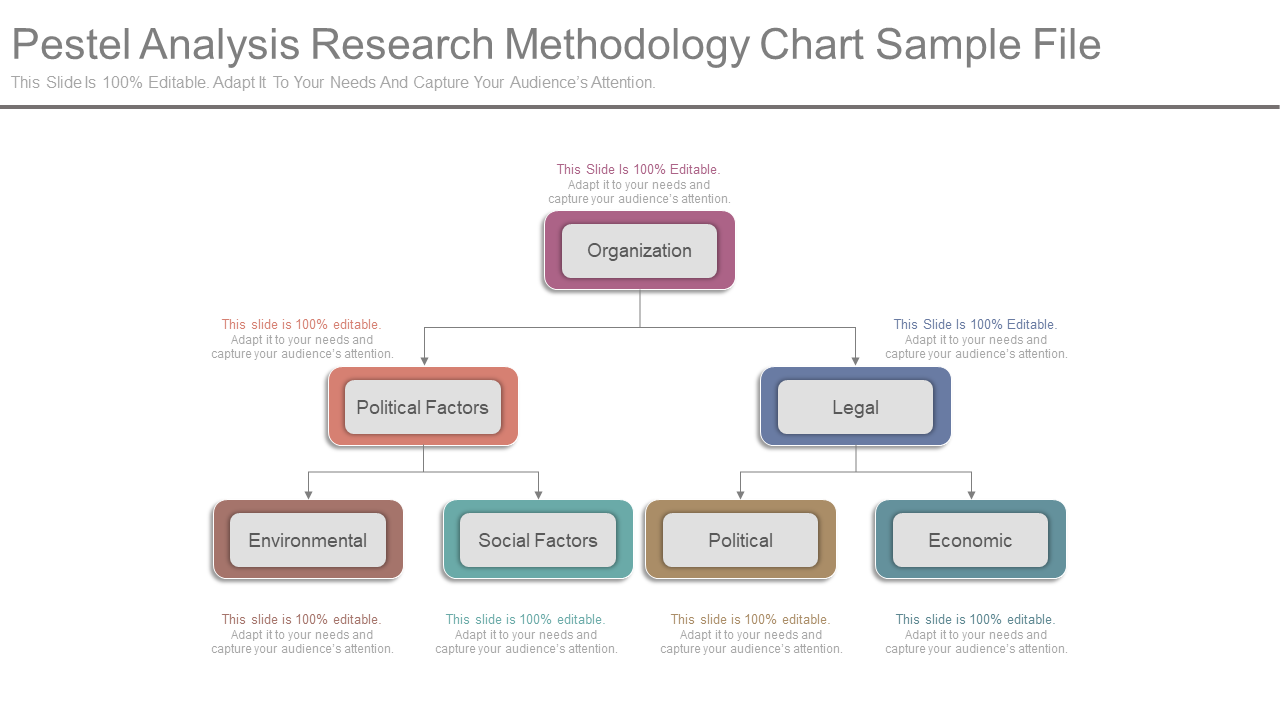
Template 1: Pestel Analysis Research Methodology Chart
This PowerPoint Slide showcases the PESTEL Analysis Research Methodology as a strategic tool that helps in understanding the external factors that influence organizational strategies and performance. It includes a chart depicting factors like legal, environmental, social, and economic factors that impact decision-making progress. Each of these factors is coded for easy comprehension to understand the impact on business operations, leading to decision-making accordingly.
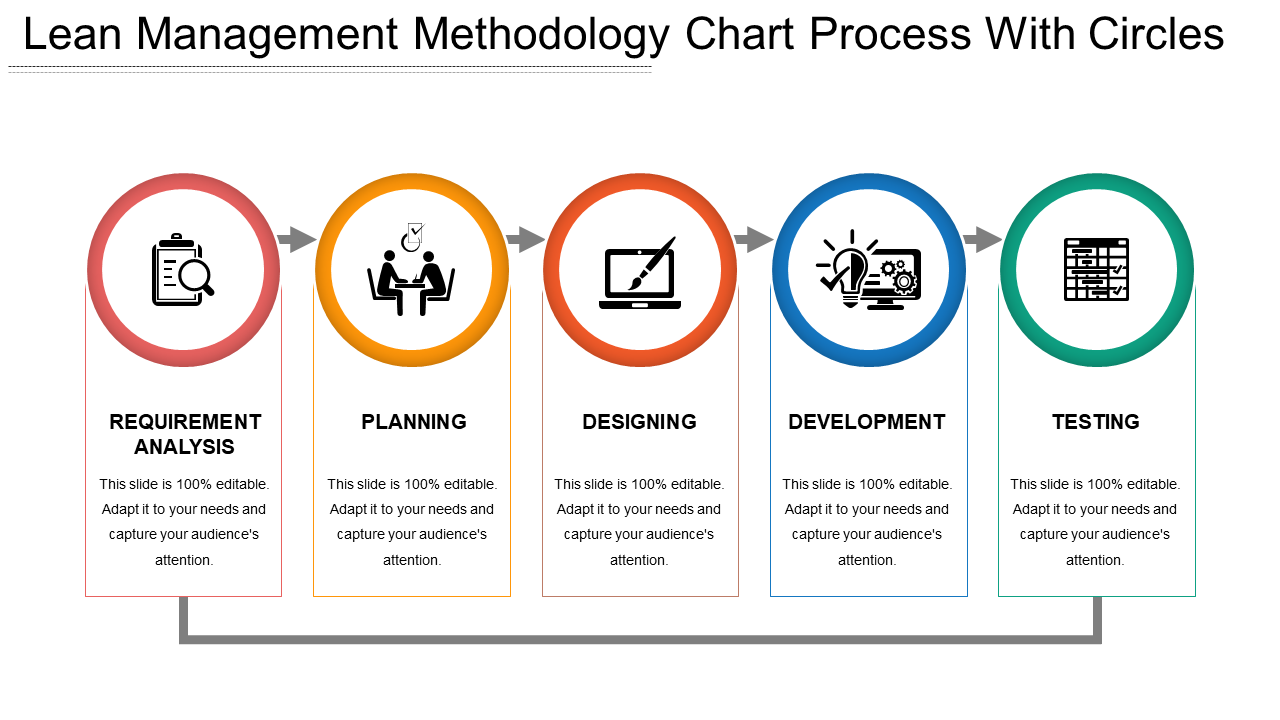
Template 2: Lean Management Methodology Chart Process with Circles
This PowerPoint Slide showcases the Lean Management Methodology process with the help of circles. Each circle depicts a step in the lean management process, such as requirement analysis, planning, designing, development, and testing. Unique icons represent the circles. The visual aid helps viewers understand the flow and the interlink of its components. This allows for a more effective utilization and optimization of lean concepts.
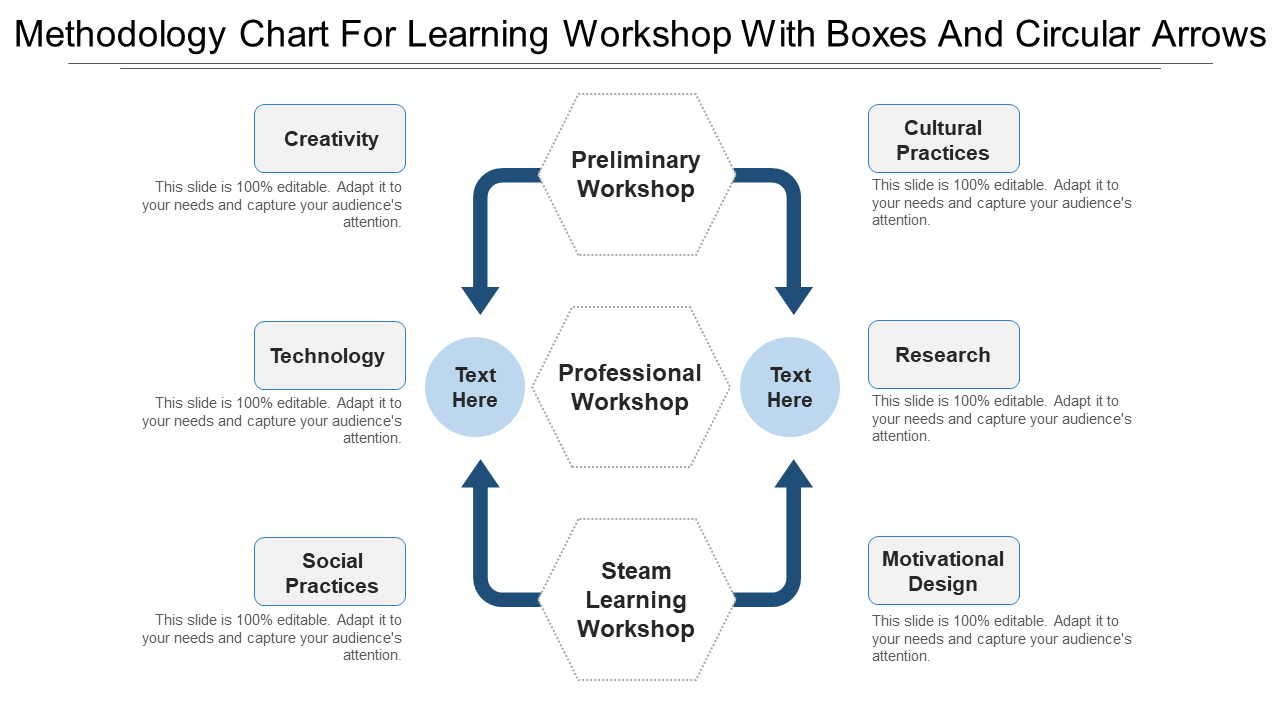
Template 3: Methodology Chart for Learning Workshop with Boxes and Circular Arrows
This PowerPoint Template outlines the step-by-step process for conducting effective learning workshops. It includes preliminary workshops, professional workshops, and steam learning workshops. Each of these helps enhance creativity, cultural practices, technology and research, social practices, etc. This chart serves as a guide for workshop organizers and helps increase learning outcomes and engagement among participants.
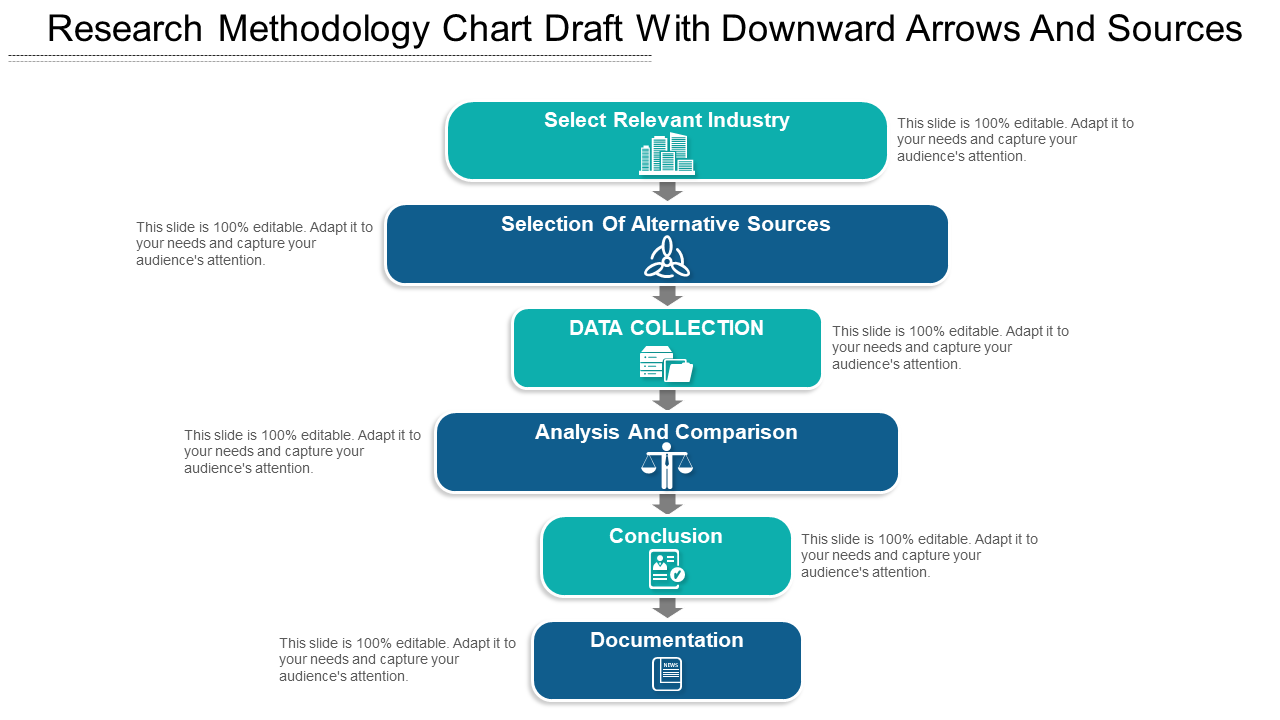
Template 4: Research Methodology Chart Draft with Downward Arrows and Sources
This PowerPoint Slide showcases a Research Methodology Chart Draft with downward arrows and sources. It includes crucial stages in the research like selecting the industry, alternative source evaluation, collection of data, analysis, comparison and conclusion, and documentation. Each of these key metrics is represented by distinct symbols. The layout of the slide makes it easier to understand the flow of the process. It ensures that all essential activities and KPIs are handled properly. Grab this today!
Template 5: Methodology Chart Change Detection Steps with Downward Arrows and Boxes
This PowerPoint Slide showcases a Methodology Chart for Change Detection steps. It includes a downward flow for identifying and managing changes within a system or an organization. Each step of the process flow, from data collection to analysis and implementation, helps in clarity and smooth operations. The downward arrows reflect the order of tasks, which allows an organized approach to change detection and adaptation.
Template 6: Flowchart for Research Methodology with Design and Development
This PPT Slide illustrates a flowchart for Research Methodology, focusing on the design and development stages. It includes key steps, such as identifying problems, objective definition, designing and developing, etc. Further, it includes exhibition, evaluation, and communication of these steps. Each stage is visually represented with unique icons, allowing a systematic approach to research. This template helps ensure clarity and consistency in the research process to execute projects in an orderly manner. Grab it today!
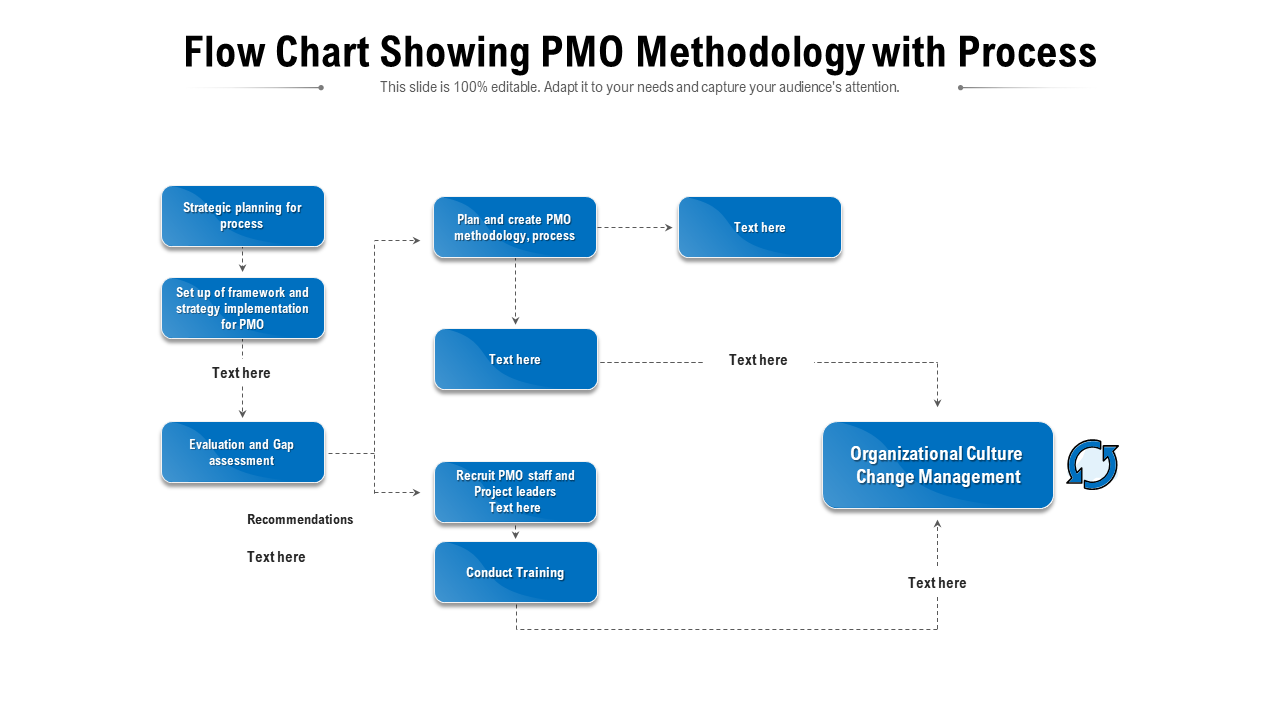
Template 7: Flow Chart Showing PMO Methodology with Process
The chart includes strategic planning for the process, setting up a framework and implementing the strategy, evaluation, and gap management. In addition, monitoring progress and conducting training are also included. Each step is interlinked, highlighting the flow of tasks and the role of the PMO to ensure efficient project delivery and the achievement of organizational goals.
Template 8: Project Lifecycle Methodology Gantt Chart
This PowerPoint Slide showcases a Gantt chart representing the Project Lifecycle Methodology. The template includes three stages of the life cycle: planning and requirements, execution, and closure. Each of these phases is color-coded and contains empty space to display information. The chart provides an overview of the project timeline, allowing the stakeholders to allocate resources and track progress
Chart Your Course with Precision
Every business strives to achieve the company objectives decided for a financial year. However, without a roadmap guiding the way and established milestones, it becomes a challenging task. However, these custom-ready PPT Templates will guide you through the process. They provide a much-needed structure for your presentation and ensure consistency.
By choosing the right methodology at the right time, you can make your projects more efficient. Download these templates now!
If you are incharge of presenting the project flow chart of your project in hand, here are top 5 ready-to-use project management process flow chart templates. Explore now!




 Customer Reviews

