


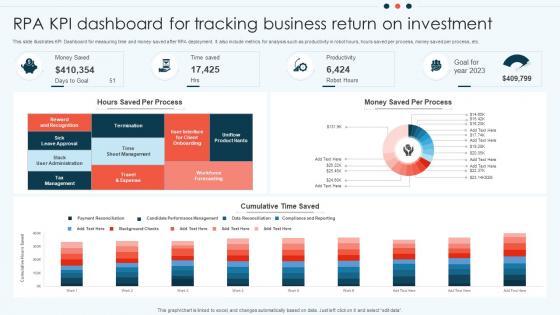
RPA KPI Dashboard For Tracking Business Return On Investment




Try Before you Buy Download Free Sample Product
 Impress Your
 Audience
 100%
100% Editable
 Save Hours
 of Time


This slide illustrates KPI Dashboard for measuring time and money saved after RPA deployment. It also include metrics for analysis such as productivity in robot hours, hours saved per process, money saved per process, etc.
People who downloaded this PowerPoint presentation also viewed the following :
RPA KPI Dashboard For Tracking Business Return On Investment with all 7 slides:
Use our RPA KPI Dashboard For Tracking Business Return On Investment to effectively help you save your valuable time. They are readymade to fit into any presentation structure.






FAQs for RPA KPI Dashboard For Tracking Business
Start with uptime and error rates - those are non-negotiables. Processing time and task volume matter too since they show if you're actually speeding things up or just moving problems around. Cost savings is huge because that's literally all your boss cares about lol. Exception rates and SLA compliance round it out nicely. Honestly though, don't go crazy with like 15 different metrics. Stick to maybe 5-6 max or you'll spend more time staring at dashboards than actually fixing issues. Pick whatever connects most directly to your goals and expand later if needed.
So RPA dashboards are basically your automation's report card - you can see which bots are working great and which ones are slacking off. Real-time visibility means no more guessing games about performance. I'd focus on maybe 3-5 metrics that actually matter to your business instead of tracking everything (that gets overwhelming fast). Set up alerts for the critical stuff so you're not glued to your screen all day. The ROI tracking is probably the most useful part tbh. You can catch issues before they blow up into bigger problems, which has saved me headaches before.
Stick to what your stakeholders actually care about - bot uptime, success rates, time saved, and error counts. Those are your bread and butter. Don't throw everything on one screen though, I've seen dashboards that look like airplane cockpits and nobody uses them. Charts work better than tables, and be consistent with colors - green good, red bad, you know the drill. When someone asks "what went wrong on Tuesday?" you'll need to drill down from the big picture to specific bots. Update it as often as people make decisions based on the data. Start with maybe 5-6 key things, then add whatever people keep bugging you about.
Daily updates are your baseline - don't go less frequent than that. Real-time is obviously best if you can swing it. We usually did hourly refreshes during work hours, which worked pretty well without killing our servers. Weekly? Way too slow for RPA stuff. Bots can go sideways fast and you'll be scrambling to catch up. Match your refresh rate to how quickly you need to jump on issues. Honestly, I'd start daily and ramp up from there as you get better at monitoring. The infrastructure thing always ends up being the bottleneck anyway.
Track completion time, error rates, and throughput first - those are your bread and butter metrics. The time savings will blow your mind once you get through the messy setup phase (and there will be a messy phase, fair warning). Cost per transaction matters too, plus how many employee hours you're actually freeing up. Customer satisfaction scores if people interact with these processes. Your dashboard needs bot utilization rates and exception handling frequency - catches problems before they explode. Oh, and automate the reporting itself. Don't be that person manually pulling numbers every week like some kind of data masochist.
Honestly, Power BI is probably where I'd start - connects to most RPA tools pretty easily and won't kill your budget. Tableau makes gorgeous dashboards but gets expensive quick. UiPath Insights works if you're already using their stuff. More technical route? Grafana or QlikSense could work. The main thing is making sure whatever you pick can actually talk to your RPA platform's APIs without being a nightmare. I'd definitely do the Power BI free trial first though - why spend money if you don't have to, right?
User feedback is honestly everything for RPA dashboards. Regular check-ins with your actual users will show you what's confusing and what they're missing in their daily workflow. I can't tell you how many beautiful dashboards I've seen that just sit there unused because nobody thought to ask what people actually need. Interview your heaviest users first - have them walk through how they typically monitor things. Their pain points will show you the gap between what you think matters and what actually helps them make decisions. Oh, and focus on the ones who'll actually tell you the truth, not just say everything looks great.
Ugh, setting up RPA dashboards is such a pain. Data quality will make you want to scream - bots pull from everywhere and half of it's garbage. Stakeholders argue forever about which metrics matter (honestly, they'll debate anything). You're juggling technical stuff AND business impact, which means different tools and totally different mindsets. Oh, and the dashboard has to grow with your program or it becomes useless. My advice? Start stupid simple. Pick like 3-5 metrics everyone can agree on. Get that working smoothly first. Once people see value and your data doesn't suck, then you can add the fancy stuff.
Honestly, just ask each department what they already care about measuring. Finance wants to see cost savings and fewer screwups. HR obsesses over how fast they can get people onboarded or payroll done. IT teams? They're all about uptime and whether their systems are behaving - total nerds about that stuff. Map your bots to whatever KPIs they're already tracking instead of throwing around vague "we improved efficiency!" claims. Way better to show how your automation actually moves the needle on metrics they already watch. Makes the whole conversation so much easier when you're talking their language.
Look, you really need good visuals for your RPA dashboards. Raw data is just impossible to scan through - who has time for that? Charts and heat maps show you immediately which bots are struggling or if something's completely broken. I learned this the hard way when I was drowning in spreadsheets for weeks. Quick visual snapshots beat staring at numbers any day. Just don't go overboard with fancy graphics. Focus on the stuff your team actually uses to make decisions, and you'll save yourself hours of headaches trying to decode what's going on.
Set up automated validation rules that catch errors before they mess up your numbers. Direct connections to source systems work way better than manual entry - I swear, the stuff people put in spreadsheets when they're guessing is wild. You'll want real-time alerts for weird patterns or missing data. Short bursts work better than long checks. Get someone to review your key metrics weekly so they can spot problems fast. Building these checks into your process from the start beats trying to fix things later when everything's already broken.
Oh man, the worst thing you can do is jam like 15 different metrics on one screen - total chaos. Focus on maybe 5-7 things that actually matter to your boss, not just stuff that's easy to count. Skip the vanity metrics too (nobody cares how many bots you deployed if they're not saving money). Stale dashboards are death - I've seen so many just collecting digital dust because the data stopped updating. Honestly, I'd rather have 3 solid KPIs that auto-refresh than 20 fancy ones that are useless. Business impact beats everything else.
Honestly, start with what actually matters to your company - is it revenue, cutting costs, customer happiness? Whatever's giving your execs headaches. Map your RPA metrics straight to those pain points. Like if they want 15% cost reduction, skip the "bots deployed" nonsense and show real savings. I've watched so many people build these fancy dashboards that look great but mean absolutely nothing. Track stuff like processing time cuts, fewer errors, hours saved. Every single metric needs to tie back to something your leadership actually gives a damn about. Otherwise you're just creating pretty charts that'll get ignored.
Track your ROI first - that's what matters most. Processing time cuts and accuracy boosts are huge too. Bot uptime is critical because there's seriously nothing worse than discovering your automation died three days ago and nobody noticed. Dashboard-wise, show cost savings vs manual work, speed improvements, and how error rates dropped. Volume processed is good data, plus FTE hours saved (executives eat that stuff up). Oh, and check these monthly so you can catch issues before they snowball. Utilization rates help you see which bots are actually worth keeping around.
So basically you need to connect your RPA platform's API to whatever dashboard tool you're using. UiPath and Automation Anywhere both have REST APIs that work great with Tableau or Power BI. The refresh timing is honestly the hardest part - I've learned the hard way that hitting the API every minute will crash things, but waiting too long makes the data useless. 5-15 minute intervals work well for me. Focus on bot uptime, success rates, and queue lengths first. Those are the metrics that actually matter when everything goes sideways at 2am.
-
I’m not a design person, so I couldn’t make a presentation to save my life. Thankfully, they have all kinds of templates that I regularly use for my work.
-
The website is jam-packed with fantastic and creative templates for a variety of business concepts. They are easy to use and customize.