


Russia Ukraine War Impact On Global Inflation Powerpoint Presentation Slides




Try Before you Buy Download Free Sample Product
 Impress Your
 Audience
 100%
100% Editable
 Save Hours
 of Time


Russia invaded Ukraine on 24 February, which raises significant risks for the global economy and inflation, which will hurt the growth rate and increase the prices of goods. Here is an efficiently designed deck on the Russia-Ukraine War Impact on Global Inflation covering the global inflation outlook, including the global inflation rate worldwide, increased cost of various categories, the impact of the Russia Ukraine war, and Russias and Ukraines global commodity production. Secondly, this presentation covers the effects of inflation on the world economy, including consumer price index, decline in GDP, rise in global inflation rate, wage inflation, rising unemployment, and economic impact scenarios. Additionally, it highlights wars impact on different commodities prices, including an increase in oil and gas prices, a rise in food and other commodities price with energy annual inflation rate, and price change in export commodities. Lastly, it showcases wars impact on the worlds major economies, including Asian countries, European countries, India, US, Australia, and China, with different control measures to minimize the impact of inflation. Download our 100 percent editable and customizable russia ukraine war ppt to know more in detail.
People who downloaded this PowerPoint presentation also viewed the following :
Content of this Powerpoint Presentation
The conflict in Ukraine has frayed the global economy, precipitating a range of economic and political consequences. An upheaval in the breadbasket of Europe has brought about rising prices as fuel and food prices have spiraled out of control.
SlideTeam has put together a comprehensive powerpoint presentation focussed on this conflict, and more broadly, on the economic uncertainties that have been unleashed as a result of the war. Use the content-rich slides of this template to clearly analyze and understand the tumultuous economic situation thrust upon major powers as a result of the war, and use the presentation to create a more informed discussion on this subject.
While we’re on the subject of the Russia Ukraine war, click here to check out our presentation on cyber warfare in this very threat of war.
Template 1
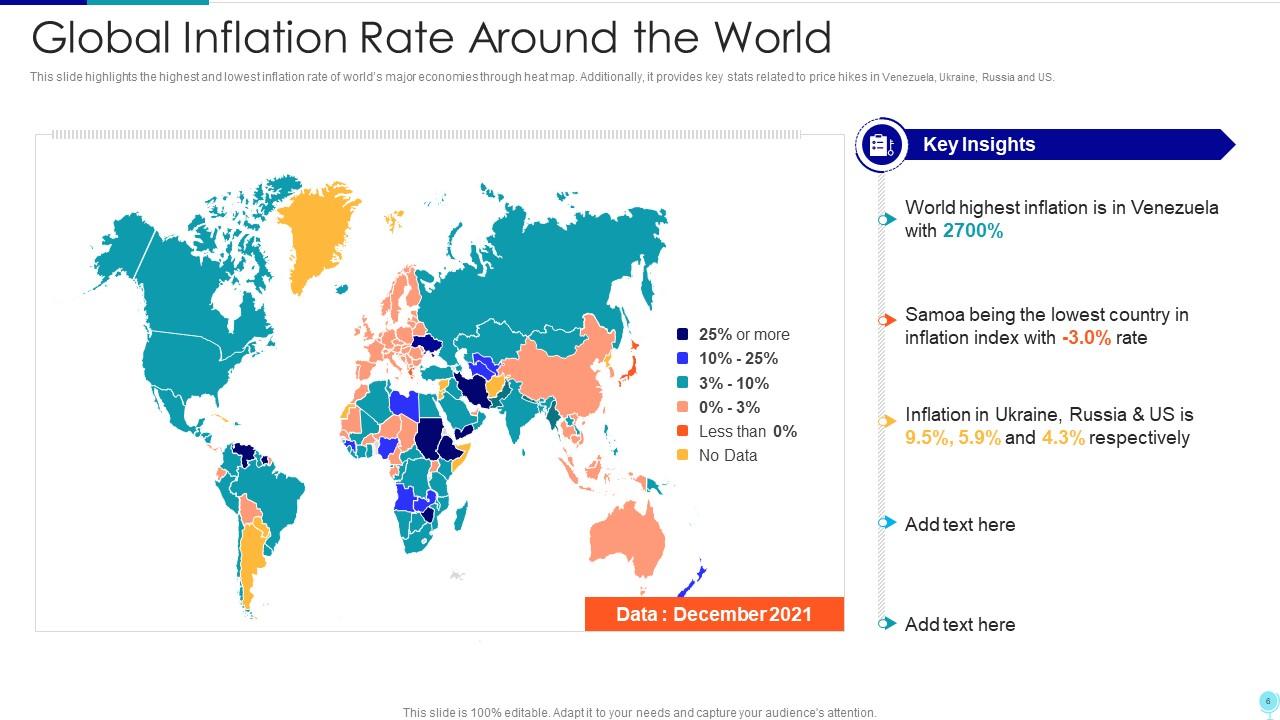
This one-page slide can be an ample guide for anyone seeking to demonstrate, with raw statistics and visual assistance, the impact that the war has had on the economy of nations, including the inflation rates currently. The slide draws out a clear and easy-to-follow map in which the inflationary tendencies of all of the world’s major economies have been compiled and color-graded, allowing the audience to track and assimilate data regarding each specific nation’s economic situation. Also present is a segment on the right hand side of the slide where you can analyze the raw data to create insights.
Template 2
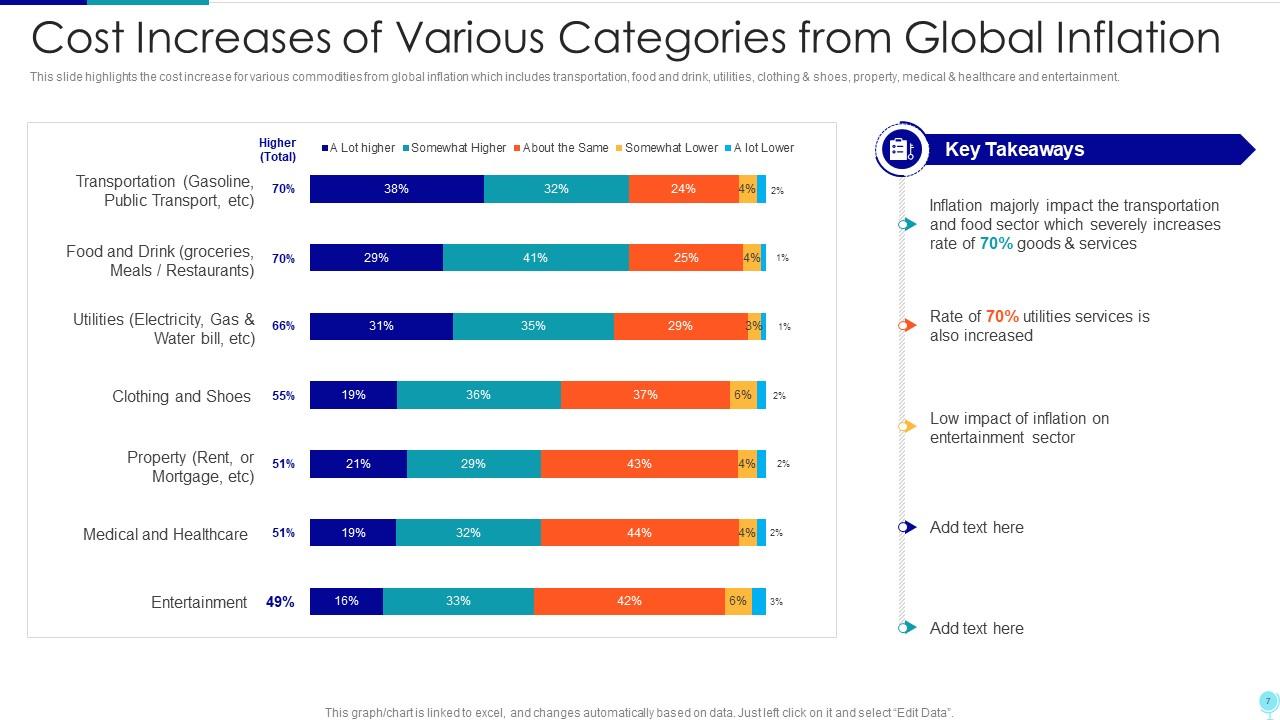
Use this slide to complement and enhance the one presented above, deploying an additional data set to expand the conversation around inflation raised in the earlier template. The slide has a table where the costs of goods are tabulated and statistics regarding rising prices are compiled with these readings. Track a set of key metrics with the help of this slide, and tabulate the fluctuating prices in different industries such as transportation, entertainment, property, the medical business, food and groceries, and more. There is room for the reader to streamline the data and present a set of major insights for the audience, through a ‘key takeaways’ segment on the right hand side of the slide.
Template 3

This one page slide can be a valuable resource for professionals manoeuvring through our current economic landscape. The slide provides a clear and cogent visual illustration that can help you engage in robust strategic planning in the face of evolving economic challenges posed by the Ukraine conflict. Learn about the inflationary situation brought on by the war, and closely assess the impact the conflict has brought on the auto sector, the food and grain sector, transport and energy.
Template 4

This slide engages in a comprehensive data-driven analysis, giving people a more profound assessment of the inflation crisis rendered by the war in Ukraine. The slide presents a clear statistical breakdown of the global commodity sector, and the share of this market controlled by both sides in this war, allowing people to clearly understand the far-reaching implications of this crisis. On the right hand side of the slide is a clear illustration of Russia’s share of commodity production, presented in a graph form, with various metrics being tracked such as oil, natural gas copper, etc. And beside it is a similar graph that takes into account Ukraine’s influence over the market as well.
Use slideteam’s products to have a clearer understanding on the ramifications of the Ukraine war. Click here to check out our other presentation on the impact this war has had on the agriculture industry.
Template 5
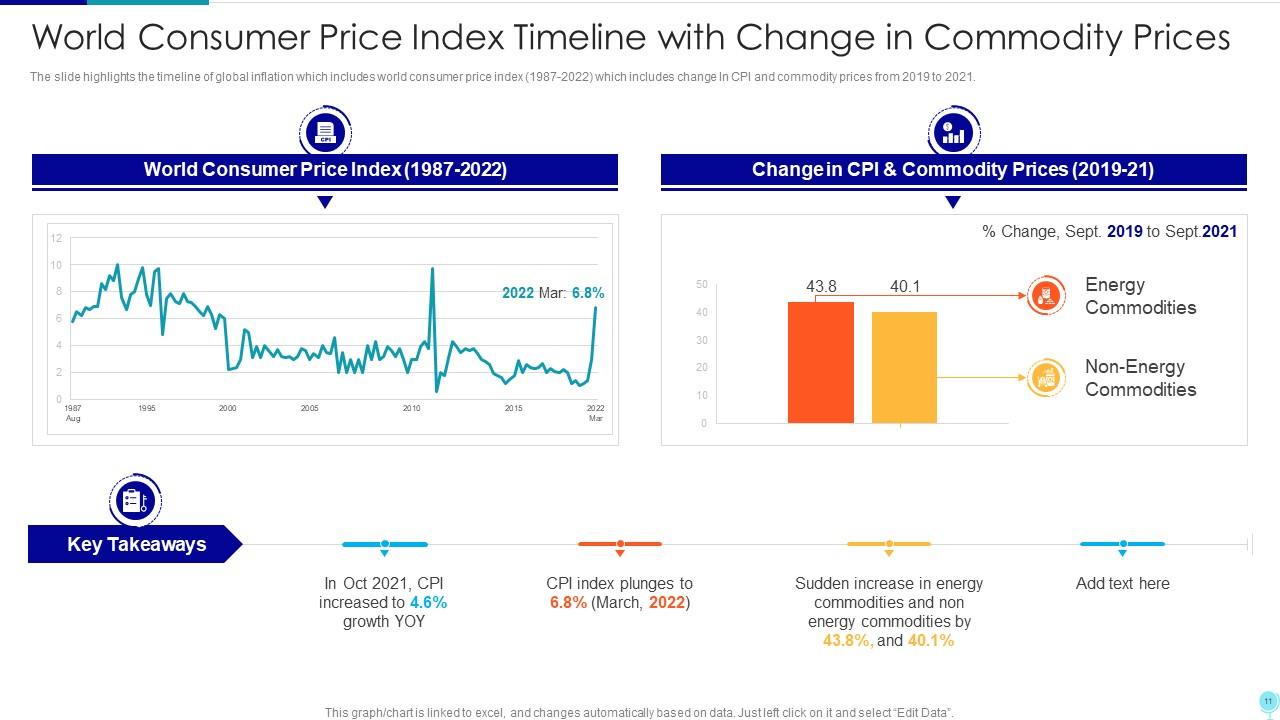
This sharp slide can be a fine tool for assessing multifaceted repercussions of the war in Ukraine, surveying its impact on the global economy through the lens of inflation. This template creates a distilled and thorough analysis of inflationary trends with the help of a graph on the left hand side that tracks commodity prices over a period of time. Beside it is a graph that compiles statistics based on energy commodities and non energy commodities between 2019 and 2021. Comparing the statistics rendered in this slide can give professional analysts a more complete picture of the ever-changing economic landscape rising out of this new war.
Template 6
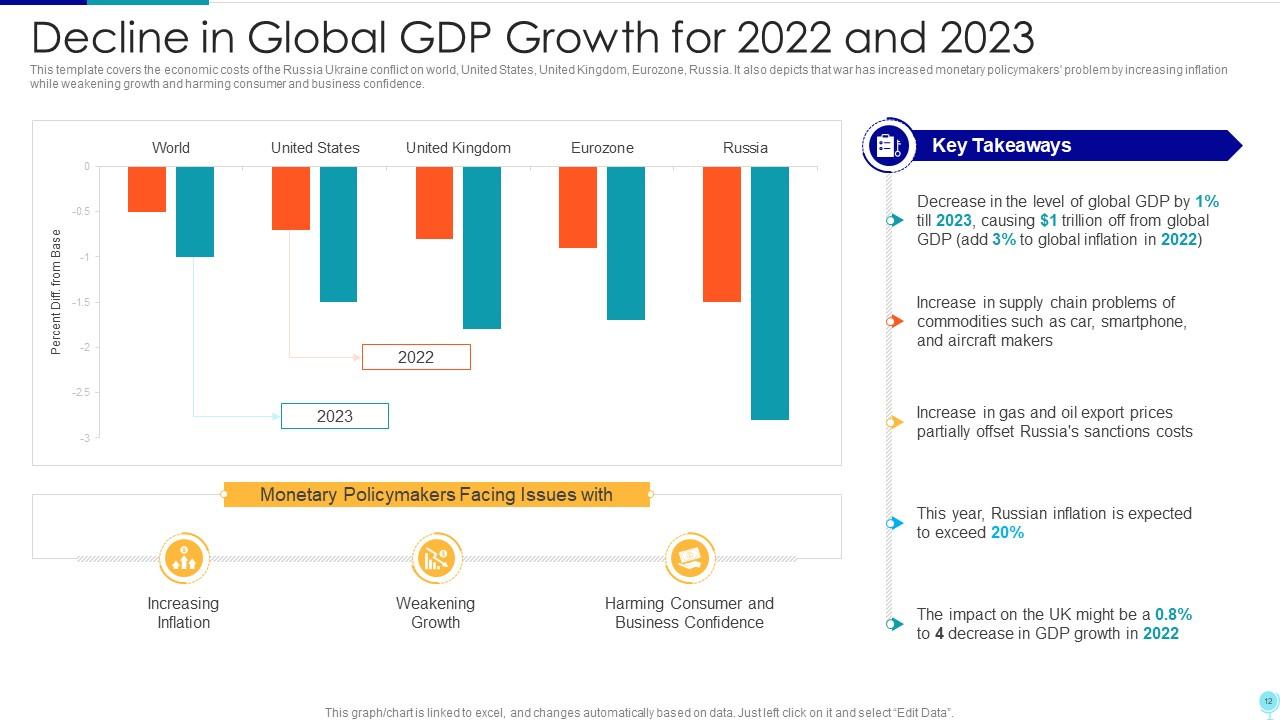
This slide captures a visual illustration of global GDP rates, allowing audiences to clearly track the falling GDP growth figures from multiple regions of the world over the course of 2022 and 2023. There are metrics compiled from the United States, the United Kingdom, the Eurozone, Russia, and ‘the world’. The content of the slide is elegant and easy to follow, allowing users to create insights from the information presented. On the right hand side of the graph is a platform for filtering complex data into actionable insights through the ‘key takeaways’ segment.
Template 7
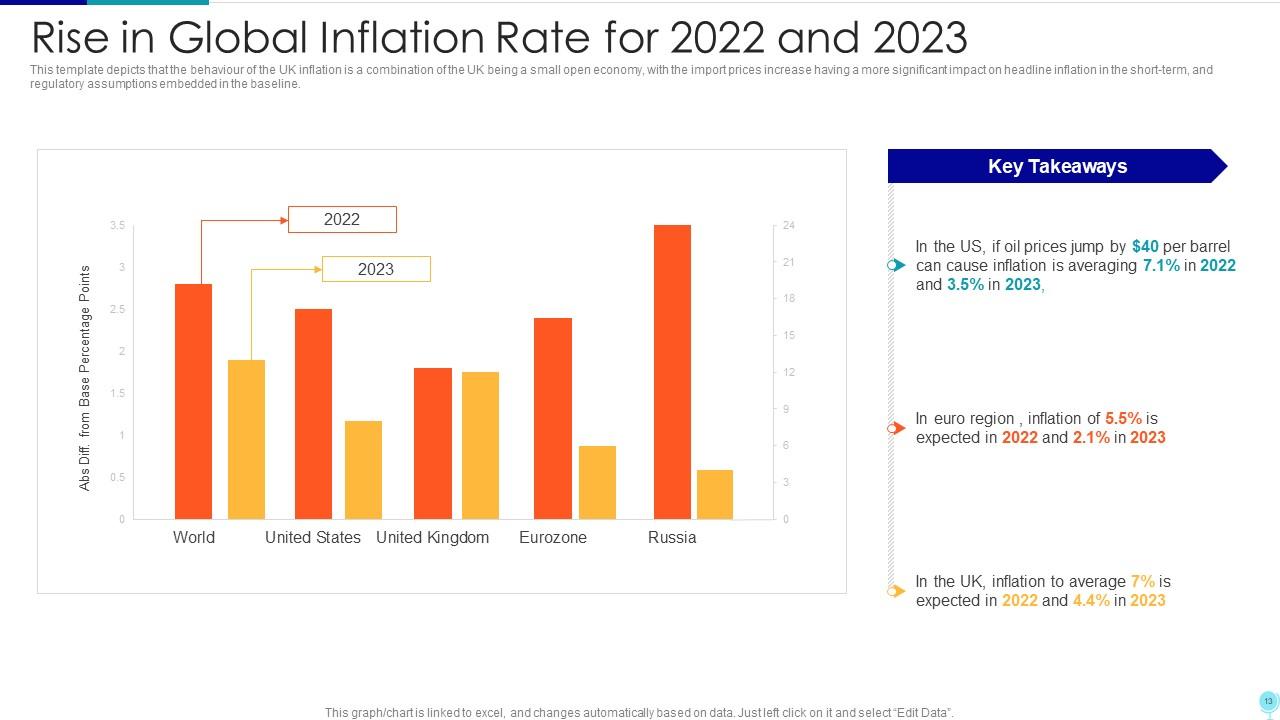
This template helps to synthesize a useful narrative out of the global inflation occurring since 2022, using authenticated data to back up its insights. With the help of this broad spectrum of data, analysts can derive a more complete understanding of the economic ramifications of the conflict. The slide maps out an illustration of inflation rate for multiple countries, pulling data methodically from players in the geopolitical space such as the UK, the US, the Eurozone, Russia, and the global economy.
Template 8
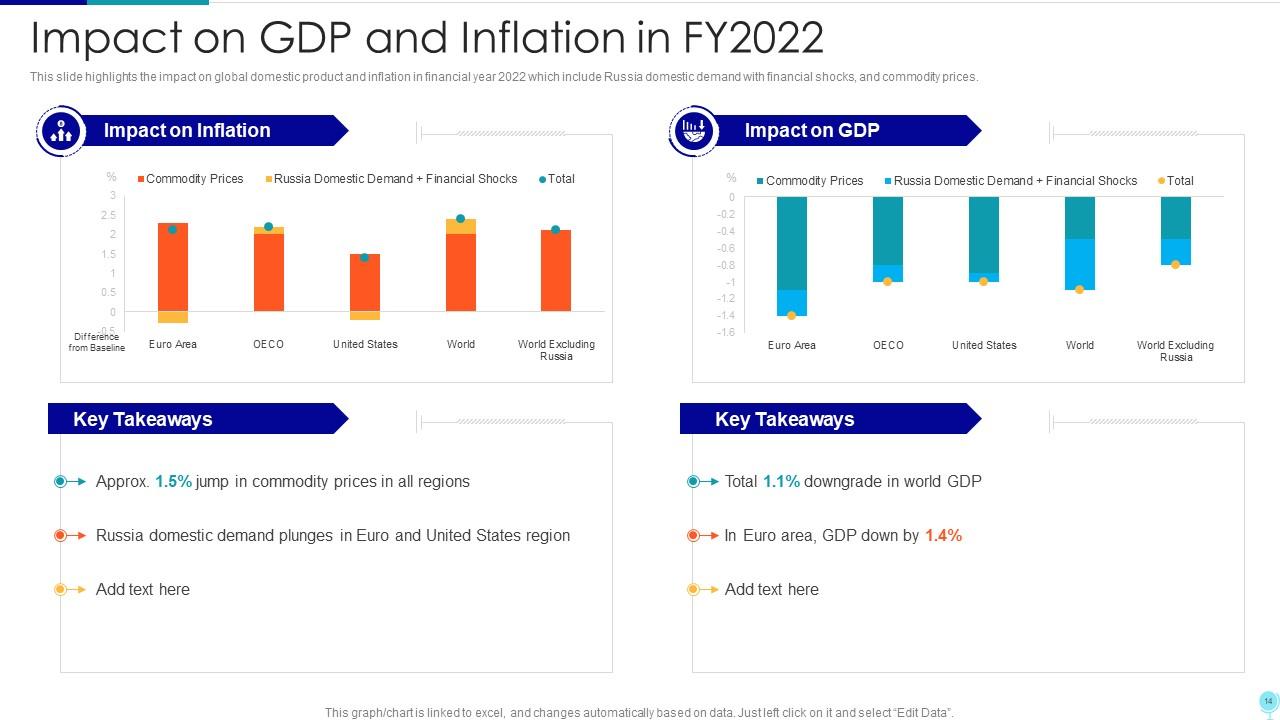
This one-page slide can be a great ally for economic researchers, analysts and anyone seeking to build a more robust narrative on the war on Ukraine and its current economic ramifications. The slide incorporates meaningful data from sources, and tracks a host of crucial metrics that are relevant to this debate for a more healthy debate. Study the war’s impact on inflation, its impact on global GDP stats, and compile some key takeaways by extracting meaningful information from the graphs when it’s all done.
Template 9
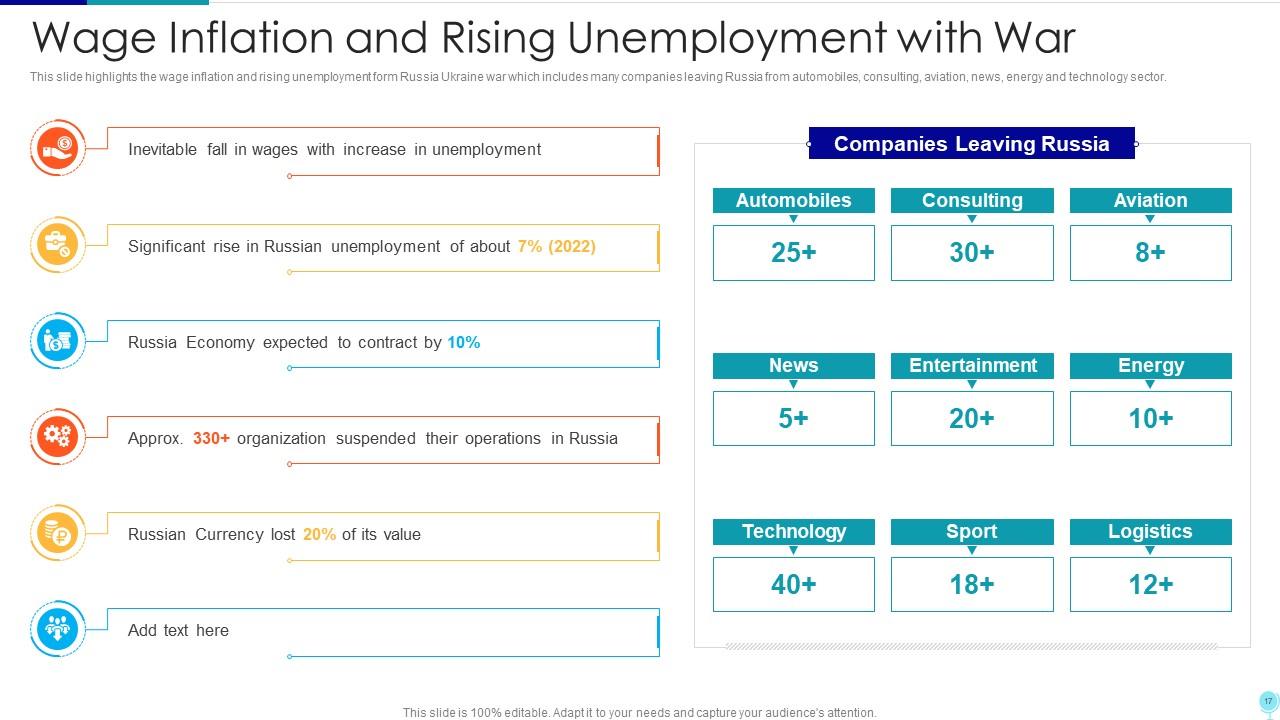
Use this slide to precipitate engaging conversations around the war in Ukraine and its broad-reaching impact on the financial stability of the world. The template draws out some critical data pertaining to unemployment, wage stagnation and GDP growth, tabulating these metrics in an elegant graph-like form that can be easy for users to understand. On the right hand side is a segment detailing the number of companies leaving Russia since the breakout of the war and the subsequent sanctions. This segment is arranged into smaller categories that cover areas such as automobile, aviation, technology, sports, etc. On the left hand side of the slide are significant data points highlighting some of the most pertinent ramifications of the war, such as the fall in wages, the contraction of the Russian economy, the impact on the Russian currency, etc.
Template 10
This final slide is focussed on projecting potential future scenarios that may arise from the war, and can be a great tool in strategic analysis for companies and organizations that seek to plan for the worst impacts of the war. The graph in this template has been segmented into minor subheadings such as sanctions, Russia impact, Europe impact and US impact, and records a series of potential scenarios that the war might bring about, such as ‘oil and gas keeps flowing, markets settle’ and ‘European gas supply halted, oil disrupted, risk-off shock’.
*****
WORLD CLOAKED IN UNCERTAINTY
The long-term consequences of the conflict in Europe have cloaked most of the world in uncertainty, leaving global economic trends to deviate from a stable post-covid recovery.
Click here to check out our other presentation that discusses the impact this war has had on the gas industry.
FAQs for Russia Ukraine War Impact On Global Inflation
The Russia-Ukraine conflict drives inflation through disrupted energy supplies, wheat and fertilizer shortages, supply chain interruptions, and increased defense spending across nations. These factors create cascading effects throughout global markets, with energy-dependent industries, food producers, and manufacturing sectors experiencing significant cost pressures, ultimately delivering higher consumer prices and forcing central banks to balance growth concerns with inflation control.
The Russia-Ukraine war has severely disrupted global supply chains through energy shortages, grain export blockades, semiconductor material constraints, and shipping route diversions, creating widespread bottlenecks across manufacturing and agriculture. These disruptions have triggered inflationary pressures differently across regions, with Europe experiencing energy-driven inflation, emerging markets facing food security challenges, and developed economies managing supply-cost increases, ultimately forcing businesses to reassess supplier diversification strategies and supply chain resilience.
The Russia-Ukraine conflict has dramatically increased energy prices through supply disruptions, sanctions on Russian oil and gas, and market speculation, creating significant inflationary pressures worldwide. These elevated energy costs cascade through entire economies, affecting transportation, manufacturing, and heating expenses, with many countries finding that reduced energy imports from the region ultimately deliver higher consumer prices and operational challenges across industries.
Ukraine serves as a major global grain supplier, contributing approximately 10% of world wheat exports, 15% of corn exports, and significant sunflower oil production, making it crucial for global food security. Disruptions to these agricultural exports drive up commodity prices worldwide, contributing to food inflation that particularly affects developing nations dependent on grain imports, ultimately creating broader inflationary pressures across interconnected global markets.
Central banks have responded to war-driven inflation through aggressive interest rate hikes, quantitative tightening, and enhanced forward guidance to anchor expectations. The Federal Reserve, ECB, and Bank of England have implemented coordinated monetary tightening while balancing growth concerns, with many institutions finding that strategic communication and targeted interventions help manage market volatility effectively.
Energy, food production, fertilizers, metals, and transportation face the highest inflationary pressures due to supply chain disruptions and commodity dependencies on the conflict region. These sectors experience cascading effects, with energy costs driving transportation expenses higher, fertilizer shortages impacting agricultural yields, and metal scarcities affecting manufacturing, ultimately delivering widespread price increases across interconnected global markets.
Consumer sentiment has declined significantly worldwide as inflation from geopolitical tensions creates uncertainty about future purchasing power, employment stability, and economic recovery timelines. This shift manifests through reduced discretionary spending, delayed major purchases, and increased savings rates, with many consumers in developed economies finding that strategic budget reallocation and value-focused purchasing decisions help navigate increasingly volatile economic conditions.
Countries heavily reliant on Russian and Ukrainian imports face prolonged inflationary pressures affecting energy, food, and fertilizer costs, with economists predicting elevated inflation rates persisting through 2025-2026. Many European nations and developing economies are finding that diversifying supply chains, while strategically necessary, initially increases costs before delivering long-term price stability and reduced geopolitical risk exposure.
The Russia-Ukraine conflict has significantly heightened inflationary expectations across major economies, with central banks from the Federal Reserve to the European Central Bank revising forecasts upward amid persistent energy and food price pressures. This has created a complex wage-price spiral dynamic, with many developed economies experiencing accelerated wage growth as workers demand compensation for rising living costs, while emerging markets face constrained wage growth despite higher inflation, ultimately reshaping monetary policy approaches globally.
Countries are diversifying energy sources through renewable investments, alternative supplier partnerships, liquefied natural gas imports, nuclear expansion, and domestic production increases in response to supply disruptions. While these strategic transitions initially drive higher energy costs and infrastructure investments that contribute to near-term inflation, they ultimately deliver greater energy security, price stability, and reduced dependency on volatile geopolitical regions, with many nations finding that diversified energy portfolios provide long-term economic resilience.
**INPUT**: What technological innovations could help mitigate inflationary pressures linked to shortages caused by shortages caused by the war? **OUTPUT**: Technological innovations include supply chain automation, predictive analytics, alternative protein production, renewable energy systems, and digital payment platforms. These technologies streamline operations by enhancing logistics transparency, optimizing resource allocation, and reducing dependency on traditional supply routes, with many organizations finding that strategic technology adoption delivers cost efficiencies and competitive advantage. **Word count: 54 words**
The war disproportionately impacts developing economies through higher food and energy import costs, currency devaluations, and limited fiscal buffers to absorb shocks. While developed nations experience moderate inflation increases, emerging markets like those in Africa and Asia face severe price pressures on essential goods, ultimately widening economic disparities and threatening social stability.
Historic conflicts demonstrate that supply chain disruptions, energy price volatility, and fiscal stimulus typically drive inflationary pressures through reduced production capacity, increased government spending, and resource reallocation toward defense sectors. Policymakers can mitigate these effects by diversifying supply sources, maintaining strategic reserves, and implementing targeted rather than broad-based stimulus measures, with many central banks finding that early intervention prevents entrenched expectations.
Multinational companies are implementing dynamic pricing models, geographic price differentiation, selective product portfolio adjustments, and strategic cost absorption to manage war-driven inflation. Many corporations in automotive, technology, and consumer goods sectors are regionalizing pricing structures while leveraging automation and supply chain diversification, ultimately maintaining market competitiveness and protecting profit margins.
Inflation in developed nations creates capital flight from emerging markets, currency devaluations, higher import costs, and reduced foreign investment flows. These ripple effects particularly impact countries dependent on commodity imports or foreign financing, with many emerging economies finding that rising borrowing costs and weakened currencies ultimately compound domestic inflationary pressures and economic instability.
-
“Superb. What a great finding. Thankful for SlideTeam. We were paying people to make slides which went all in vain. We are so happy to have found you.”
-
Eye-catching PPT designs, outstanding team, and best customer service. I’m a super satisfied customer here!