


Sales Order Fulfillment Dashboard With Product Value





Try Before you Buy Download Free Sample Product
 Impress Your
Audience
 100%
Editable
 Save Hours
of Time


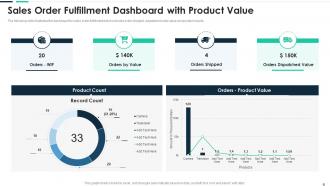
The following slide illustrates the dashboard for sales order fulfillment which includes order shipped, dispatched order value and product counts.
People who downloaded this PowerPoint presentation also viewed the following :
Sales Order Fulfillment Dashboard With Product Value with all 7 slides:
Use our Sales Order Fulfillment Dashboard With Product Value to effectively help you save your valuable time. They are readymade to fit into any presentation structure.






FAQs for Sales Order Fulfillment Dashboard
Honestly, just track what matters - order fulfillment rate and on-time delivery are huge. Processing time too. Inventory turnover shows if you're not sitting on dead stock forever. I'd add shipping costs per order and backorder levels since those bite you in the ass if ignored. Order accuracy is massive - customers lose their minds over wrong shipments, trust me. Customer satisfaction scores tie it all together nicely. Maybe throw in some trend stuff so you can see patterns developing. Just make sure whatever you pick matches what your boss actually gives a damn about, you know?
So basically, this dashboard shows you what's happening with all your orders in real time. You can see which ones are stuck somewhere in the process or delayed in shipping. Super helpful for catching problems before they blow up into bigger issues. Honestly, it's kind of like having superpowers for your operations - you just know what's going on everywhere. Resource planning becomes way easier too. My advice? Pick your 3 biggest headaches first and track those. You can always add more stuff later once you get the hang of it.
Dude, real-time data is a game changer. You can spot problems before customers even know something's wrong. Last quarter we had this massive warehouse backup and I felt so stupid finding out after the fact. Now I watch inventory levels and shipping stuff live on the dashboard. When things go sideways, you can actually call customers first, maybe reroute orders, whatever. Set up alerts for the big stuff though - you don't want to be glued to your screen all day. Fresh data means you can fix things instead of just apologizing later.
Here's my rewrite: Honestly, get a dashboard - it'll show you exactly where orders are stuck in real time. Way better than hunting through endless spreadsheets (trust me on this one). You can see processing times, inventory hiccups, shipping delays, all laid out visually. When picking suddenly takes forever or specific products keep causing problems, those charts make it super obvious. Short sentences work great here. Set up alerts for important thresholds so you catch issues early before they turn into total disasters. The visual aspect really makes patterns jump out at you.
Honestly, I'd start simple with bar charts for order volumes by status - they're clean and everyone gets them instantly. Line graphs work great for spotting trends over time. You'll probably want tables too since your team will need to dig into specific order details. Funnel charts are perfect for showing the fulfillment pipeline flow. Heat maps might seem random but they're actually clutch if you're tracking stuff across different regions or product lines - patterns just jump out at you. Really though, pick 2-3 core charts first. You can always add more later if it actually helps your workflow instead of just looking fancy.
Dude, integration totally transforms your dashboard - like, instead of just showing reports, it becomes this live command center that's actually useful. Connect it to your ERP, CRM, warehouse systems and boom - real-time inventory updates, orders that change status automatically, customer data that finally syncs right. No more of that tedious manual entry stuff! Honestly, the accuracy improvement alone makes it worth it. Plus you can set alerts for when orders get stuck or you're running low on stock. Everything just flows between systems so your team isn't juggling five different platforms all day (which is honestly the worst). I'd start with whatever system is most critical and build from there.
Honestly? Data integration is gonna be your worst nightmare. All your stuff is scattered - CRM here, inventory there, shipping somewhere else - and making them talk to each other sucks. Plus everyone wants different metrics on the dashboard, which gets messy fast. Performance issues hit hard too if you're not smart about pulling real-time data. Oh, and people get super picky about which KPIs matter most to them. Start with the basics that everyone actually uses. Build from there once you know what people really want, not what they think they want.
So your dashboard basically pulls together customer feedback and shipping data in one spot. Pretty handy, honestly. You can see delivery times and order accuracy right next to satisfaction scores and complaints. The cool part? You'll notice trends like how delayed shipments tank your NPS ratings. It also connects stuff like damage reports to specific fulfillment centers - makes it super easy to figure out which locations are screwing things up. I'd use this to decide what fulfillment problems need fixing first.
Check your order-to-fulfillment cycle times first - that's where the good stuff usually hides. Don't just look at yesterday's numbers though. Compare against your historical averages and what everyone else in your industry is doing. Backorder spikes or sudden fill rate drops? Those are red flags for upstream supply issues before they blow up. Oh, and definitely break the data down by product category and region too. Aggregate numbers lie all the time. The real trick isn't just monitoring where you're at right now - it's spotting trends early so you can actually do something about them.
So predictive analytics basically gives you a heads-up on demand spikes and potential shipping disasters before they actually happen. It looks at your historical data, carrier performance, all that stuff to flag orders that might be late. Honestly, it's pretty sweet - like having a logistics crystal ball or whatever. You can spot stockouts coming and adjust your inventory ahead of time. The demand forecasting part is clutch for buying decisions too. Just set up alerts for risky orders and you're golden. Way better than scrambling when things go sideways.
Look, your sales dashboard has to be stupid simple or people won't use it. I've watched entire teams ditch dashboards that worked fine but were too messy to navigate when they're stressed. Quick decisions happen when everything's obvious - order status, shipping problems, inventory stuff should jump out immediately. Clean design beats flashy features every time. Honestly, if someone can't figure it out in like 5 seconds, you've already lost them. Group things logically and make urgent orders impossible to miss. The best dashboard is the one your team actually opens when things get crazy.
First thing - double-check your source connections and make sure those ETL processes aren't wonky. Set up automated quality checks to catch weird stuff like missing customer data or negative quantities (seriously, why does that always happen?). I'd cross-reference your key metrics with the ERP system pretty regularly. Build in some data lineage tracking so when things break, you can actually find where. Oh, and set up alerts for data freshness - nothing worse than stale data. Create a quick validation checklist your team can run weekly. Refresh schedules should match what the business actually needs, not just what's convenient.
Start simple - set up alerts for orders stuck in processing past your SLA and inventory hitting safety stock. Late shipments are clutch because angry customers will blow up your phone otherwise. Payment failures need alerts too, obviously. Watch for volume spikes that'll crush your fulfillment team and orders missing shipping info (those always cause headaches later). Don't go overboard though - too many notifications and you'll just ignore them all. Pick maybe 3-4 types first, then add more once you see what's actually breaking.
Dude, you gotta dig into your historical data - it's seriously a game changer. Look at the past 12-18 months and you'll start seeing patterns everywhere. Seasonal rushes, those annoying bottlenecks that happen every damn time, products that always mess up your timeline. Once you spot these trends, you can actually plan ahead instead of scrambling. Pull last year's numbers and compare month by month. I'd focus on order volumes, delivery times, customer complaints - the usual suspects. Honestly, it's probably the closest thing to predicting the future without being psychic.
Honestly, I'd go React or Vue for the frontend - they're solid for real-time stuff and won't break when you scale up. Node.js works great with either, though I've worked with teams who swear by Python/Django (totally valid too). You'll definitely want WebSockets or Server-Sent Events for those live data feeds. Oh, and don't forget decent charts - D3.js is powerful but Chart.js might be easier to start with. My take? Just begin with React + Node.js and see how it feels. You can always pivot later if needed.
-
The templates are the best in class. Very clear and innovative graphics! I am excited to explore and download more presentations.
-
I am so thankful for all of the templates I've found on your site. They have saved me hours every week and helped make my presentations come alive. Keep up with these amazing product releases!