


Stock portfolio management powerpoint presentation slides






Try Before you Buy Download Free Sample Product
 Impress Your
 Audience
 100%
100% Editable
 Save Hours
 of Time


By and large all companies regularly expand their portfolio. However, portfolio management process is required to ensure that whether company resources are in apt use or not? Here if you are not sure form where to start, then we can help. We have pre designed this PPT sample file to present portfolio analysis in an engaging manner. Additionally, this PPT slide show also acts as a portfolio management tool for improved resource allocations as well as to cast spotlight on various portfolio risks. All in all, to comprehensively address project portfolio issue we have included PowerPoint slide themes of investment objectives, risk tolerance analysis, asset allocation, target modeling, financial planning etc. In short, portfolio managers can download this PowerPoint show to bring transparency and improved balance of work in operations of a company. With this presentation deck they can thoroughly discuss and deliver well customized investment solutions for a company thereby minimizing its risks.
People who downloaded this PowerPoint presentation also viewed the following :
Content of this Powerpoint Presentation
Slide 1: This slide introduces Stock Portfolio Management. Add your company name to get started.
Slide 2: This is an Agenda slide with text boxes. State your agendas here.
Slide 3: This is an About Us slide. State company or team specifications, information etc. here.
Slide 4: This is Our team slide with names and designation.
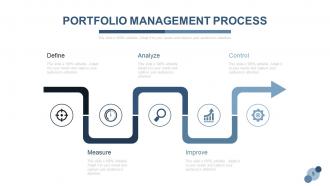
Slide 5: This slide showcases PORTFOLIO MANAGEMENT PROCESS in a creative flow diagram.
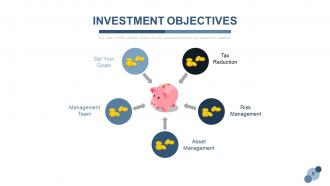
Slide 6: This slide states Investment Objectives which include- Asset Management, Management Team, Risk Management, Set Your Goals, Tax Reduction.
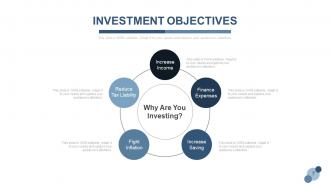
Slide 7: This slide states Investment Objectives in a circular image form. It shows- Finance Expenses, Increase Saving, Fight Inflation, Increase Income, Reduce Tax Liability.
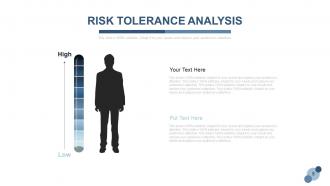
Slide 8: This slide presents Risk Tolerance Analysis in people silhouettes and text boxes to go with.
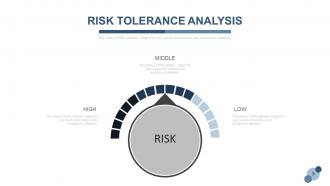
Slide 9: This slide also presents Risk Tolerance Analysis with High, Medium and Low parameters.
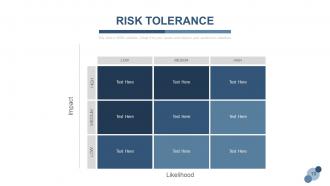
Slide 10: This slide showcases Risk Tolerance in a matrix form with Impact and LIkelihood as its parameters.
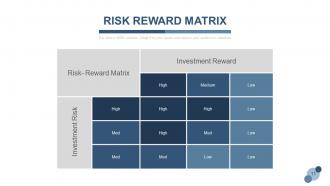
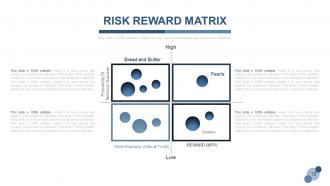
Slide 11: This slide presents Risk Reward Matrix. Use it as per need.
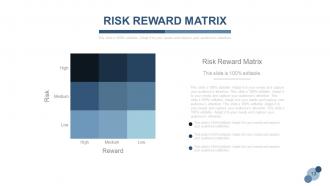
Slide 12: This slide also showcases Risk Reward Matrix. Use it to show your own information.
Slide 13: This too is a Risk Reward Matrix slide with High, Medium and Low parameters.
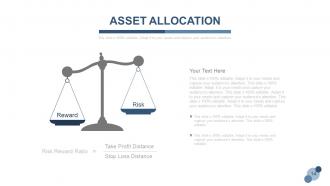
Slide 14: This is Asset Allocation slide with balancing scale imagery. Use it to show your company assets etc.
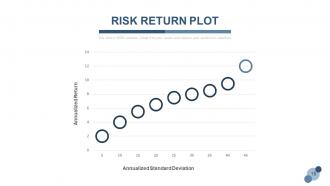
Slide 15: This slide shows Risk Return Plot in a chart/ graph form.
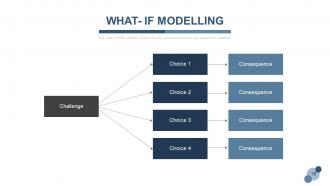
Slide 16: This is a WHAT- IF MODELLING slide with text boxes. Use it to state your Choice and Consequences here.
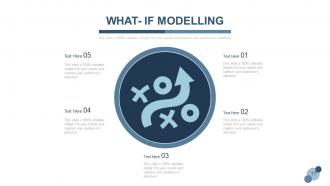
Slide 17: This is also a WHAT- IF MODELLING slide with circular imagery and text boxes.
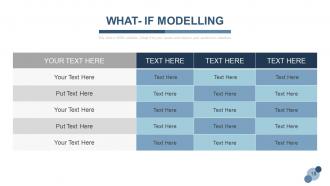
Slide 18: This too is a WHAT- IF MODELLING slide in a tabular form.
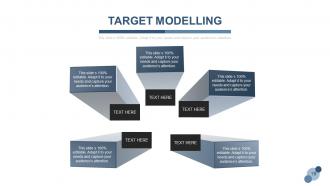
Slide 19: This slide states Target Modelling with text boxes.
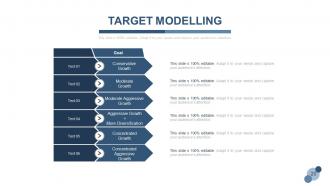
Slide 20: This slide also shows Target Modelling with- Goal, Conservative Growth, Moderate Growth, Moderate Aggressive Growth, Aggressive Growth + More Diversification, Concentrated Growth, Concentrated Aggressive Growth.
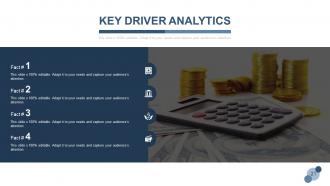
Slide 21: This slide states Key Driver Analytics with imagery. State your facts etc. here.
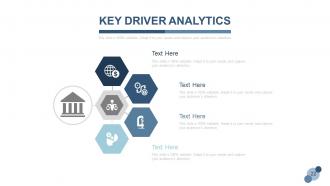
Slide 22: This slide also presents Key Driver Analytics with icons and text boxes.
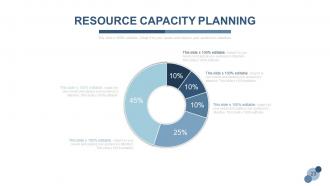
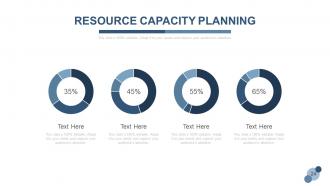
Slide 23: This slide displays Resource Capacity Planning in a pie chart/ graph form.
Slide 24: This slide also shows Resource Capacity Planning in a pie chart/ graph form.
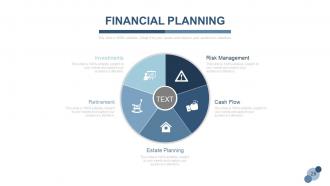
Slide 25: This is Financial Planning slide in a circular form with icons and text boxes. It consists of the following- Estate Planning, Cash Flow, Retirement, Risk Management, Investments.
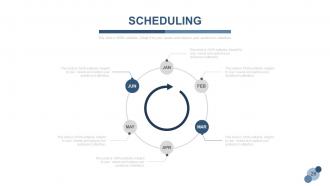
Slide 26: This slide shows Scheduling in a circular form.
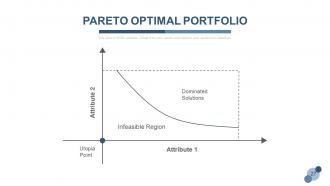
Slide 27: This is Pareto Optimal Portfolio slide in a chart/ graph form.
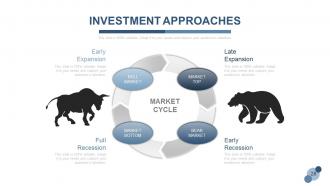
Slide 28: This slide shows Investment Approaches with respect to MARKET CYCLE. It has the following 4 stages- Early Expansion, Late Expansion, Full Recession, Early Recession.
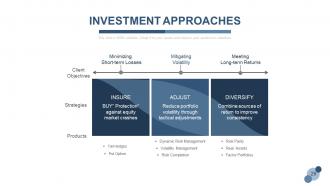
Slide 29: This slide also states Investment Approaches.
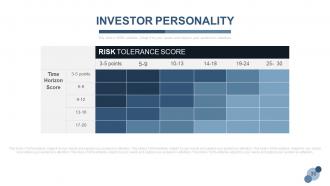
Slide 30: This slide shows Investor Personality with Risk Tolerance Score.
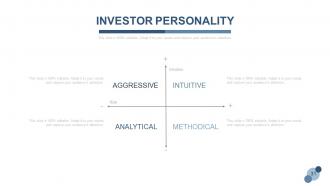
Slide 31: This slide also shows Investor Personality in a matrix form.
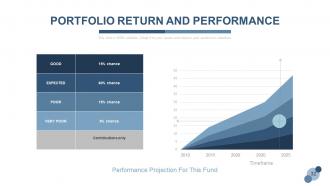
Slide 32: This slide depicts Portfolio Return And Performance with a Timeframe.
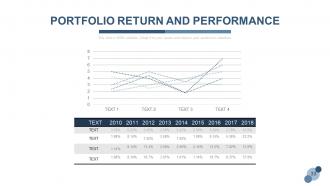
Slide 33: This slide also shows Portfolio Return And Performance in a line chart/ graph form.
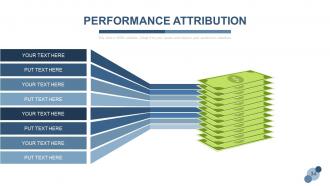
Slide 34: This slide states Performance Attribution with creative imagery and text boxes.
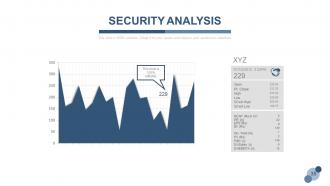
Slide 35: This slide shows Security Analysis.
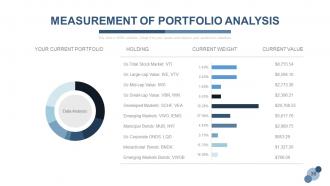
Slide 36: This slide shows Measurement Of Portfolio Analysis in charts and graphs.
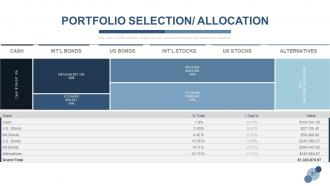
Slide 37: This is Portfolio Selection/ Allocation slide.
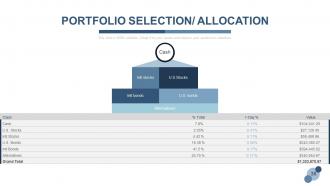
Slide 38: This too is a Portfolio Selection/ Allocation slide.
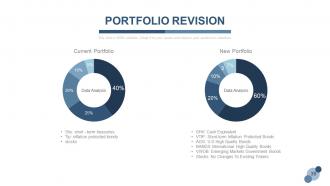
Slide 39: This slide shows Portfolio Revision in a pie chart/ graph form.
Slide 40: This too is a Portfolio Revision slide in charts and graphs.
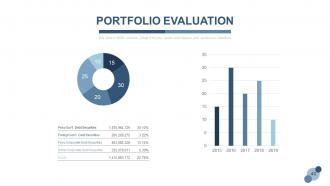
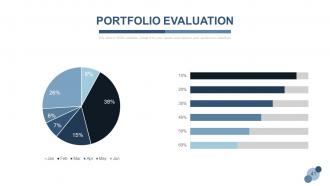
Slide 41: This slide presents Portfolio Evaluation in charts and graphs.
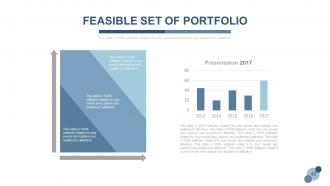
Slide 42: This slide shows Feasible Set Of Portfolio in a bar graph/ chart form.
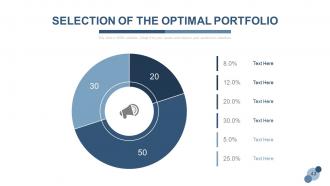
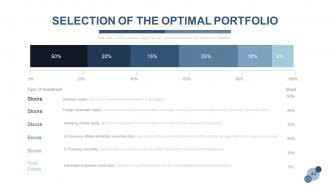
Slide 43: Thi is Selection Of The Optimal Portfolio slide in a pie chart/ graph form.
Slide 44: This slide also shows Selection Of The Optimal Portfolio.
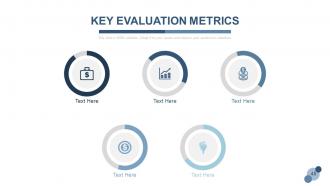
Slide 45: This slide showcases Key Evaluation Metrics with text boxes to state.
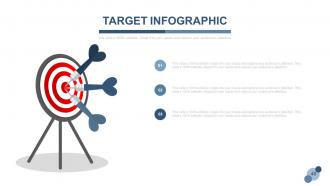
Slide 46: This is a Target Infographic slide with relevant imagery.
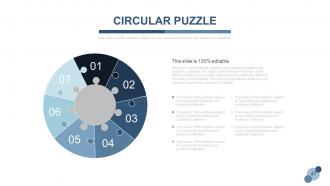
Slide 47: This is a Circular Puzzle image slide. State information etc. here.
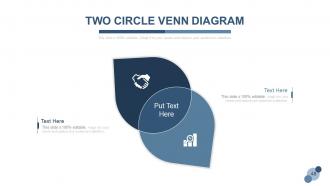
Slide 48: This slide shows Two Circle Venn Diagram to state information, specifications etc.
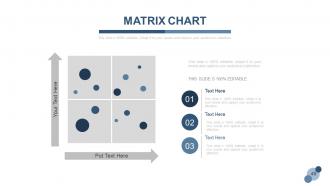
Slide 49: This is a Matrix Chart slide with text boxes. Use it as per your requirement.
Slide 50: This is a Lego Block image slide to state information, specifications etc.
Slide 51: This is Business Team slide in people silhouettes. Use it to show business/ team related information, specifications etc.
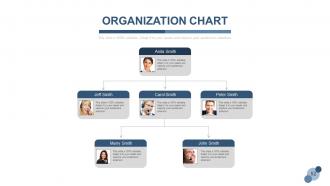
Slide 52: This is an Organization Chart slide with name and designation. Use it to show the hierarchy of your organization.
Slide 53: This is Bulb With Brain image slide to state information, specifications etc.
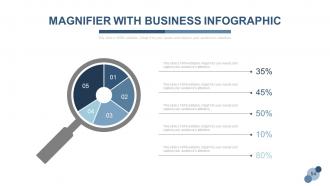
Slide 54: This is Magnifier With Business Infographic slide to state information, specifications etc.
Slide 55: This is a Bar Graph image slide to show product comparison, growth etc.
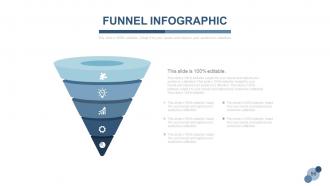
Slide 56: This is a Funnel Infographic slide to show anything in a funnel form.
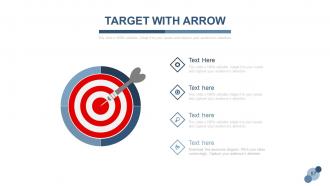
Slide 57: This is Target With Arrow image slide. State your targets etc. here.
Slide 58: This is a Comparison Chart slide to compare two products/ entities etc.
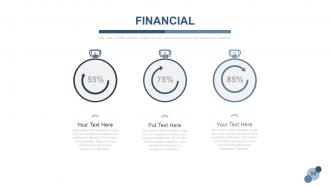
Slide 59: This is a Financial score slide. State financial aspects etc. here.
Slide 60: This is a Quotes slide to convey messages, beliefs etc. You can change the slide content as per need.
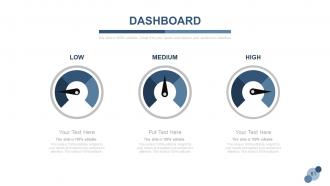
Slide 61: This is a Dashboard slide to state metrics, kpis etc.
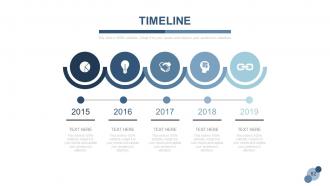
Slide 62: This is a Timeline slide to show evolution, growth, milestones etc.
Slide 63: This is Our Mission slide. State company mission here.
Slide 64: This is a Newspaper Layouts slide to show news, events, etc. You can change the slide contents as deemed fit.
Slide 65: This is Two Tags For Pros And Cons Darts slide. State company pros and cons here.
Slide 66: This is a Thank You slide for acknowledgement.
Stock portfolio management powerpoint presentation slides with all 66 slides:
Get away from the chaos with our Stock Portfolio Management Complete Powerpoint Deck With Slides. Arrange your thoughts in a calm environment.












FAQs for Stock portfolio management
Look, it really comes down to three big things: spread your money around, manage your risk, and don't be stupid with timing. I always tell people to diversify across different sectors - that whole eggs in one basket thing is real. Index funds are your friend because they're cheap. Set some goals and rebalance when stuff gets out of whack, maybe once a year or so. The hardest part? Not freaking out when everything tanks or chasing whatever stock is hot that week. Just invest consistently and think years ahead, not months. Honestly, most people overthink this way too much.
So basically diversification means you're spreading your money across different stocks and sectors instead of going all-in on one thing. Yeah, you might miss out on some crazy gains if that one stock you didn't buy goes to the moon. But you also won't lose everything if something tanks hard. It's honestly just about finding what you're comfortable with - some people can handle the stress, others can't. I'd probably start with like 15-20 different stocks across various industries. That way you get decent protection without going overboard with it.
So asset allocation is just how you divide up your investment money between stocks, bonds, and cash - basically your game plan. Most of your returns actually come from this split, not from picking amazing individual stocks (which honestly surprised me when I first learned it). Young people usually load up on stocks since they've got decades to ride out the ups and downs. Getting closer to retirement though? You'll want more bonds for that stability. Oh, and you gotta rebalance every so often or your portfolio gets all out of whack from whatever's been performing well.
Track your total return first - that's gains plus dividends vs what you put in. Compare it to the S&P 500 because honestly, most people think they can beat it but can't. Calculate your Sharpe ratio too, which shows if your returns are worth the risk you're taking. I just use a basic spreadsheet and update it monthly - nothing fancy. Oh and don't stress about making it perfect right away. The key is staying consistent with tracking this stuff.
Track your total return first - that's price gains plus dividends. Compare it against the S&P 500 or whatever sector your stock's in. P/E ratio tells you if you're overpaying, and revenue/earnings growth shows if the company's actually doing well. Beta measures how crazy volatile it gets (some stocks are just exhausting lol). Also watch how much of your portfolio each stock takes up - don't let one position get too huge. I throw everything in a spreadsheet and check monthly. Catches problems early before they wreck you.
Market conditions totally change how I pick stocks. Bull markets? I go heavier on growth plays since most stuff is moving up anyway. When things get ugly in bear territory, defensive stocks and dividend payers become my best friends - companies that won't crater when everyone's panicking. Sideways markets are honestly such a pain though. You're basically hunting for value picks that can move on their own merit instead of riding the wave. I always end up tweaking my risk appetite depending on what cycle we're in. The sector rotation game becomes way more important too.
Honestly, I'd rebalance every 6-12 months or whenever something drifts 5-10% from where you want it. Set up calendar reminders though - trust me on this one. During 2020 I kept procrastinating and it bit me in the ass! The whole point is selling what's doing well and buying what's lagging to get back to your target percentages. Oh, and try doing it in your 401k or IRA first since you won't get hit with capital gains taxes. Seriously though, set those reminders right now or you'll totally forget like I always do.
Okay so financial ratios are honestly your best friend for stock picking. P/E ratios tell you if something's overpriced compared to earnings. Then I always check debt-to-equity - you don't want companies drowning in debt, right? ROE is huge because it shows how well they're using shareholder money. Profit margins are clutch too since they reveal how efficiently a company runs. Here's the thing though - you've gotta compare within the same industry because tech vs utilities will look completely different. Just throw these into a basic spreadsheet and update quarterly. Way easier than you'd think.
You know what gets people? Loss aversion and confirmation bias - basically you'll hold losers too long and only read stuff that backs up what you already think. Fear makes you panic sell at the bottom. Greed has you chasing whatever's hot at exactly the wrong time. I swear, some of the smartest people I know have blown up their accounts because they fell in love with a stock. Oh, and recency bias is brutal - you think last month's winners will keep winning forever. Set your rules beforehand for buying and selling, then actually stick to them when emotions kick in.
Dude, taxes totally change how you think about your portfolio. Hold your winners for at least a year - long-term capital gains are so much better than short-term rates. You can sell losers to offset those gains too, which is pretty smart. Honestly, timing becomes everything. Sometimes I'll wait like 3 extra weeks just to hit that one-year mark, even if it feels annoying. Tax-loss harvesting can really add up over the years. Just don't get so obsessed with tax stuff that you make dumb investment choices, you know?
For tracking your portfolio, I'd start with the free stuff - Yahoo Finance and Morningstar are solid. Google Finance works too but honestly feels a bit basic. Personal Capital's great if you want the bigger picture of all your accounts in one place. Bloomberg Terminal exists but that's like buying a Ferrari to drive to the grocery store. I actually just use a spreadsheet with Yahoo Finance data - probably sounds boring but you can customize everything exactly how you want. Mint's decent for general wealth tracking. Try the free options first since you might realize you don't need all the fancy bells and whistles.
Look, they're both useful but in different ways. Technical analysis is great for timing - like figuring out when to actually buy or sell based on price patterns and what the market's doing. Fundamental analysis is more about digging into company financials to see what stuff is actually worth long-term. Honestly, I'm more of a fundamentals person myself, but combining both gives you way better info. I'd say pick whichever one makes more sense to you first, then maybe add in some tools from the other approach once you get the hang of it. Works better than trying to learn everything at once.
So first thing - figure out where that sector is in its cycle and if it's actually growing. Don't just throw money at the three biggest names either, you'll want some variety even within one space. Look at the fundamentals like revenue growth and who's got real competitive moats. Regulatory stuff can bite you (learned that the hard way with healthcare stocks), so factor that in. Check if valuations are crazy compared to historical averages. Honestly, the biggest thing is having a solid reason you're betting on that sector and knowing when you'd bail if things change.
Honestly, I just watch the big economic stuff and adjust from there. Strong GDP + low unemployment? That's when I go heavier on growth stocks. Inflation's the tricky one though - when it starts climbing, tech gets hammered and value stocks look better. But rates are what really move things. Fed even hints at a hike and financials jump while REITs tank. I learned this the hard way last year, actually. Now I just keep an economic calendar handy and try not to get caught off guard. You don't need to overthink it - just have some kind of plan ready.
Dude, having too much in one stock is basically gambling with your future. When that company inevitably hits a rough patch, your whole portfolio gets wrecked. I watched my neighbor lose like 60% when his Tesla obsession backfired in 2022 - brutal to witness. You're missing out on other sectors doing well while being glued to one company's drama. Management screws up? You're toast. Industry tanks? Also toast. Honestly, anything over 5-10% in a single stock makes me nervous. Start selling chunks gradually so you don't hate yourself later.
-
Design layout is very impressive.
-
Easily Understandable slides.