Trading Company Flow Chart With Purchase Quotation
Try Before you Buy Download Free Sample Product
Audience
Editable
of Time
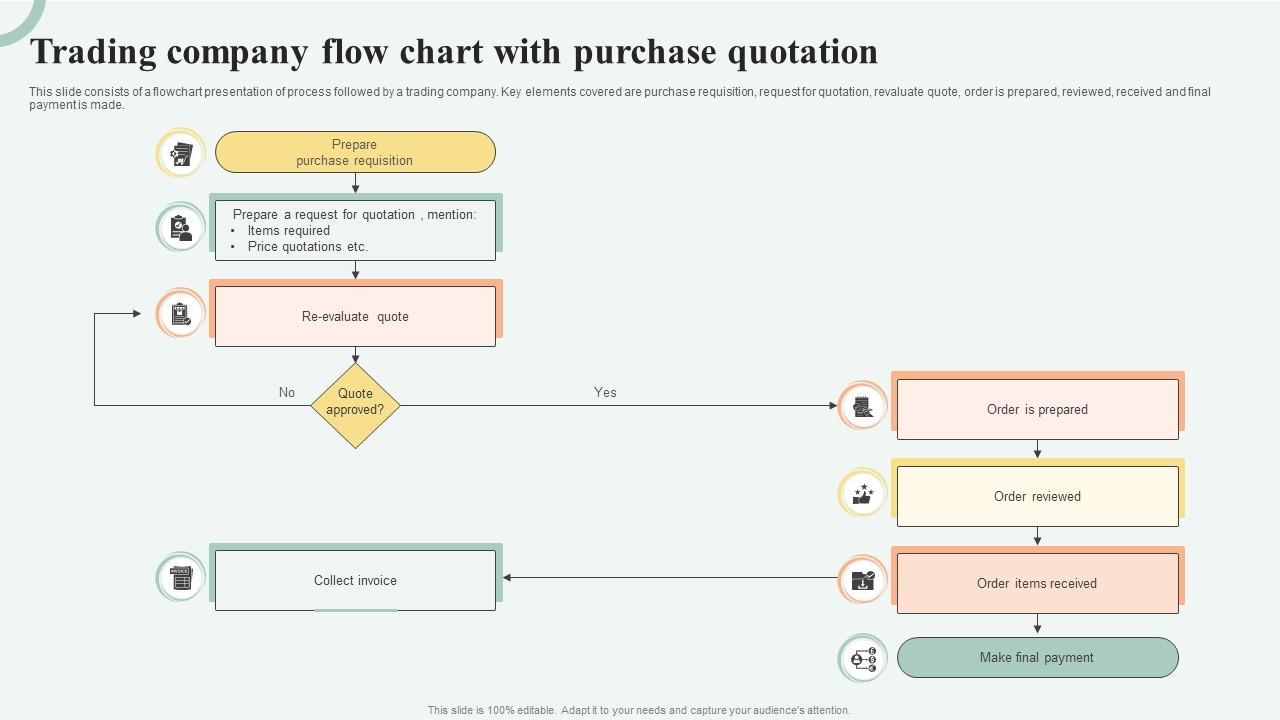
This slide consists of a flowchart presentation of process followed by a trading company. Key elements covered are purchase requisition, request for quotation, revaluate quote, order is prepared, reviewed, received and final payment is made.
People who downloaded this PowerPoint presentation also viewed the following :
Trading Company Flow Chart With Purchase Quotation with all 6 slides:
Use our Trading Company Flow Chart With Purchase Quotation to effectively help you save your valuable time. They are readymade to fit into any presentation structure.
FAQs for Trading Company Flow Chart
So for your trading company flowchart, start with the basics: procurement, inventory, sales/marketing, order processing, and shipping. Basically map out how stuff goes from "we need to buy this" to "customer has it and paid us." Run your financial stuff parallel - payments, invoicing, cash flow. Quality control checkpoints are crucial too, plus all those supplier/customer touchpoints. Honestly, I'd sketch your current process first. Then hunt down where things get stuck - those bottlenecks need the most detail in your chart. Makes the whole thing way more useful.
Honestly, flow charts are game-changers for trading ops. Instead of juggling everything mentally, you get this visual map of how procurement talks to logistics, how sales connects to finance - all that messy stuff we deal with daily. Makes it super obvious where things get stuck or where you're doing duplicate work. New hires actually thank me for these because they don't have to guess what happens next. Oh, and here's the thing - even processes you think you know inside out will surprise you once you map them. Pick something you do every day and just start sketching it out.
So basically you want everything connected - your ERP talking to your CRM, logistics platforms sharing data, that whole thing. Real-time tracking is a game changer for shipments and inventory. AI can actually predict demand patterns which honestly blew my mind when I first saw it work. Manual handoffs are probably killing you right now (they kill everyone). Start by mapping where those bottlenecks happen. Purchase orders should be automated if they aren't already. The trick isn't having fancy tools - it's making sure they actually work together instead of creating more headaches.
Dude, flow charts are honestly game-changers for spotting bottlenecks. You can see exactly where orders get stuck or which team is dragging their feet. Like, maybe accounting takes forever to approve stuff while shipping sits around waiting. The visual thing really helps - suddenly you notice how one slow step screws up everything downstream. I'd time each process step first, then tackle your worst bottleneck. Oh and check it monthly because things change. It's basically like having a map of all your operational traffic jams, if that makes sense.
So first thing - map out your main workflow: order entry, risk checks, execution, settlement. Don't overcomplicate it though, I've seen some charts that look like someone threw spaghetti at a wall. Focus hard on those handoffs between front office and ops, that's where stuff usually gets messy. Make sure you're showing approval points clearly, especially for limit breaches. Oh and definitely test it with real users before you call it done. Exception handling is huge too - like 90% of trading breakdowns happen there. Use symbols people actually understand, not some weird internal code nobody remembers.
Honestly, flow charts are a game changer for getting everyone on the same page with trading processes. Instead of trying to explain complex workflows verbally (which never works), you've got this visual map everyone can follow. New traders pick things up way faster, and compliance people actually understand what we're doing. When something goes wrong, you can point to exactly where it broke down - saves so much time in those post-mortem meetings. They also make you think through weird edge cases you'd probably miss otherwise. I'd start with whatever process is causing the most headaches right now and map that out first.
Honestly, I'd go with Lucidchart or Draw.io (they renamed it to diagrams.net but whatever). Both have solid business templates and work great for process stuff. Real-time collaboration on Lucidchart is pretty sweet if your team needs that. Visio's decent if you already have Microsoft licenses, but it feels outdated compared to browser-based tools. Draw.io is completely free so that's where I'd start. You can always switch later if you need fancier features. Oh, and Google Drawings actually works for basic flowcharts if you just need something quick.
Build your flow chart with modular blocks instead of rigid pathways - trust me on this one. Add decision points that can handle new compliance stuff easily. Drop in placeholder nodes for "regulatory review" steps you can expand later. GDPR absolutely wrecked our system because we didn't do this initially! Version control is clutch for tracking changes during audits. The goal is plugging in new approval stages without rebuilding everything from scratch. Honestly, it's way less painful than starting over every time regulations shift.
Honestly, the worst thing you can do is overcomplicate it from day one. I've watched so many people try mapping out every single step and detail - total nightmare. Keep your first version super basic. Also, don't use wimpy labels like "process order" without actually explaining what happens. Test it with real users before you think you're done (learned this the hard way). Oh, and be realistic about timing - nobody wants your fantasy best-case scenario timeframes. Start simple, get feedback from your team, then slowly add the complicated stuff. Way better approach.
So basically you map out your whole trade process step by step, and it shows you exactly where you need compliance checks. Documentation, licensing, regulatory stuff - it all becomes way clearer when you see the full workflow. Honestly saved my butt a few times spotting bottlenecks before they turned into violations. When auditors show up, you've got proof you actually follow a system instead of just winging it. My advice? Start with your current process first, then figure out what regulations apply to each step. Makes the whole thing less overwhelming.
Honestly, there's so much good stuff you can throw on those charts. Order volumes and processing times are obvious ones. Revenue flows too, duh. But I'd also track things like inventory turnover, profit margins by product, customer acquisition costs. Oh and operational metrics - fulfillment speeds, how your suppliers are performing, cost breakdowns at each step. The really useful part? You can overlay different metrics to catch bottlenecks you might've missed otherwise. My advice is start with whatever data you're already collecting anyway. Don't overcomplicate it - build something that'll actually help you spot problems and make better calls.
Flow charts are seriously clutch for onboarding - new hires can see exactly what's coming instead of constantly asking "what now?" Map out everything from day one setup to compliance stuff to meeting the key traders and risk folks. Trading's so fast-paced that any confusion about process just kills productivity. Honestly, seeing the whole journey upfront calms people down and gets them contributing way quicker. Oh, and definitely make different tracks for different roles - junior traders don't need the same path as settlements people, you know?
Flow charts are for showing step-by-step processes with all those decision points - you know, the diamond shapes we learned about ages ago. Perfect for mapping out your trading workflows or risk management stuff. Regular diagrams just show relationships or structures without the whole "if this happens, do that" logic. Like an org chart vs actually walking through how trades get executed. Honestly, I'd use flow charts when you need to document processes that have multiple paths. Diagrams work better for showing market connections or company hierarchy. Just think about whether you're explaining "how something flows" or "how things connect."
So basically you want arrows flowing backward from your outcomes to earlier steps. Like if your trade execution bombs, that info needs to loop back to your market analysis stage. I always use dotted lines for feedback - looks way cleaner than solid ones. Pick specific metrics at each stage that'll trigger these loops. Honestly, don't go crazy at first though. Just map out 2-3 feedback points to start. Your team can get overwhelmed otherwise. Once everyone's comfortable with those, then you can add more loops. The whole thing works better when you build it up gradually.
Honestly, your stakeholders are gonna save you so much headache here. Get traders, ops people, compliance, and IT involved early - they're the ones actually using these processes every day. They'll spot stuff you totally missed and tell you when something looks good on paper but sucks in real life. I learned this the hard way on my last project. Run drafts by each team before you finalize anything. Way better to get their input upfront than deal with everyone complaining later when you're trying to implement changes. Trust me, a pretty flowchart that doesn't work is basically useless.
-
Wonderful ideas and visuals. I'm really pleased with the templates, which are unique and up to date.
-
The designs are very attractive and easy to edit. Looking forward to downloading more of your PowerPoint Presentations.