

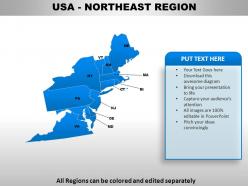
Usa northeast region country powerpoint maps





Try Before you Buy Download Free Sample Product
 Impress Your
Audience
 100%
Editable
 Save Hours
of Time


You don't have to blame the software if you make a poor presentation. Blame yourself for not heeding to advice and make use of our USA Northeast Region Country Powerpoint Maps.
People who downloaded this PowerPoint presentation also viewed the following :
Usa northeast region country powerpoint maps with all 30 slides:
Chisel away with our USA Northeast Region Country Powerpoint Maps. Give your thoughts the perfect shape.




FAQs for Usa northeast region
Northeast USA maps highlight geographical features including the Appalachian Mountains, Atlantic coastline, major river systems like the Hudson and Connecticut, and the Great Lakes region, alongside historical landmarks from colonial settlements and Revolutionary War sites. These maps showcase how natural harbors in Boston and New York facilitated early trade development, while mountain passes and river valleys shaped migration patterns, ultimately delivering strategic insights for understanding America's foundational economic and political development.
Topographic maps of the Northeast emphasize physical terrain features like the Appalachian Mountains, river valleys, elevation changes, and coastal formations, while political maps focus on state boundaries, cities, counties, and administrative divisions. These mapping approaches serve different purposes, with topographic maps enabling outdoor recreation planning, environmental analysis, and infrastructure development, while political maps streamline governance understanding and demographic studies across the region's diverse states.
Northeast USA maps showcase major transportation arteries including I-95, I-84, I-90, Amtrak's Northeast Corridor, and key airports like JFK and Logan International. These interconnected networks streamline commerce, enhance workforce mobility, and accelerate business operations across the Boston-Washington megalopolis, with many organizations finding that strategic location along these corridors delivers competitive advantages and operational efficiency.
Digital mapping technologies enhance Northeast USA's natural resource understanding by providing real-time data visualization, satellite imagery analysis, geographic information system integration, and predictive modeling capabilities. Through these advanced tools, environmental agencies, forestry departments, and mining companies can monitor timber reserves, water quality, and mineral deposits more accurately, while streamlining resource management decisions and ultimately delivering more sustainable extraction practices across the region's diverse ecosystems.
Geographic Information Systems (GIS) serve as the foundational technology for creating, analyzing, and maintaining Northeast USA maps by integrating spatial data, demographic information, infrastructure networks, and environmental factors into comprehensive digital platforms. These systems enable government agencies, urban planners, and businesses to visualize population density patterns, transportation corridors, and economic zones across the region, ultimately delivering enhanced decision-making capabilities and strategic planning advantages.
Tourism hotspots and recreational areas on Northeast maps are represented through distinctive symbols, color-coding, and specialized markers indicating national parks, ski resorts, beaches, historic sites, and cultural attractions. These visual elements enable tourism boards, travel companies, and hospitality businesses to strategically plan marketing campaigns, optimize visitor flows, and enhance customer experiences, ultimately delivering competitive advantage in the increasingly dynamic travel industry.
Key demographic trends in Northeast USA maps include urbanization concentration around major metropolitan areas, aging populations in rural regions, increasing diversity in suburban corridors, income disparities between urban cores and periphery areas, and educational attainment clustering near universities. These patterns reveal significant opportunities for businesses, healthcare providers, and educational institutions to strategically position services, with many organizations finding that demographic mapping enables targeted resource allocation and enhanced market penetration.
Climate maps illustrate the Northeast's environmental challenges by displaying temperature fluctuations, precipitation patterns, sea-level rise projections, and extreme weather frequencies across the region. These visualizations enable urban planners, environmental agencies, and businesses to identify vulnerable coastal areas, assess infrastructure risks, and develop adaptive strategies, ultimately delivering more resilient communities and informed policy decisions for climate preparedness.
Zoning maps, transportation network maps, demographic density maps, land use maps, and infrastructure maps are most effective for urban planning in Northeast cities. These maps streamline decision-making by revealing development patterns, population trends, and resource allocation needs, with many municipal planners finding that layered digital mapping ultimately delivers enhanced project efficiency and strategic urban development outcomes.
Educators can utilize Northeast USA maps to enhance geography literacy by incorporating interactive mapping exercises, state capital identification activities, regional climate comparisons, and historical migration pattern studies. Through hands-on projects like creating tourist brochures for specific states, analyzing population density distributions, and exploring economic corridors, students develop spatial reasoning skills while connecting geographical features to real-world applications, ultimately delivering stronger analytical abilities and regional awareness.
**INPUT**: What innovative mapping tools are available for visualizing the cultural diversity of the Northeast? **OUTPUT**: Innovative mapping tools for Northeast cultural diversity include demographic heat maps, interactive census visualization platforms, community asset mapping software, cultural landmark databases, and multilingual population overlays. These technologies enable organizations, educational institutions, and municipal planners to streamline community engagement strategies, enhance resource allocation decisions, and deliver more inclusive services, ultimately providing competitive advantages in increasingly diverse regional markets.
Historical maps reveal Northeast USA settlement evolution through changing transportation networks, urban expansion patterns, industrial development zones, and population density shifts over centuries. These cartographic records demonstrate how settlements initially clustered around harbors and rivers, then expanded along railroad corridors and highways, with modern maps showing suburban sprawl and metropolitan consolidation that reflects economic transitions from agriculture to manufacturing to service industries.
Mapping natural disaster zones in the Northeast enables emergency preparedness planning, resource allocation optimization, and risk assessment accuracy across coastal and inland communities. These comprehensive mapping systems help municipalities, insurance companies, and infrastructure planners identify vulnerable areas, streamline evacuation procedures, and enhance response coordination, ultimately delivering faster emergency services and improved community resilience against hurricanes, flooding, and severe weather events.
Interactive maps enhance public engagement with local history by enabling immersive exploration of historical sites, overlaying past and present landscapes, and providing multimedia storytelling through embedded photos, documents, and narratives. These digital tools allow museums, educational institutions, and historical societies across New England and Mid-Atlantic states to deliver personalized learning experiences, ultimately increasing visitor participation and community connection to regional heritage.
Maps depict climate change impacts on Northeast coastal areas through sea level rise projections, erosion rate indicators, flood zone boundaries, storm surge modeling, and habitat migration patterns. These visualizations enable coastal planners, environmental agencies, and municipal governments to assess vulnerability, prioritize infrastructure investments, and develop adaptive strategies, ultimately delivering data-driven resilience planning for increasingly threatened shoreline communities.
-
Easily Understandable slides.
-
Wonderful templates design to use in business meetings.