


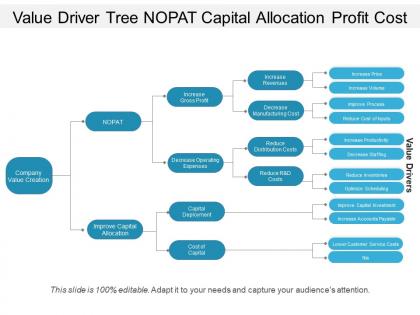
Value driver tree nopat capital allocation profit cost




Try Before you Buy Download Free Sample Product
 Impress Your
 Audience
 100%
100% Editable
 Save Hours
 of Time


Impress your counterparts with our Value Driver Tree Nopat Capital Allocation Profit Cost. They will agree to give full cooperation.
People who downloaded this PowerPoint presentation also viewed the following :
Value driver tree nopat capital allocation profit cost with all 5 slides:
Give employees enough incentive to improve with our Value Driver Tree Nopat Capital Allocation Profit Cost. Handle them in an indulgent fashion.




FAQs for Value driver tree nopat capital
So a Value Driver Tree is just a visual map showing how different parts of your business connect to drive overall value. Start with your main metric at the top - revenue, profit, whatever. Then break it down into branches like a family tree. Revenue splits into price and volume, volume breaks into market size and share, you get the idea. Honestly, it's one of those tools that actually makes sense once you see it laid out. You can trace problems right back to their source instead of guessing. When something's off, you'll know exactly which area needs attention. Way better than just throwing solutions at random issues and hoping they stick.
So basically you take your main business goal and work backwards to find what actually drives it. Like if you want more revenue, break it down: units sold × price. Then keep going deeper. It's honestly like reverse-engineering how your business works, which sounds nerdy but it's super helpful. The cool thing is it shows you which metrics actually matter vs the ones that just look pretty on dashboards. I'd start with whatever your biggest goal is next quarter and see what smaller pieces pop out - those usually make the best KPIs to track.
Start with your big picture metric - revenue, profit, whatever matters most to your company. Break it down into pieces, like revenue = volume × price. Then keep going deeper on each branch until you hit stuff you can actually control day-to-day. Honestly, I used to get way too perfectionist about making everything symmetrical, but just focus on the real drivers. Double-check your math works at every level - components should add or multiply up to the parent. Test it with actual numbers to see if it passes the sniff test. Then you can spot which changes will move the needle most.
So leading indicators are the stuff you can actually control day-to-day - customer acquisition rates, training hours, how fast your processes run. Lagging indicators? That's your revenue and profit margins showing up later. Leading ones predict what's coming, while lagging just confirms what you already suspected happened (kinda annoying, right?). Put the leading metrics higher up in your tree structure. They should feed down into those financial results below. Then get your team obsessing over moving those leading numbers instead of just staring at last month's revenue reports.
You absolutely need other departments involved - can't build this thing alone. Sales teams know what actually moves revenue. Operations gets the cost side. Marketing understands acquisition drivers way better than anyone else will. I've watched so many companies mess this up by having just finance or strategy try to map everything out. They miss obvious stuff because they're not talking to the people who actually touch those metrics daily. Run some workshops where each team can weigh in on what they control. Finance might think they know sales drivers, but they really don't compared to the reps in the field.
Yeah totally! Non-profits and government can use Value Driver Trees too. You just swap out profit for whatever you're actually trying to achieve. So like, a non-profit might track "lives improved" at the top, then break that down into stuff like donation efficiency, volunteer hours, program results. Government's similar - citizen satisfaction broken into response times, cost per person served, that kind of thing. Honestly I think it's way more interesting than just maximizing revenue. The trick is figuring out what "value" actually means for your org first, then working backwards to find what drives it. Makes sense?
Honestly, the worst thing you can do is overcomplicate it - keep it to 3-4 levels tops or your team will just get lost. Don't fall for vanity metrics that look cool but mean nothing for actual business results. Each branch needs someone who owns it and actually cares about moving the needle. I've seen way too many of these things just sit there collecting virtual dust because nobody bothers updating them. You gotta review quarterly at minimum, more if things are changing fast. Oh and make sure the metrics actually matter - sounds obvious but you'd be surprised how often people mess this up.
Dude, templates are a lifesaver for Value Driver Trees. Clean formatting and color coding make everything way easier to follow - stakeholders actually get it instead of glazing over. I always use consistent boxes and arrows so people can trace the logic without getting confused. Different indentation levels help too. Honestly, those messy spreadsheet presentations are the worst (we've all been there). Having designated spots for everything keeps your presentation focused. Oh and definitely build a template library you can reuse. Saves so much time later.
Look, it's mostly the usual suspects - revenue, costs, margins, that kind of stuff. Customer acquisition and retention rates too. I'd start with your main P&L items and break those down. Then grab operational data like conversion rates, average order value, headcount metrics. Really depends on what you're doing though - a SaaS company tracks different things than retail, obviously. The trick is making sure every branch connects to something you can actually measure and do something about. Oh, and unit economics - definitely don't sleep on those. Map your big revenue drivers first, then work backwards to figure out what you can realistically track.
So basically you build one for your current business first, then make 2-3 different versions to test scenarios. Like "what if we bump prices 10% but lose 5% of customers?" - you can see exactly how that flows through to your bottom line. Way easier than trying to juggle all those connections mentally (which I'm terrible at honestly). The tree layout shows you which changes actually move the needle on your main goal. I'd probably start simple and add complexity later. It's genuinely useful for stress-testing big decisions before you commit.
So for startups, you're basically proving everything from scratch - focus on customer acquisition and how much each customer actually costs vs. what they're worth. Conversion rates, lifetime value, burn rate. That stuff matters way more than traditional metrics right now. Bigger companies? They can afford to dig into operational efficiency since they've got steady revenue coming in. Honestly, the whole approach is different - startups need metrics that help test assumptions about the future, while enterprises can lean on what's already worked. Start with whatever keeps you up at night, then build your analysis around that.
Honestly, tech has been a game-changer for Value Driver Trees - way better than those messy spreadsheets from before. Try Lucidchart or Miro for the visual stuff since they auto-update connections when you tweak metrics. For the data side, Anaplan works great, or you can get fancy with Excel and Power Query to pull live data straight into your nodes. The collaboration part is huge too - everyone can jump in and edit without that annoying version control mess. I'd start with whatever visualization tool you guys already have (why reinvent the wheel?), then add the data connections once you've nailed down the structure.
Honestly, VDTs and agile planning work great together - they're both about chopping big scary problems into bite-sized chunks. Pick your top 3-5 value drivers first. Then run quick experiments to see which ones actually move your numbers (spoiler: it's usually not what you think). The tree format makes pivoting painless when your assumptions blow up or the market shifts. Way better than those giant strategy docs that everyone ignores anyway. You'll test and tweak in short sprints, but you're focusing on the levers that genuinely matter for your business.
Look, a Value Driver Tree is basically your cheat sheet for figuring out what actually matters in a deal. You'll see right away if it's revenue growth, better margins, or cutting costs that'll make or break your returns. Then you can focus your digging there instead of wasting time on irrelevant stuff. Plus it's great for calling BS on the seller's rosy projections - you can break down their assumptions piece by piece. The real win though? It shows you exactly what improvements you'd need to make post-close to hit your numbers, so you know upfront if you're being realistic or just dreaming.
Quarterly minimum, but monthly is way better tbh. Markets move so damn fast these days - customer habits shift, new competitors pop up, supply chains get weird. Your key drivers can flip before you know it. I've watched teams burn months chasing metrics that stopped mattering because their tree was stale. Monthly feels like overkill until you realize you've been optimizing the wrong stuff for half a quarter. Just set a recurring meeting now and actually stick to it. Trust me on this one.
-
Colors used are bright and distinctive.
-
Enough space for editing and adding your own content.