


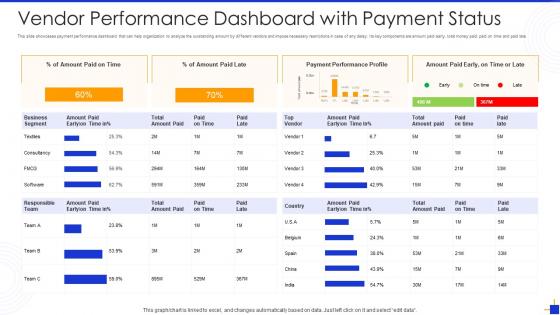
Vendor performance dashboard with payment status




Try Before you Buy Download Free Sample Product
 Impress Your
 Audience
 100%
100% Editable
 Save Hours
 of Time


Our Vendor Performance Dashboard With Payment Status are topically designed to provide an attractive backdrop to any subject. Use them to look like a presentation pro.
People who downloaded this PowerPoint presentation also viewed the following :
Vendor performance dashboard with payment status with all 6 slides:
Use our Vendor Performance Dashboard With Payment Status to effectively help you save your valuable time. They are readymade to fit into any presentation structure.





FAQs for Vendor performance dashboard
Focus on the stuff that actually matters - quality scores, delivery times, and whether they're hitting their contract numbers. Response time is huge too because nothing's worse than a vendor who disappears when shit hits the fan. Track SLA compliance and any industry-specific risk stuff you need. Invoice accuracy matters more than people think. Honestly, don't overcomplicate it - pick like 6-8 metrics that directly affect your day-to-day operations. Monthly reviews work fine. Keep it simple and you'll actually use the data instead of drowning in spreadsheets.
Honestly, visualization is a game-changer for vendor stuff. Those endless spreadsheets? Forget scrolling through all that - charts instantly show you who's killing it vs. who's tanking. I've literally saved hours just having a decent dashboard set up. You'll catch patterns way faster, like seasonal dips or whatever, plus compare different metrics without going cross-eyed. Oh, and definitely set up alerts when numbers drop below your limits. That's probably the best part - you're not scrambling to fix problems after they've already blown up. Trust me on this one.
Stick to what your stakeholders actually care about - delivery times, quality scores, cost performance, and SLA compliance. Those four are gold. Don't go crazy with twenty different metrics on one dashboard (I've made that mistake before, it's overwhelming). Traffic light colors work great for quick status checks. Trend charts help too. You'll want drill-down capability so people can dig deeper when something looks off. Set up alerts for the critical stuff so you're not babysitting the screen all day. Start small with maybe 5-7 metrics, then add more if people ask for them.
Honestly? Twice a week works best for most people. Weekly is the bare minimum - any less and you're flying blind. Daily is way too much unless something's really broken. I tried monthly updates once and it was basically useless for catching problems early. The thing is, if you can automate the data pulls, then you're golden. Saves so much time. That way you're actually looking at trends instead of just copying numbers around like some kind of data monkey. Few days between updates keeps things current without making it your whole job.
So for vendor dashboards, Power BI and Tableau are your best bet if you've got budget - they're pretty robust but yeah, bit of a learning curve. Looker Studio is free which is nice, or Qlik Sense works too. Excel's fine for simple stuff but gets annoying with multiple vendors tbh. If your company's already on SAP Ariba or Ivalua, might as well use those since they're built for procurement. Honestly I'd figure out what metrics you actually care about first - saves you from getting sucked into fancy features you won't use. Then just pick whatever matches your skills and budget.
Set up real-time checks that catch weird outliers or missing data as it comes in from vendors. Weekly reconciliation is huge - cross-check their submissions against your internal stuff regularly. I've watched dashboards turn into complete disasters because of bad data, and honestly it's just embarrassing when leadership sees it. Make your vendors use standard templates so the info comes in consistently. The trick is finding problems early instead of during those awful monthly review meetings. Oh, and automate whatever validation you can - saves tons of headaches later.
Your dashboard won't mean anything if you're not constantly checking with the people who actually use it. Talk to procurement teams, department heads - ask them what decisions they're making and what data would help them move faster. I swear, half the dashboards I see track every possible metric but somehow miss what people actually need. Set up feedback sessions maybe quarterly? The trick is asking specific questions instead of just "how's it working?" And actually make the changes they suggest - otherwise they'll stop being honest with you next time.
Look at your vendor data for delivery rates, quality scores, response times - stuff like that. Run some regression analysis to catch seasonal dips or gradual declines. Honestly, 12-18 months of data is usually plenty to work with. Don't forget to check how different metrics connect - like communication scores often predict delivery issues down the line. Set up alerts when performance starts drifting from your forecasts. That way you'll catch problems before they bite you. Oh, and look for patterns between metrics too - they're usually more connected than you'd think.
Put your critical stuff right at the top - vendor scores, costs, delivery rates. People need to see that immediately. Then group everything else logically: quality metrics in one section, financials in another, compliance wherever makes sense. Honestly? Most dashboards I've seen are total disasters - like someone blindfolded themselves and threw darts at charts. Keep related stuff together, use the same colors throughout. Filters should go on the left where people expect them. Oh, and definitely test it with real users first. Nothing worse than building something nobody can actually use!
Honestly, vendor dashboards are pretty much magic for procurement decisions. You'll finally see patterns - like who actually delivers on time versus who's always making excuses. Quality issues become obvious too, instead of you just putting out fires constantly. I started with maybe 3-4 key metrics because tracking everything at once gets overwhelming fast. The real win is figuring out which suppliers are worth building long-term relationships with. Plus you can spot the ones that need serious improvement talks or just need to go. Way better than flying blind on vendor performance.
Oh man, the worst thing you can do is cram like 15 different metrics on there - nobody knows where to look. Keep it to maybe 5-7 things that people actually make decisions with. Double-check your data sources first too (seriously, I've seen dashboards with completely wrong numbers for months). Focus on what your stakeholders care about, not just the easy stuff to pull. And here's the thing - test it with real users before you go live. What seems obvious to you might be total gibberish to them. Start basic, then build from there based on what they tell you.
Honestly, getting everyone aligned is like herding cats but totally doable. First thing - round up procurement, finance, ops, and quality teams since they all track different stuff. Finance obsesses over cost savings, ops watches delivery times, quality monitors defects, you know the drill. Have each team dump their current KPIs on the table, then hunt for overlapping data and nail down shared definitions (this part's actually harder than it sounds). Once that's sorted, build a unified collection process and assign someone to own each metric. The trick is making sure the dashboard actually helps everyone's day-to-day work, not just some executive's pet project.
Dude, you've gotta watch out for cultural stuff messing with your vendor metrics. What seems like terrible performance might just be how business works in that region - different communication styles, timing expectations, the whole deal. Geography screws things up too since shipping from across the globe obviously takes longer than local vendors. I learned this the hard way last year, actually. Break down your dashboard by region and set different benchmarks for each area. Don't use the same standards everywhere or you'll be comparing totally different situations. Short version: location-specific KPIs are your friend here.
Dude, automation is a total game changer for vendor tracking. No more manual data entry hell - everything pulls in automatically from different sources. When vendors start slacking, you'll get alerts right away instead of finding out weeks later. The dashboards update themselves too, so you're not stuck doing those weekly spreadsheet exports (seriously, who has time for that?). Human errors basically disappear. You can even spot problems before they become disasters. I'd start with the stuff that takes forever - delivery times and quality scores usually. Then just build from there once you get the hang of it.
So basically turn your feedback into numbers or ratings - like 1-5 scales for communication, response time, that kind of stuff. Honestly the soft feedback usually matters more than the hard data anyway. Pop-up tooltips work well for capturing detailed comments, and I'm a big fan of color-coding everything (green good, red bad). Oh, and sentiment analysis is pretty cool if you've got written reviews to work with. Don't go crazy though - maybe start with 2-3 qualitative things so your dashboard doesn't look like a rainbow exploded on it.
-
Excellent design and quick turnaround.
-
Easily Editable.