


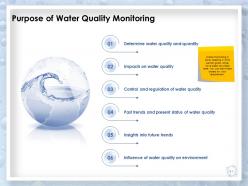
Water quality monitoring management powerpoint presentation slides


Try Before you Buy Download Free Sample Product
 Impress Your
 Audience
Editable
of Time


Introducing Water Quality Monitoring Management PowerPoint Presentation Slides which will assist in developing, distributing, and managing the optimum use of water resources. By taking advantage of our readily available water testing PPT visuals, discuss the six main indicators of the water quality. This water resource management PPT slide deck can be used by the department of water for analyzing information about water quality and to underpin decisions about water resource management. You can provide an overview of water market size, growth rate, and capital expenditure by using our readily available water quality modeling PPT slideshow. Describe how you can monitor and assess the water quality in order to manage the water resources. You can also showcase the wastewater treatment according to various industry types by utilizing these water quality monitoring PowerPoint slides. Highlight the trends that can influence the water industry in the future. Also, showcase the factors that can affect the performance of the water technology market. Hence, download our ready-to-use assessing water quality PowerPoint presentation and ensure the optimum use of water resources.
People who downloaded this PowerPoint presentation also viewed the following :
Content of this Powerpoint Presentation
Slide 1: This slide introduces Water Quality Monitoring Management. State your Company name and begin.
Slide 2: This slide displays Content of the presentation.
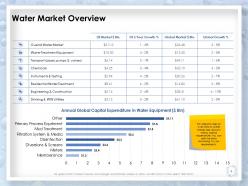
Slide 3: This slide showcases Water market overview.
Slide 4: This slide provides an overview on water market size, Growth rate & capital expenditure. You can edit the data according to your requirements.
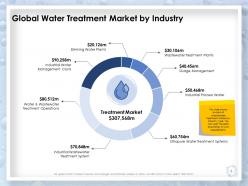
Slide 5: This slide shows division of wastewater treatment market by industry type. You can edit the data according to your requirements.
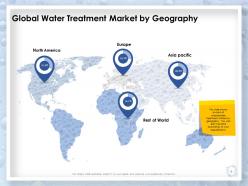
Slide 6: This slide shows division of wastewater treatment market by geography. You can edit the data according to your requirements.
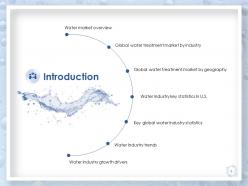
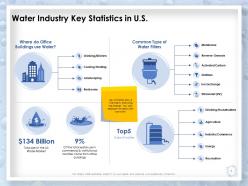
Slide 7: This slide depicts Water Industry Key Statistics in U.S.
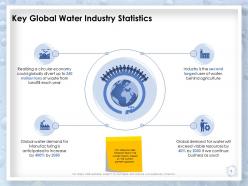
Slide 8: This slide provides forecast about the water industry based on the current patterns globally.
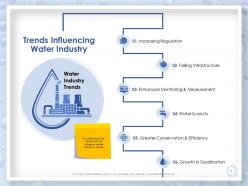
Slide 9: This slide shows key trends that will influence water industry in future.
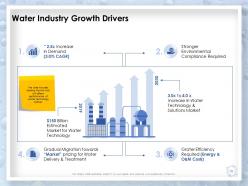
Slide 10: The slide includes leading factors that will affect performance of water technology market.
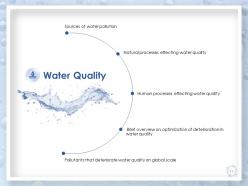
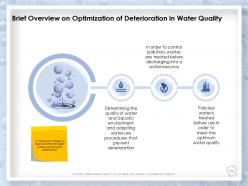
Slide 11: This slide provides Brief overview on optimization of deterioration in water quality
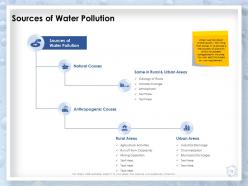
Slide 12: This slide shows Sources of Water Pollution.
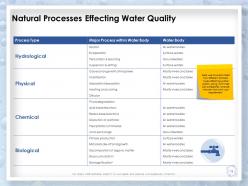
Slide 13: This slide showcases Natural Processes Effecting Water Quality.
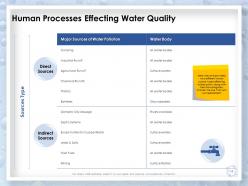
Slide 14: This slide shows Human Processes Effecting Water Quality.
Slide 15: This slide presents Brief Overview on Optimization of Deterioration in Water Quality.
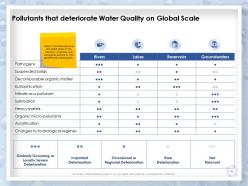
Slide 16: In this slide we have provided some of the common chemical and biological pollutants that deteriorate water quality.
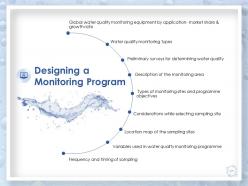
Slide 17: This slide provides information regarding Designing a Monitoring Programme
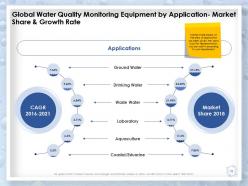
Slide 18: This slide depicts Global Water Quality Monitoring Equipment by Application- Market Share & Growth Rate
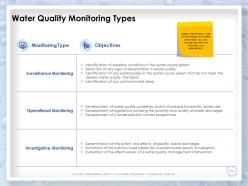
Slide 19: This slide showcases Water Quality Monitoring Types.
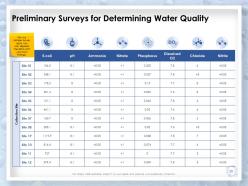
Slide 20: This slide depicts Preliminary Surveys for Determining Water Quality
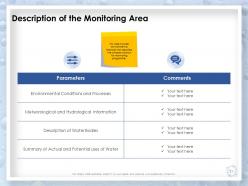
Slide 21: This slide includes environmental features that describe the suitable location for monitoring programme.
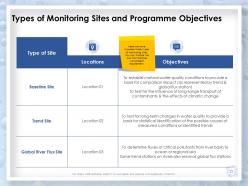
Slide 22: This slide showcases Types of Monitoring Sites and Programme Objectives.
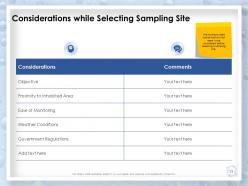
Slide 23: This slide depicts Considerations while selecting Sampling Site.
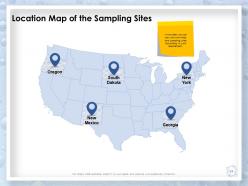
Slide 24: In this slide you can use your own map and sampling sites according to your requirement.
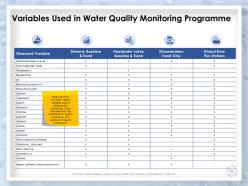
Slide 25: This slide showcases Variables Used in Water Quality Monitoring Programme
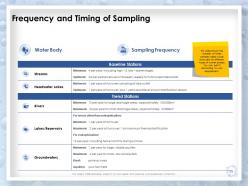
Slide 26: This slide shows the number of times samples need to be analysed for different types of water bodies. You can edit it according to your requirement.
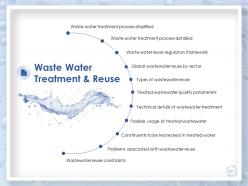
Slide 27: This slide showcases Waste Water Treatment & Reuse
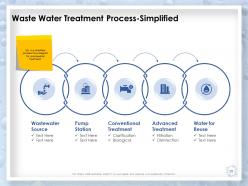
Slide 28: This slide presents Waste Water Treatment Process-Simplified.
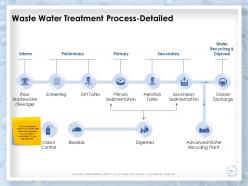
Slide 29: This slide depicts Waste Water Treatment Process-Detailed
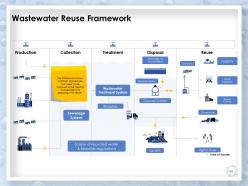
Slide 30: The framework shows common procedures that need to be followed while treating wastewater and disposing it for reuse.
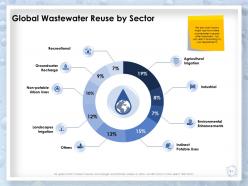
Slide 31: The pie chart in the slide shows major sectors where wastewater is reused after treatment. You can edit it according to your requirements.
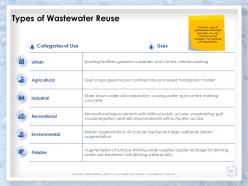
Slide 32: This slide shows Types of Wastewater Reuse
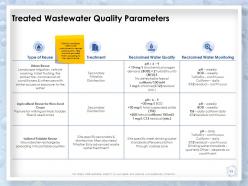
Slide 33: This slide displays Treated Wastewater Quality Parameters.
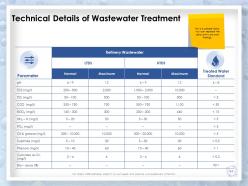
Slide 34: This slide showcases Technical Details of Wastewater Treatment.
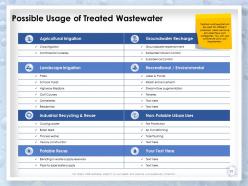
Slide 35: This slide displays Possible Usage of Treated Wastewater
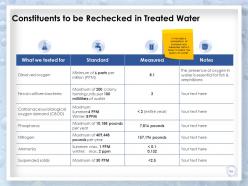
Slide 36: This slide shows comparison of standard and measured data is done to check the quality of water.
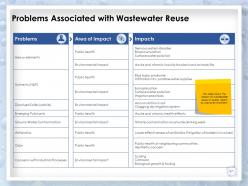
Slide 37: This slide presents Problems Associated with Wastewater Reuse
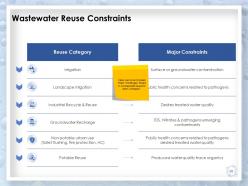
Slide 38: This slide showcases Wastewater Reuse Constraints
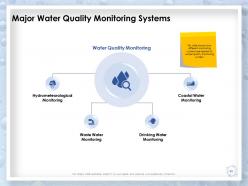
Slide 39: This slide showcases Major water quality monitoring systems.
Slide 40: This slide shows how different monitoring systems are related to water quality monitoring system.
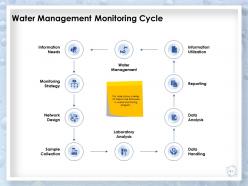
Slide 41: This slide shows a series of steps to be followed in water monitoring projects.
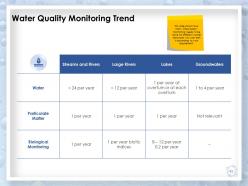
Slide 42: This slide shows how many times quality monitoring needs to be done for different water resources. You can edit it according to your requirement.
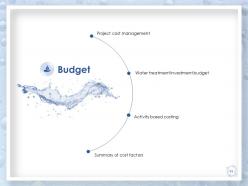
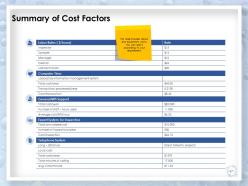
Slide 43: This slide displays Summary of cost factors
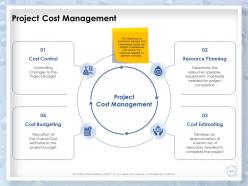
Slide 44: This slide shows a continuous process that takes place during the project to determine and control the resources needed to perform the tasks.
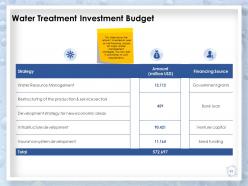
Slide 45: This slide shows the amount invested as well as the financing source for major water management strategies. You can edit it according to your requirements.
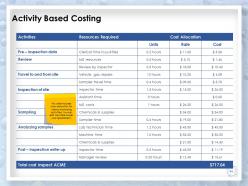
Slide 46: This slide includes cost allocation for various monitoring activities. You can edit the table as per your requirement.
Slide 47: This slide includes labour and equipment costs. You can edit it according to your requirement.
Slide 48: This slide showcases KPI Metrics & Dashboards
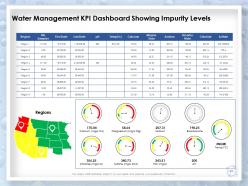
Slide 49: This slide displays Water Management KPI Dashboard Showing Impurity Levels
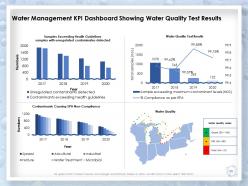
Slide 50: This slide showcases Water Management KPI Dashboard Showing Water Quality Test Results
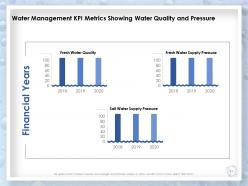
Slide 51: This slide depicts Water Management KPI Metrics Showing Water Quality and Pressure
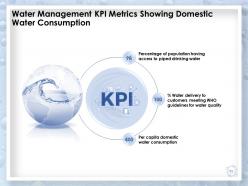
Slide 52: This slide showcases Water Management KPI Metrics Showing Domestic Water Consumption
Slide 53: This slide is titled as Additional Slides for moving forward.
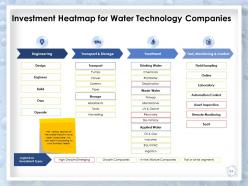
Slide 54: This slide shows Investment Heatmap for Water Technology Companies
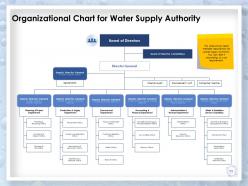
Slide 55: This slide shows Organizational Chart for Water Supply Authority
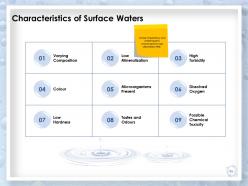
Slide 56: This slide displays Characteristics of Surface Waters
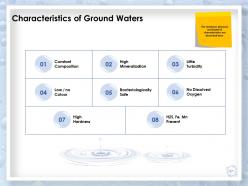
Slide 57: This slide showcases Characteristics of Ground Waters
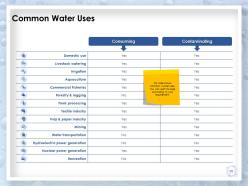
Slide 58: This slide shows common water uses. You can edit this slide according to your requirement.
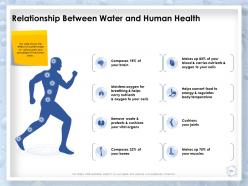
Slide 59: This slide shows the effect of water intake on various parts and processes of the human body.
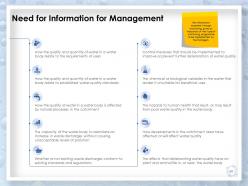
Slide 60: This slide displays Need for Information for Management
Slide 61: This slide shows Influence of water quality on environment.
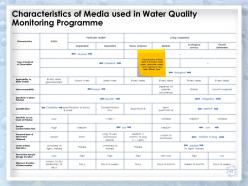
Slide 62: This slide depicts Characteristics of Media used in Water Quality Monitoring Programme
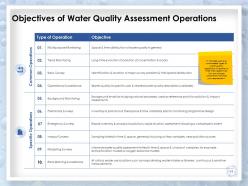
Slide 63: In this slide we have summarized types of water quality operations in relation to their main objectives. You can choose whichever matches your requirement.
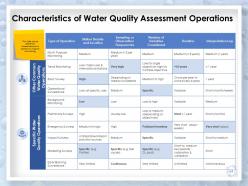
Slide 64: This slide shows operation characteristics in relation to type of monitoring.
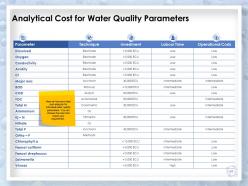
Slide 65: This slide shows Analytical Cost for Water Quality Parameters
Slide 66: This is Water Quality Monitoring Icons Slide
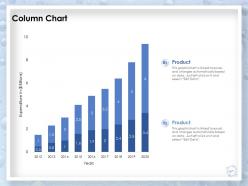
Slide 67: This slide displays Column Chart for Comparison of products.
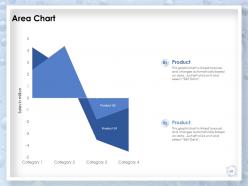
Slide 68: This slide displays Area Chart for comparison of products.
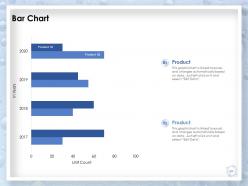
Slide 69: This slide displays Bar Chart for products comparisons.
Slide 70: This slide is titled as Post It Notes. Post your important notes.
Slide 71: This is Idea Generation slide to highlight important facts and ideas.
Slide 72: This slide displays Goals of the Company.
Slide 73: This slide shows Roadmap process.
Slide 74: This slide shows Comparison in percentages.
Slide 75: This is Thank You slide with Contact details.
Water quality monitoring management powerpoint presentation slides with all 75 slides:
Give your audience a fulfilling experience. They will find our Water Quality Monitoring Management Powerpoint Presentation Slides elevating.


FAQs for Water quality monitoring management
So you'll mainly be looking at three types of stuff - physical, chemical, and biological indicators. Temperature, color, and how cloudy the water looks are the obvious physical ones. Chemical testing gets into pH levels, dissolved oxygen, nitrates, phosphates, plus heavy metals like lead or mercury. Honestly, the biological testing is where things get nasty - we're talking E. coli, coliform bacteria, algae counts. You might also check conductivity for dissolved salts and total solids. Really depends on your water source though - like, well water vs city supply will have totally different risk factors, so figure out what you're most worried about first.
Basically nitrates and phosphates act like plant food for algae and aquatic stuff. Too much causes crazy overgrowth that sucks up all the oxygen when it dies off - total fish killer. Phosphates are worse in lakes and rivers, nitrates mess up ocean areas more. Here's the annoying part though: the pollution usually comes from farms or city runoff way upstream, so you're dealing with someone else's problem. I'd check both levels pretty regularly instead of just testing once. Look for patterns over time since single readings don't tell you much.
So the big thing now is multi-parameter sensors - they'll check pH, dissolved oxygen, turbidity, conductivity all in one go. Way easier than juggling separate probes. IoT loggers are pretty sweet too since they beam data straight to your phone or computer. Optical sensors are taking over because honestly, the old electrochemical ones were a pain in the ass. Bigger setups use automated sampling systems that grab water samples on whatever schedule you want. There's even satellite monitoring for huge lakes and stuff, though that's probably overkill for most people. If you're just starting out? Get a basic multi-parameter probe with cloud data storage. You can always add more sensors down the road.
Yeah, environmental stuff can totally throw off your water readings. Temperature changes dissolved oxygen and how fast chemical reactions happen. pH shifts mess with how contaminants act too. Rain's weird - it dilutes some pollutants but then brings in new crap from runoff. I've seen storms completely change baseline numbers overnight. Time of day matters, plus seasonal changes and algae blooms. Honestly, just stay consistent with when and how you sample. Write down the conditions each time so you can figure out patterns later.
Think of microorganisms like nature's warning system for dirty water. E. coli is your go-to starting point - easiest to test for. Different bacteria and algae either love polluted conditions or totally can't handle them, so you can tell what's happening just by seeing who's thriving. Way better than chemical tests if you ask me. The communities change over time too, which is actually pretty neat because you get a picture of both current problems and what's been going wrong historically. Some protozoa are crazy sensitive indicators. It's like having a biological report card for your water quality.
Honestly, just start by googling "[your area] volunteer water monitoring" - most cities have programs through watershed groups or environmental nonprofits. They'll train you on the basic testing kits, which isn't too complicated once you figure it out. Stream cleanups are another good way to get involved, though those are usually seasonal. Some people actually "adopt" specific waterways to check on regularly, which sounds kinda intense but cool. Your city's environmental department might have citizen science programs too. I'd just reach out to local environmental groups first - they'll know what's happening nearby.
Honestly, lead's the big scary one - comes from old pipes and really messes with kids since it builds up in their systems. You've also got copper leaching, plus all the nasty stuff that washes off roads and parking lots into storm drains. Nitrates, phosphates, even traces of medications are popping up more in city water. It's wild how contamination comes from everywhere - factories, street oil, those road salts we dump everywhere in winter. I'd probably start testing for heavy metals first, then see what other problems your area specifically deals with. Microbial stuff from stormwater overflow is another headache to track.
Monthly testing works for most freshwater, but ramp it up to weekly after heavy rains or algal blooms. Summer's when things get crazy with biological activity, so test more then too. Drinking water sources obviously need way more frequent checks than some random lake. I always tell people not to slack off during winter - that's when you miss the subtle trends that actually matter. Daily testing might sound excessive, but trust me, after industrial spills you'll want those numbers. Create your baseline schedule but don't be rigid about it. Weather and seasons will dictate when you need to adjust.
Honestly, power and connectivity are your biggest headaches out there. Solar panels work great until a random storm wrecks everything - learned that one the hard way. Cell service is basically nonexistent, so you're looking at pricey satellite connections. Animals love chewing cables too, which is super annoying. Temperature swings will mess with your equipment constantly. Getting to sites for repairs can eat up days of travel time. I'd go with tough, low-power sensors and maybe set up backup communication methods. Oh, and budget for quarterly maintenance trips - you'll definitely need them.
Climate change is totally screwing with water monitoring systems. More extreme storms mean sudden contamination spikes you can't predict. Higher temps make algae bloom like crazy and oxygen levels drop. Monthly sampling at the same spots? Yeah, that's not gonna work anymore - feels like we're stuck in the past honestly. Real-time sensors are becoming necessary, not just nice to have. You'll need way more monitoring points and frequent sampling during weather events. Also, precipitation patterns are all over the place now which throws off your baseline data. I'd start by figuring out which water sources are most vulnerable and upgrade those first.
So the Safe Drinking Water Act is basically your main federal rule to follow. EPA sets the maximum contaminant levels and testing schedules. Testing frequency varies a ton - could be daily, quarterly, or yearly depending on your system size and what you're checking for. States can pile on extra requirements too, which honestly makes it more confusing. Missing any deadlines triggers violations fast. I'd start with your state's primacy agency website since they'll have the specific schedule for your area. It's definitely overwhelming at first but you'll get the hang of tracking everything.
So basically, monitoring water quality catches nasty stuff before it makes people sick. You're tracking bacteria, chemicals, pH levels - all that fun science stuff. Spot a problem early? Boom, you can warn people or shut down contaminated sources before anyone gets an outbreak. Real-time systems are clutch because they ping authorities the second something's wrong. It's wild how much disease gets prevented this way, honestly. Plus the data helps you figure out where pollution's coming from and improve treatment plants. Way better than dealing with the mess after people are already sick, you know?
Ugh, agricultural runoff is such a nightmare for water quality. Basically all that nitrogen and phosphorus from fertilizers washes into streams and lakes, causing massive algal blooms. Fish can't survive because the oxygen gets depleted - it's honestly heartbreaking to witness. Pesticides make everything worse by poisoning the entire food web. Plus you get all this sediment making the water super murky, so plants can't even photosynthesize properly. If you're testing water downstream from farms, definitely check nitrate and phosphate levels regularly. pH changes too - that's usually a dead giveaway something's off.
Dude, you should totally look into AI for your water monitoring setup. The tech can spot contamination before it actually happens by analyzing all your sensor data in real-time. Pretty wild stuff - it catches super subtle patterns that we'd completely miss, like early signs of algae blooms. Your algorithms actually learn and improve over time too. They'll optimize where you're sampling, cut down on annoying false alarms, and even predict when your equipment's about to crap out. Honestly, just start running predictive analytics on whatever data you've already got. You're probably sitting on tons of useful insights and don't even know it.
So basically, you've gotta translate all that nerdy data into stuff people actually get. Compare your readings to EPA limits, sure, but then explain what it means - like can my kids swim in this lake or is our drinking water sketchy? Visual stuff works way better than boring spreadsheets (seriously, nobody's decoding those). Show trends over time instead of just random snapshots. Be honest about what you don't know too. The whole point is answering "so what?" - give people info they can actually use to make real decisions about their health and daily stuff.
No Reviews