


Accounting Ratio Powerpoint Presentation Slides


Try Before you Buy Download Free Sample Product
 Impress Your
 Audience
Editable
of Time


We provide content-ready accounting ratio PowerPoint presentation slides that include necessary information that helps in taking the right financial and investment decisions. This Accounting statement analysis presentation reveals strengths and weaknesses of the firm through accounting ratio comparison. This financial ratio PPT include slides on investment valuation ratios, dividend yield, financial planning, budgetary control, cash flow coverage, financial comparison, and target achievement. Using these accounting process PowerPoint visuals, you can determine quantitative relationship between two or more entities of the financial statement. Moreover, the financial statement PPT templates covers a wide range of topics, including accounting cycle, ratio analysis accounting, asset turnover ratios, liquidity ratios, leverage ratios, profitability ratios and revenue budgeting. To sum it up, this readymade presentation deck will help you judge the financial position and performance of your organization. Download our content-ready accounting ratio PowerPoint presentation right now. Advocate interracial co-existence with our Accounting Ratio Powerpoint Presentation Slides. Build the foundation for communal harmony.
People who downloaded this PowerPoint presentation also viewed the following :
Content of this Powerpoint Presentation
Slide 1: This slide introduces Accounting Ratio. State Your company logo
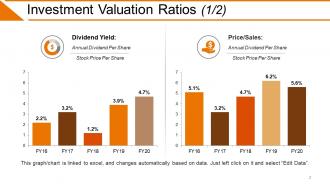
Slide 2: This slide presents Investment Valuation Ratios (1/2) with these two main parameters you can analyse- Dividend Yield, Price/Sales.
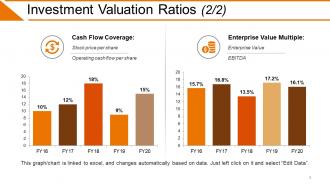
Slide 3: This slide showcases Investment Valuation Ratios (2/2) with these following parameters- Cash Flow Coverage, Operating cash flow per share, Stock price per share, Enterprise Value Multiple, EBITDA, Enterprise Value.
Slide 4: This slide is titled Additional Slides.
Slide 5: This slide represents Our Mission. State your mission, goals etc.
Slide 6: This slide showcases Our Team with Name and Designation to fill.
Slide 7: This slide helps show- About Our Company. The sub headings include- Creative Design, Customer Care, Expand Company .
Slide 8: This slide shows Our Goals for your company.
Slide 9: This slide shows a Stacked Line graph in terms of percentage and years for comparison of Product 01, Product 02, Product 03 etc.
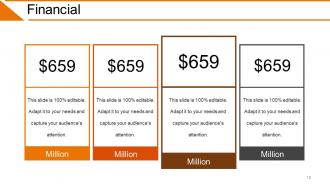
Slide 10: State your Financial score in this slide with relevant imagery and text.
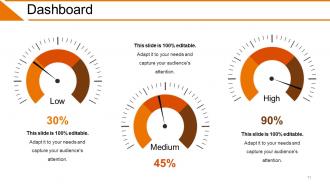
Slide 11: This is a Dashboard slide to show- Strategic System, Success, Goal Process, Sales Review, Communication Study.
Slide 12: This is a Quotes slide to convey message, beliefs etc.
Slide 13: This is a Location slide to show global growth,presence etc. on world map.
Slide 14: This slide shows Coffee Break image.
Slide 15: This is a Timelines slide to show- Plan, Budget, Schedule, Review.
Slide 16: This slide showcases a Puzzle with imagery.
Slide 17: This slide shows target achievements. You can add your achievements.
Slide 18: This slide shows a Mind map for representing entities.
Slide 19: This slide displays a Bulb or idea image.
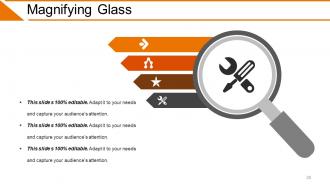
Slide 20: This is a Magnifying glass image slide to show information, scoping aspects etc.
Slide 21: This slide displays the title Charts & Graphs.
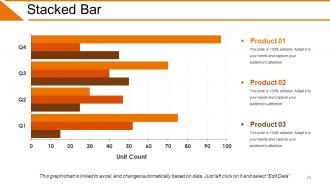
Slide 22: This slide showcases Stacked Bar. You can use this by comparing the products.
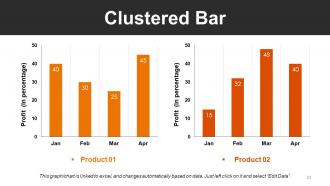
Slide 23: This slide presents Clustered Bar. Add your own own content and use it.
Slide 24: This slide shows Donut Pie Chart. You can use it for the comparison.
Slide 25: This is a Thank You image slide with Address, Email and Contact number.
Accounting Ratio Powerpoint Presentation Slides with all 25 slides:
Go ahead irrespective with our Accounting Ratio Powerpoint Presentation Slides. Don't hesitate to initiate action.


FAQs for Accounting Ratio
So accounting ratios are just ways to compare different numbers from your financial statements - profit margins, cash flow stuff, debt levels, you know. Raw numbers by themselves are pretty useless honestly. Like if I told you my business made $50K profit, you'd have no clue if that's amazing or trash, right? But ratios give you the real picture. You can see how you stack up against competitors, watch for trends, catch problems early. Banks and investors look at these too when they're deciding whether to work with you. My advice? Pick 3 or 4 ratios that actually matter for your industry first. Don't go crazy trying to calculate everything.
So liquidity ratios are basically how you figure out if a company can actually pay their bills on time. Current ratio is the big one - just current assets divided by current liabilities. Then there's the quick ratio, which kicks out inventory since that's harder to turn into cash fast. Honestly, I think of it like checking if I've got enough money for groceries before payday, except it's for businesses. You want current ratios somewhere around 1.5 to 2.0 usually. Below that and they might hit some serious cash problems down the road.
So the quick ratio cuts out inventory, which makes it way more conservative than current ratio. Your current ratio could be sitting pretty at 2.5, but if you're drowning in slow-moving stock, your quick ratio might tank to like 0.8. Happens all the time with retail companies - learned that the hard way once. Quick ratio only counts cash, receivables, and marketable securities. It's basically the "can I pay my bills if everything goes sideways tomorrow" metric. Look at both together though. Big gap between them? Your inventory management probably needs work.
So profitability ratios show how well companies turn their resources into actual profits - it's all about operational efficiency. ROA and operating margin reveal if management's doing their job with assets and cost control. If gross profit margin drops, that usually means production costs are climbing or they're getting squeezed on pricing. ROE shows whether they're actually creating value for shareholders. Honestly, the real magic happens when you track these over months or years to catch trends. Just make sure you're comparing against industry averages, not random companies. Look for steady improvements rather than those one-off good quarters that don't mean much.
Debt ratios show you how much a company owes compared to what it owns - super useful for checking if they're in trouble financially. When companies borrow tons of money, things can go great during good times but turn ugly quick if their income drops. I always check debt-to-equity and debt-to-assets first. It's honestly like watching someone pile up credit card debt - fine until their paycheck gets cut! You should compare these numbers to similar companies and see if they're trending up or down over a few years. That'll tell you if they're cleaning house or digging deeper.
So ROE looks at returns for shareholders specifically, while ROA covers all assets - both debt and equity funded. The big difference? Companies with lots of debt usually show higher ROE than ROA since they're using borrowed cash to pump up shareholder returns. Think of it as financial amplification I guess. ROA gives you the cleaner view without debt muddying the waters. You'll want to check both ratios together - sometimes high ROE just means heavy borrowing, not actually great operations.
Honestly, there's no magic number that works across the board. A tech startup's ratios would look completely insane for a utility company, you know? Like, retail companies barely scrape 2-4% profit margins but they turn inventory super fast. Meanwhile software companies might hit 20%+ margins with totally different cash patterns. Industry averages are kinda sketchy anyway since they mix failing companies with the rockstars. What I'd do - find 3-5 companies that actually compete with you directly and dig into their annual reports. That'll give you way better targets than some generic benchmark.
Honestly, trend analysis is a game-changer for catching problems early. You'll spot patterns in your ratios before things get messy - like if your current ratio keeps dropping, you know you need better cash flow or more working capital. I always tell people to track maybe 3-5 key ratios monthly (don't go overboard). Look for consistent patterns, not just random monthly blips. It's way easier to compare yourself to industry benchmarks too. Plus you can actually see which parts of your business are killing it versus the ones that need work. Super helpful for planning where to focus next.
Hey! So accounting ratios are pretty useful but they've got some real blind spots. First off, they're all backward-looking - telling you what already happened, not what's coming. Companies also use different accounting methods, which makes comparing them kinda pointless sometimes. A solid ratio in one industry might suck in another too. Plus they totally miss the human stuff - like whether management actually knows what they're doing or if the market's about to tank. Honestly, I'd treat them more like conversation starters than final answers, you know?
So ratios are basically your best friend here - they turn everything into percentages so you can actually compare companies fairly. Like, a tiny company making $1M with 15% profit margins is crushing some massive corp pulling $100M but only 8% margins, you know? Raw dollar amounts are pretty useless for comparison since bigger companies will obviously have bigger numbers. But ratios like ROE or debt-to-equity? Those show you the real story. Just pick the ones that match what you're actually trying to figure out - profitability stuff, how efficient they are, or if they're financially solid.
So check out debt-to-equity first - tells you if they're drowning in debt. Current ratio shows whether they can actually pay their bills. Quick ratio is better though, more conservative. Interest coverage is probably the most important one honestly - reveals if they're struggling with debt payments. Oh and definitely look at return on equity plus profit margins to see if management's creating value or just burning through cash. Those five will catch most of the big red flags before you get burned.
Dude, startups and established companies are totally different beasts. You're basically measuring survival vs optimization. Cash is everything for startups - burn rate, runway, how fast you're converting sales to actual money. Customer acquisition costs matter way more than some fancy ROE calculation. Traditional companies? They've got the luxury of caring about profit margins and debt ratios because they're not constantly wondering if they'll exist next quarter. It's honestly like comparing a college student's budget (ramen money left?) to your parents' retirement planning. Startups need metrics that scream "will we live?" while established businesses track "how efficiently are we killing it?" Start with staying alive, then worry about the fancy stuff.
Look, cash flow ratios are honestly way better than profit numbers because companies can mess around with earnings pretty easily. But cash? That's harder to fake. You'll see what's really going down - like whether they're actually making money from their business or just bleeding cash while looking profitable on paper. Growth companies are notorious for this stuff. I always check operating cash flow ratio first, then free cash flow yield. It's like getting the unfiltered version instead of the PR spin they put on earnings reports.
Oh yeah, this totally screws things up. You can't just compare companies using IFRS vs US GAAP and get anything useful. They handle leases completely differently, plus revenue recognition and how they value assets. Your debt-to-equity ratios will be all over the place. I learned this the hard way doing some analysis last year - super frustrating. Either adjust everything to match one standard or just stick with companies using the same framework. Quick tip: always double-check which accounting standards they're using first. Saves you from looking like an idiot later.
Think of accounting ratios as your business's annual physical - they'll show you exactly what's broken. Your inventory turnover might reveal you're hoarding way too much stock. Receivables ratio? That tells you which customers are basically ignoring your invoices (ugh, the absolute worst). Asset ratios show if your equipment is just expensive decoration. Compare your numbers to industry standards and your past performance - that's where the real insights hide. Pick 3-5 ratios that matter most and track them monthly. You'll start noticing patterns pretty quickly, and honestly, those patterns usually scream exactly what needs fixing.
-
Great designs, Easily Editable.
-
Excellent products for quick understanding.