Financial Ratio Analysis And Interpretation Powerpoint Presentation Slides
Once you have got your hands on the financial statements of your company, you’ll need to know exactly how to analyse and interpret it. This is where our content-ready financial ratio analysis and interpretation PowerPoint presentation slides will be useful. The financial analysis PowerPoint designs cover ratio analysis in the form of dashboards, timelines, graphs and line charts. Our predesigned PPT templates give emphasis on investment valuation ratios, comparison of financial data, budgeting and forecasting. These presentation visuals can also be used for accounting analysis, financial modelling, market value ratio analysis, liquidity ratio analysis, balance sheet reports, and more. Over the years, analysts have developed myriad of tools and techniques which serves as the basis for financial statement analysis. So, download our financial ratio analysis and interpretation PowerPoint presentation slides right away to get full advantage of the financial statement. Counter the factors delaying decisions with our Financial Ratio Analysis And Interpretation Powerpoint Presentation Slides. Identify the exact dilemma existing.
Once you have got your hands on the financial statements of your company, you’ll need to know exactly how to analyse and i..
- Google Slides is a new FREE Presentation software from Google.
- All our content is 100% compatible with Google Slides.
- Just download our designs, and upload them to Google Slides and they will work automatically.
- Amaze your audience with SlideTeam and Google Slides.
-
Want Changes to This PPT Slide? Check out our Presentation Design Services
- WideScreen Aspect ratio is becoming a very popular format. When you download this product, the downloaded ZIP will contain this product in both standard and widescreen format.
-

- Some older products that we have may only be in standard format, but they can easily be converted to widescreen.
- To do this, please open the SlideTeam product in Powerpoint, and go to
- Design ( On the top bar) -> Page Setup -> and select "On-screen Show (16:9)” in the drop down for "Slides Sized for".
- The slide or theme will change to widescreen, and all graphics will adjust automatically. You can similarly convert our content to any other desired screen aspect ratio.
Compatible With Google Slides

Get This In WideScreen
You must be logged in to download this presentation.
PowerPoint presentation slides
100% editable slides let you edit them to the way you want. A total of 25 deeply researched slides. Instant download option lets you download with a click. Standard and widescreen mode compatibility. Can be viewed in Google Slides also. Suitable for financial department, analysts, business leaders and organisations.The stages in this process are accounting ratio, financial statement, financial ratio analysis and interpretation.
People who downloaded this PowerPoint presentation also viewed the following :
Content of this Powerpoint Presentation
Slide 1: This slide introduces Financial Ratio Analysis And Interpretation. State your company name and get started.
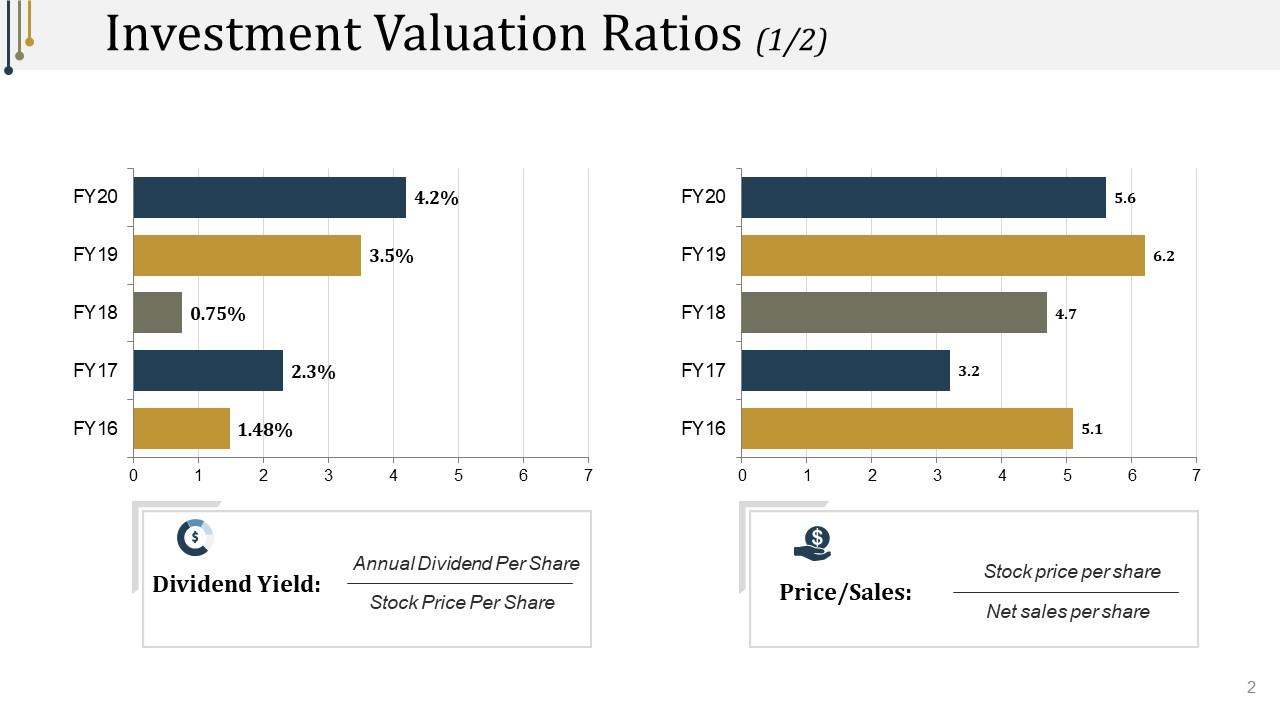
Slide 2: This slide showcases Investment Valuation Ratios. Add the data and use it accordingly.
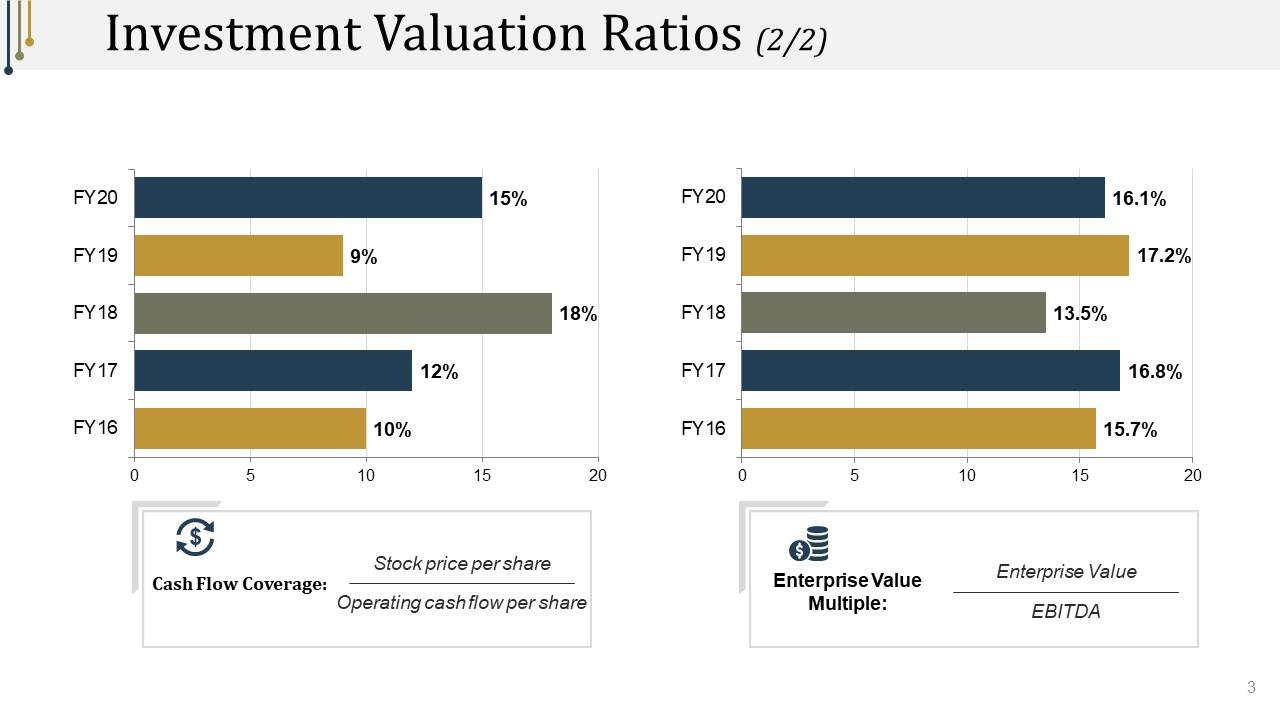
Slide 3: This slide presents Investment Valuation Ratios. You can add the data and compare it as per your need.
Slide 4: This slide is titled Additional Slides.
Slide 5: This slide represents Our Mission. State your mission, goals etc.
Slide 6: This slide showcases Our Team with Name and Designation to fill.
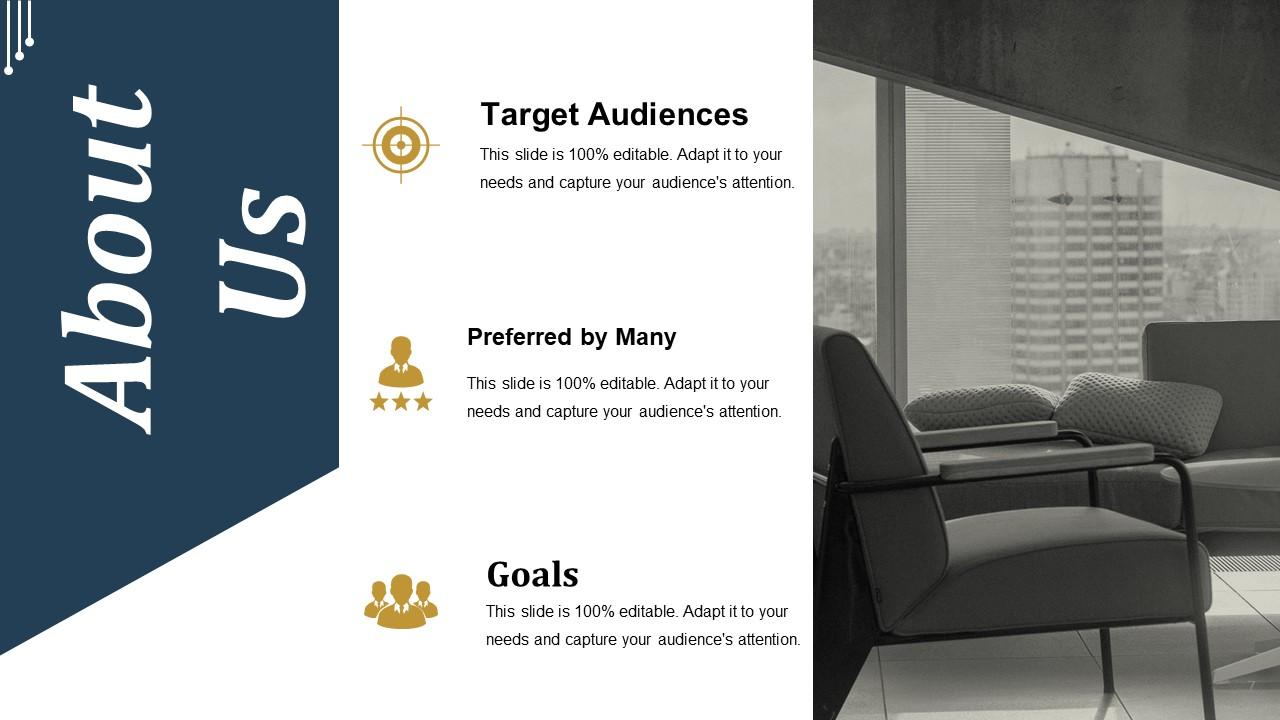
Slide 7: This is an About Us slide. State company or team specifications here.
Slide 8: This slide shows Our Goals for your company.
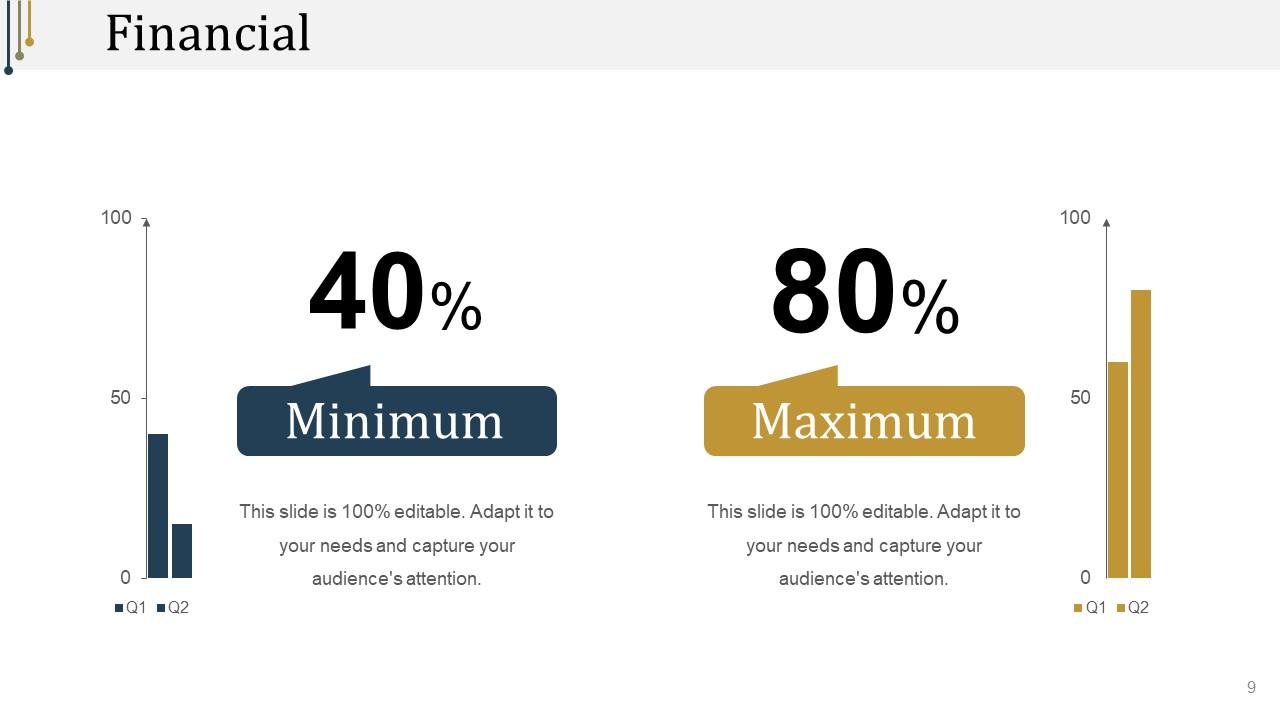
Slide 9: This slide displays Financial Projections And Key Metrics for customers and employees.
Slide 10: This is a Business Quotes slide to quote something you believe in.
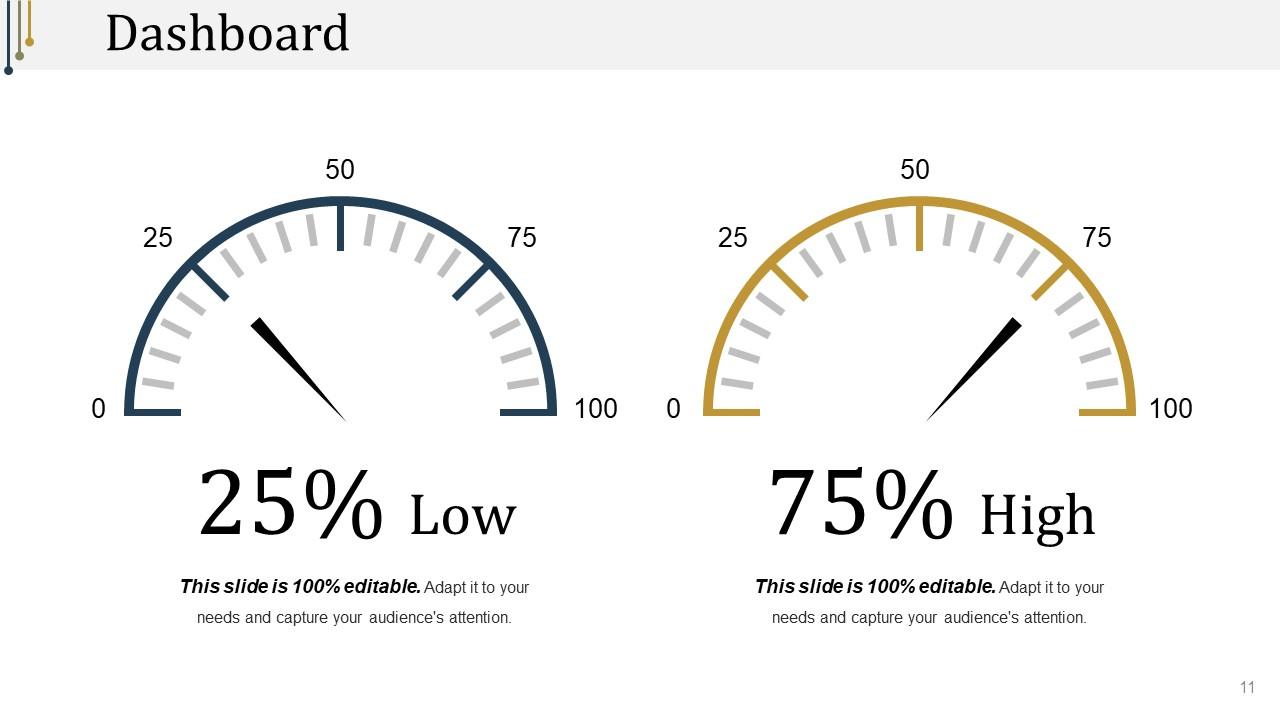
Slide 11: This is a Dashboard slide to show- Strategic System, Success, Goal Process, Sales Review, Communication Study.
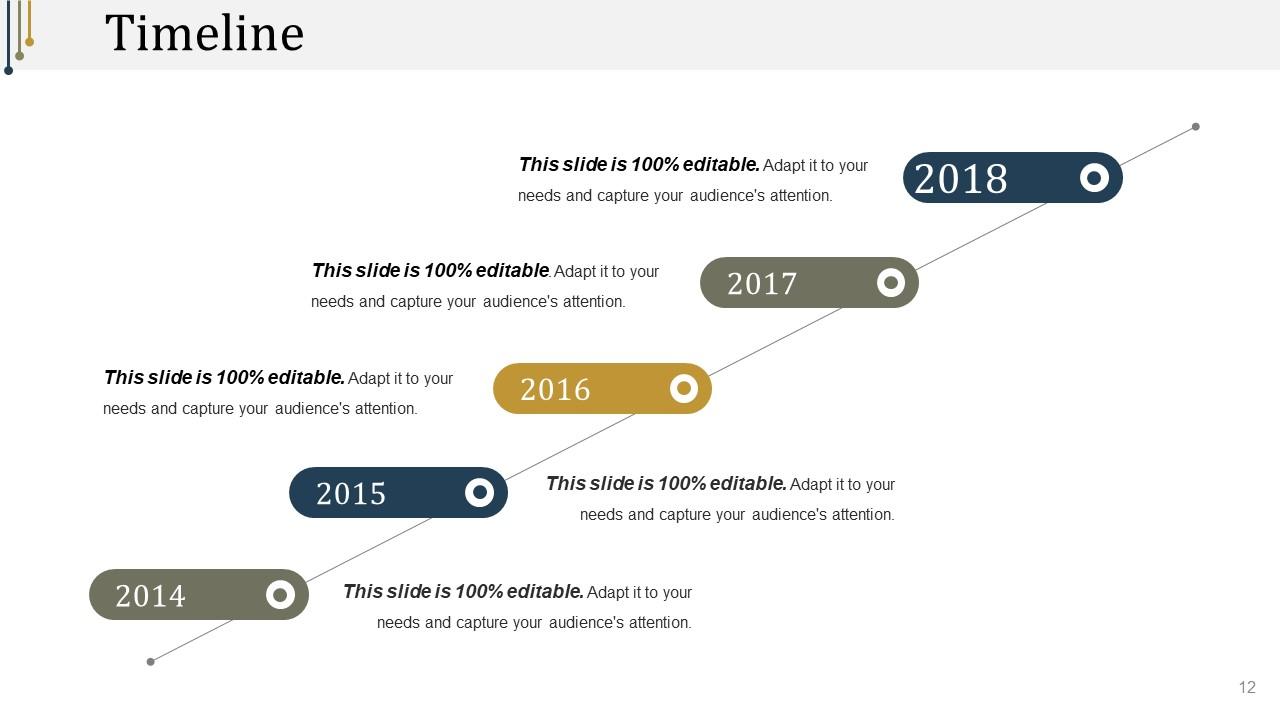
Slide 12: This is a Timelines slide to show- Plan, Budget, Schedule, Review.
Slide 13: This slide shows Coffee Break image.
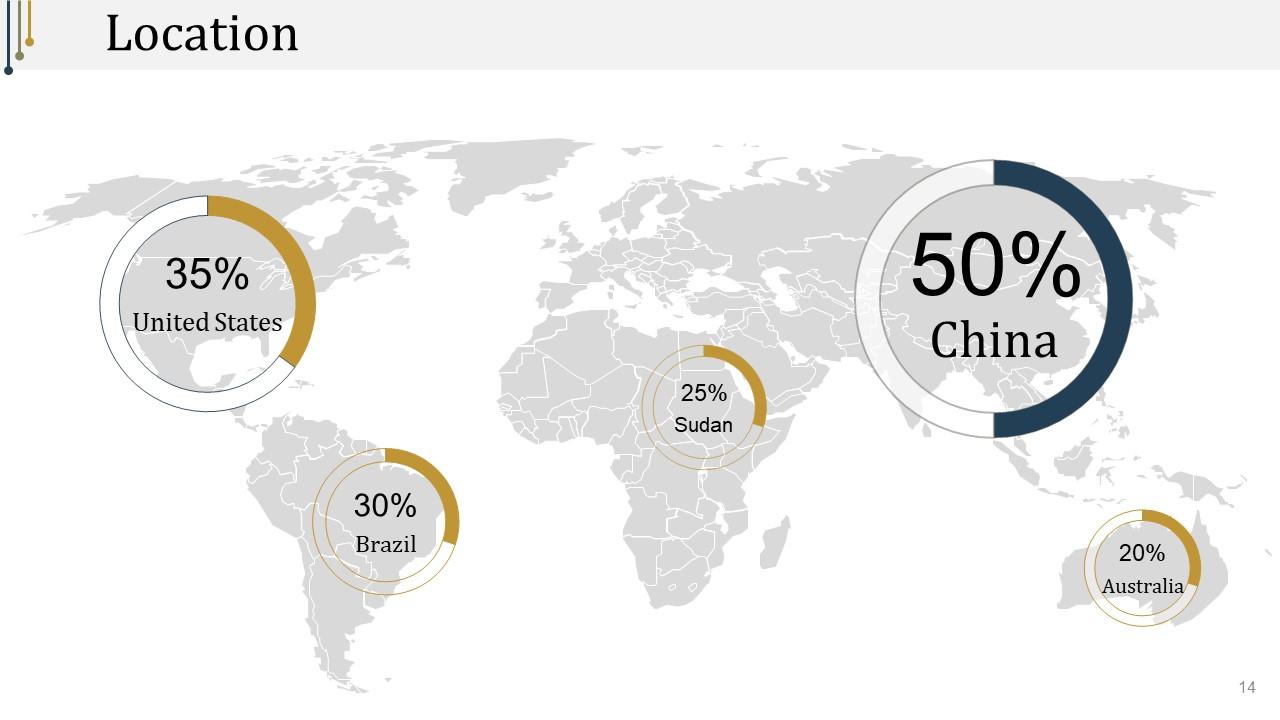
Slide 14: This slide showcases Global Project Locations with a World map and text boxes to make it explicit.
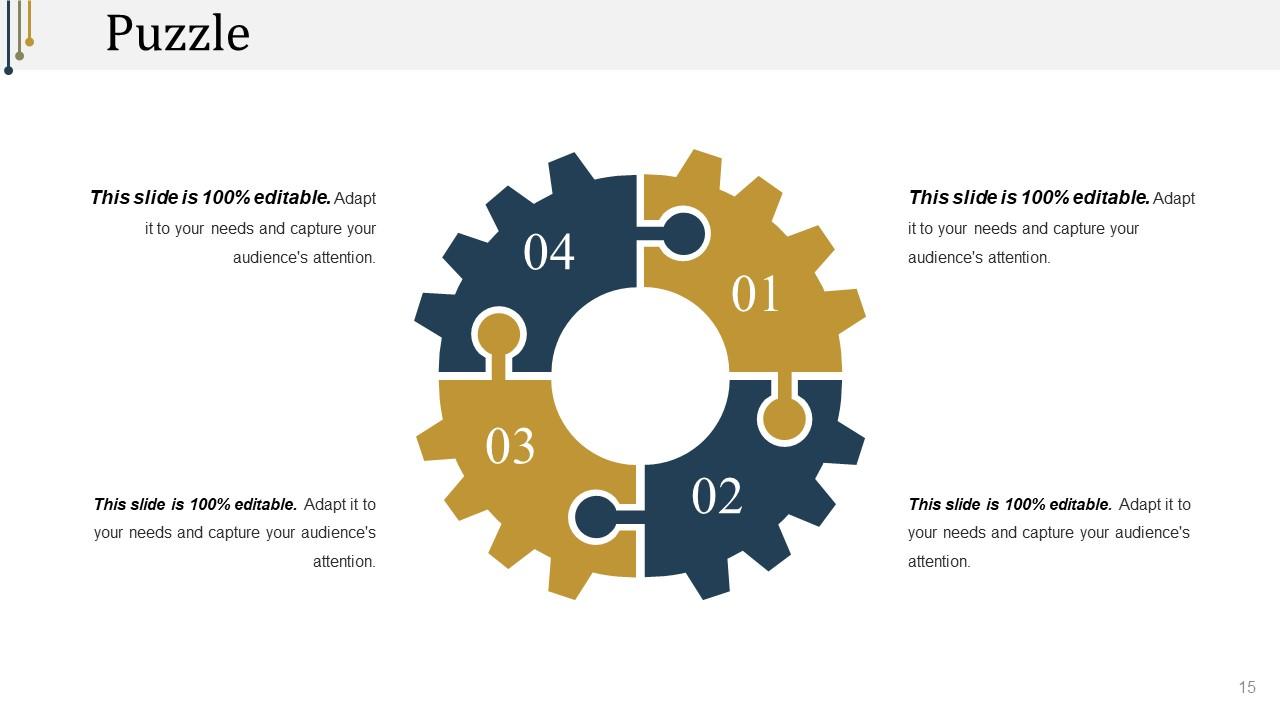
Slide 15: This slide presents a puzzle slide with the following subheadings- Integrity and Judgment, Critical and Decision Making, Leadership, Agility
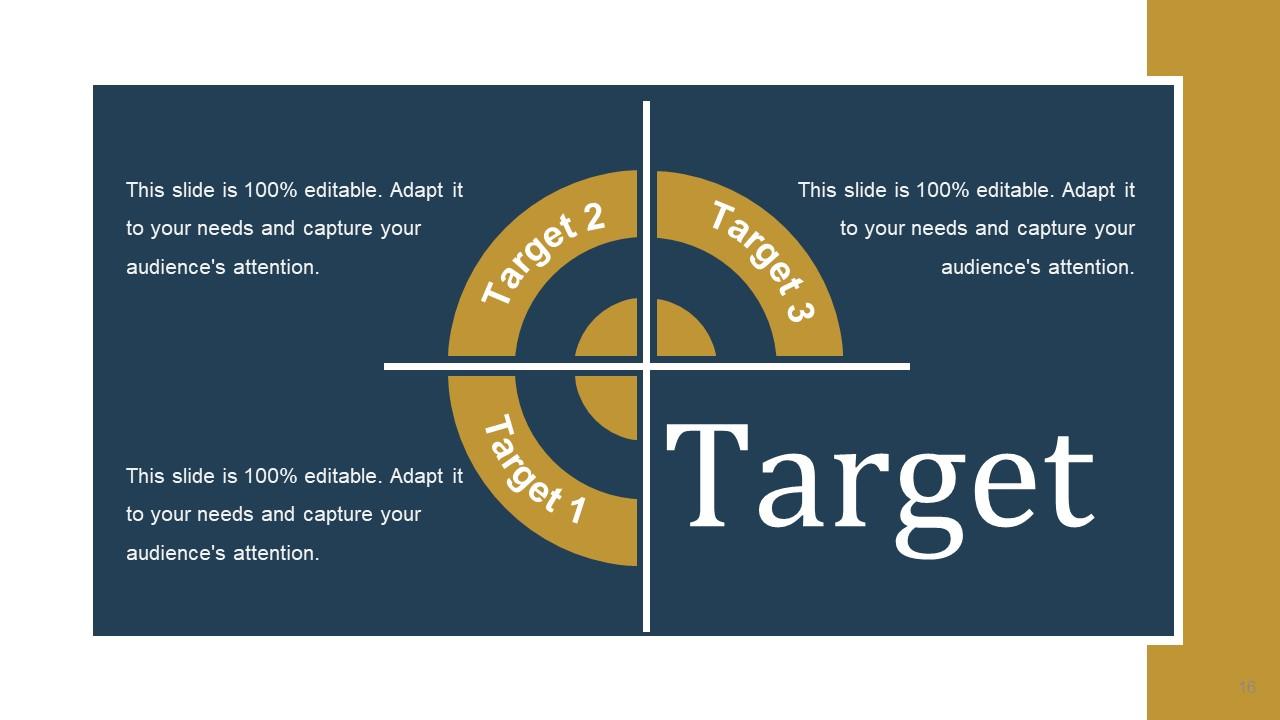
Slide 16: This is a Target slide. State your targets here.
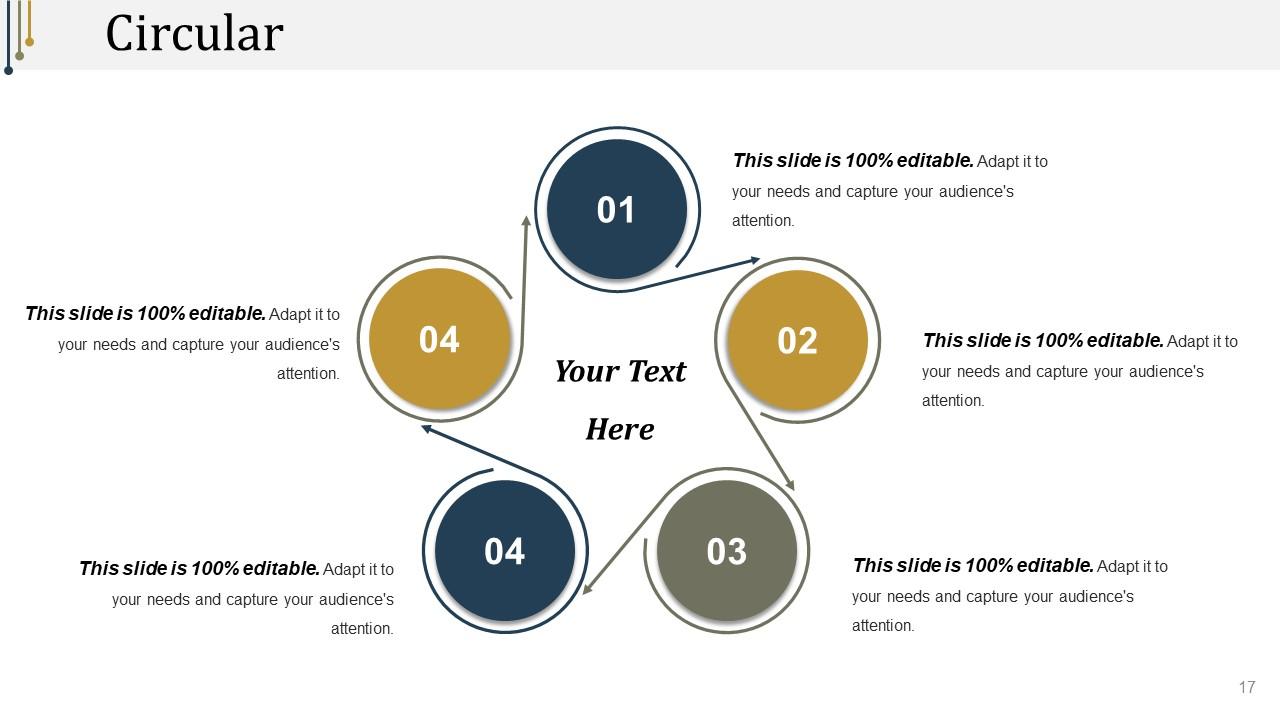
Slide 17: This is a Circular slide to show information, specification etc.
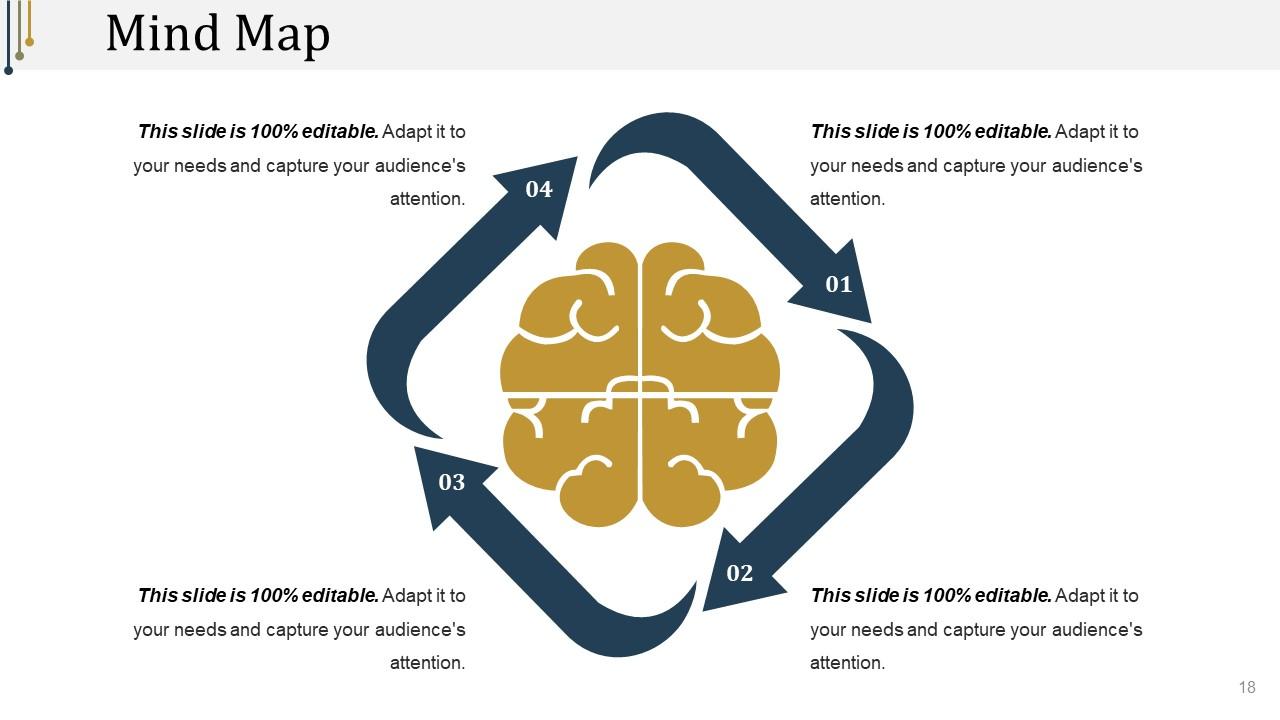
Slide 18: This slide presents a Mind map with text boxes.
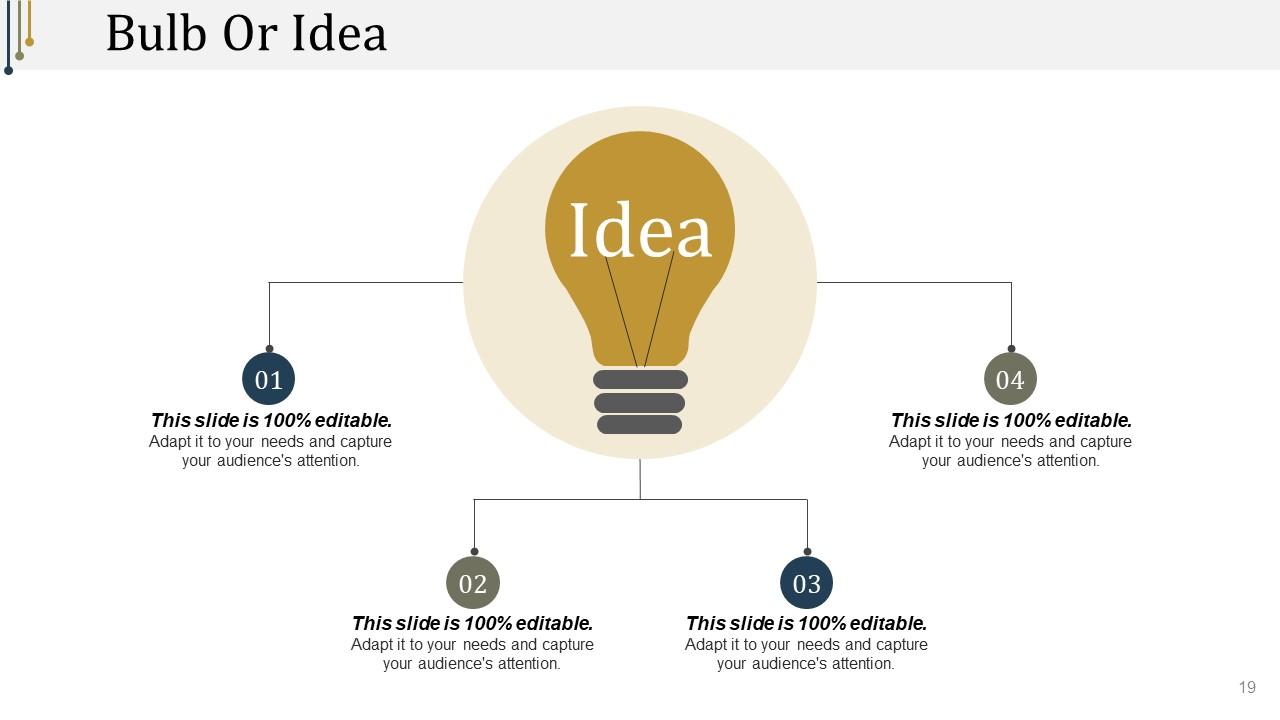
Slide 19: This is a Bulb/idea image slide to show information, ideas, innovation specific stuff etc.
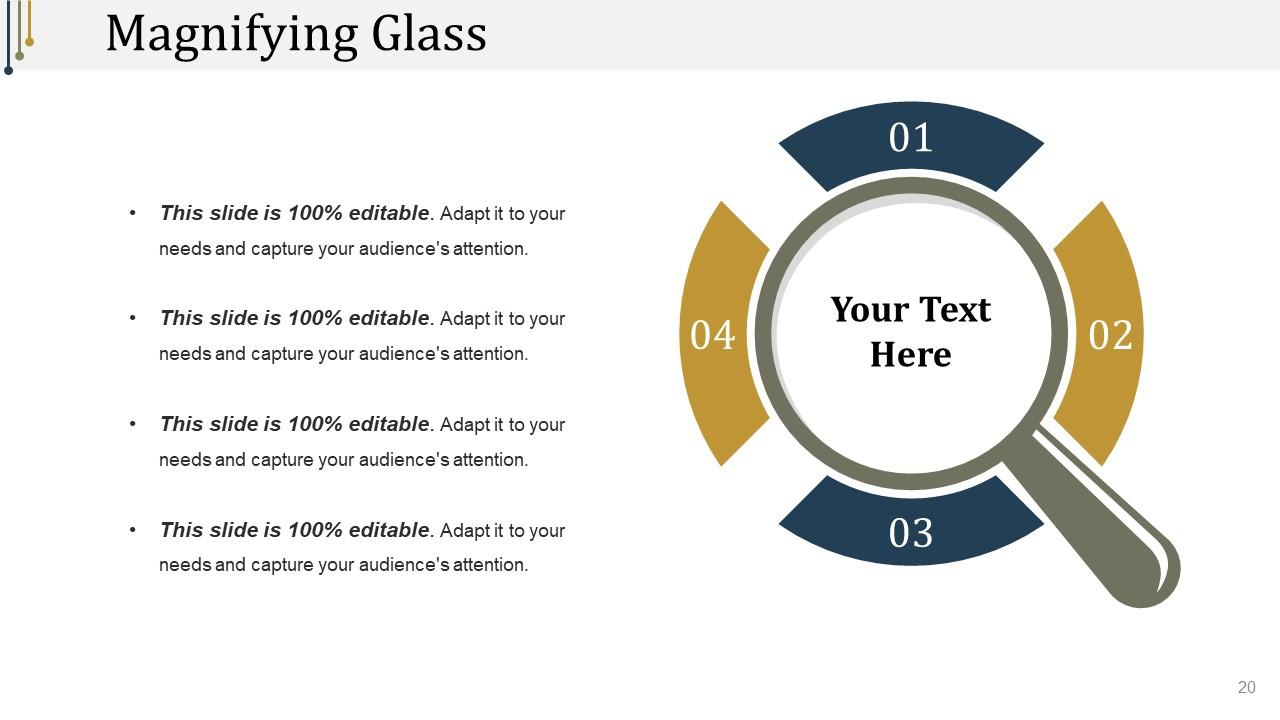
Slide 20: This is a Magnifying glass image slide to show information, scoping aspects etc.
Slide 21: This slide displays the title Charts & Graphs.
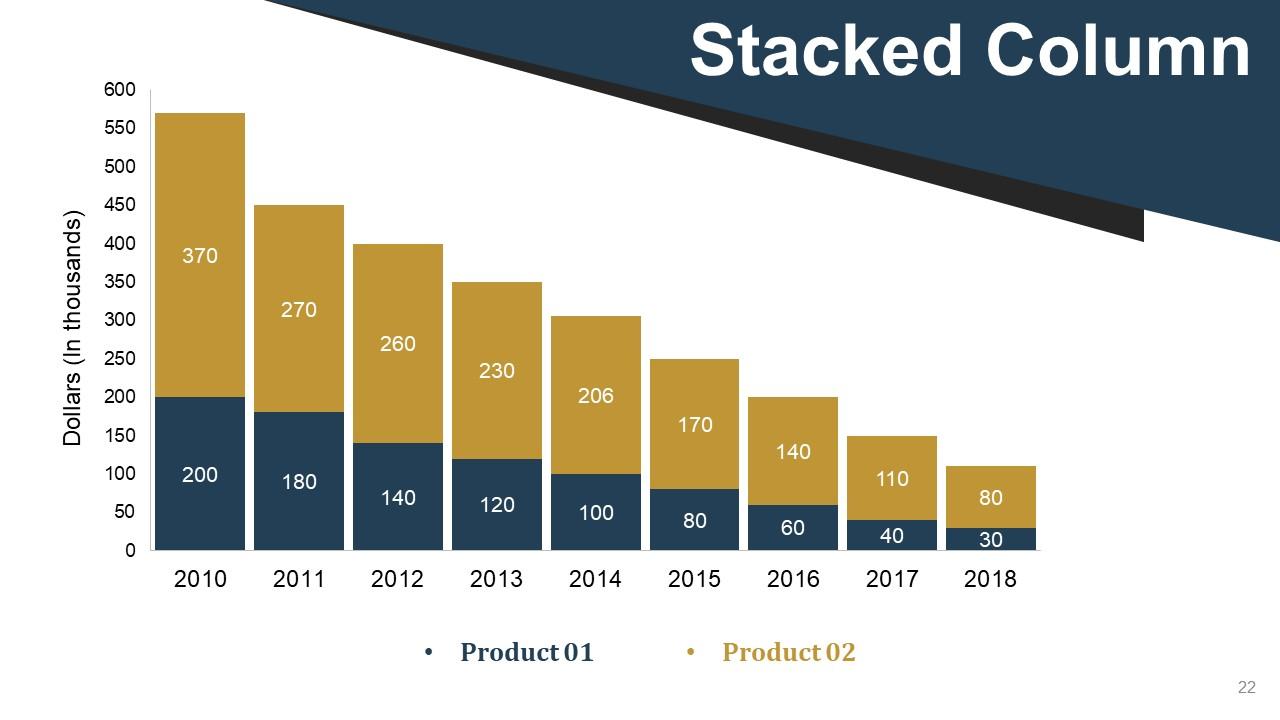
Slide 22: This slide shows a Stacked Line graph in terms of percentage and years for comparison of Product 01, Product 02, Product 03 etc.
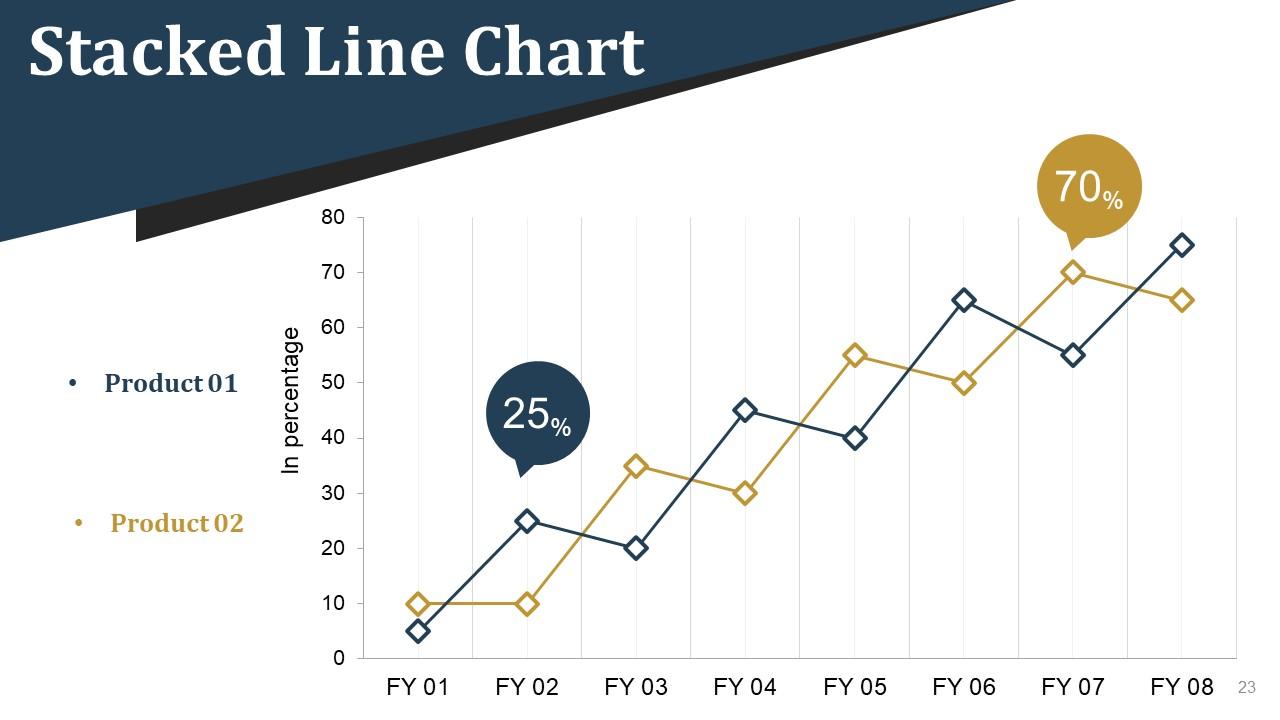
Slide 23: This slide shows a Stacked Line graph in terms of percentage comparison of Product 01, Product 02.
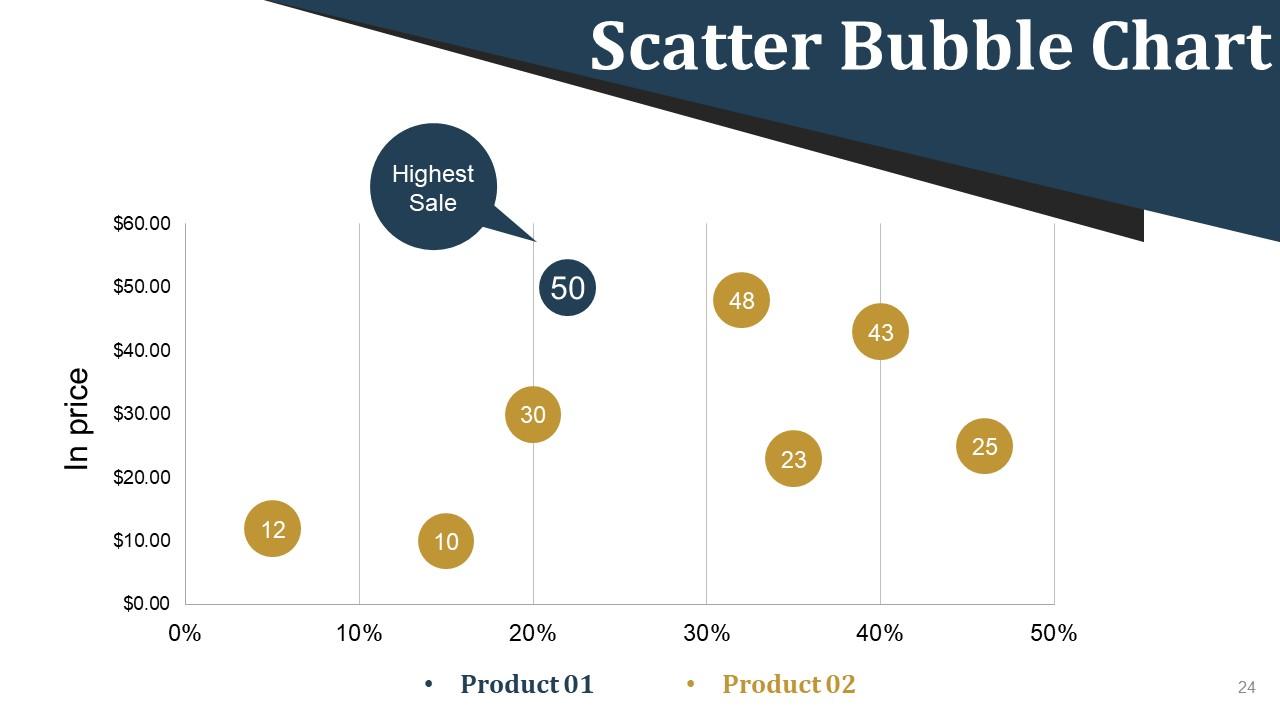
Slide 24: This slide shows Competitive Analysis with Scatter Chart/Radar Chart to compare.
Slide 25: This is a Thank You slide with Address# street number, city, state, Contact Numbers, Email Address.
Financial Ratio Analysis And Interpretation Powerpoint Presentation Slides with all 25 slides:
Our Financial Ratio Analysis And Interpretation Powerpoint Presentation Slides get you all the clearances. Approvals come in from all around.
-
Perfect template with attractive color combination.
-
Graphics are very appealing to eyes.


