


Operational Efficiency Ratios Powerpoint Presentation Slides





Try Before you Buy Download Free Sample Product
 Impress Your
 Audience
 100%
100% Editable
 Save Hours
 of Time


Operational Efficiency Ratios PowerPoint Presentation Slides are ideal to present efficiency of company management. In today’s competitive market world managers are required to track performances without going through a pile of paperwork, our professional slides can assist them to overview operations in a visual and easy manner. Management efficiency PowerPoint template is a useful presentation for the business professionals that contains slides like inventory ratios, company target, sales dashboard, business timeline, financial ratio, operating ratio etc. All of them are arranged in the profession looking layout. Dashboard given in this deck can be used to present critical interrelated indicators. This financial efficiency ratio PowerPoint design also fits well with business concepts such as ratio analysis, liquidity and profitability, financial management and many more. Download turnover ratio PowerPoint complete deck to compare operating expense to net sales. Folks feel jovial due to our Operational Efficiency Ratios Powerpoint Presentation Slides. Present boring ratios in a new and creative manner.
People who downloaded this PowerPoint presentation also viewed the following :
Content of this Powerpoint Presentation
Slide 1: This is an introductory slide for Operational Efficiency Ratios.
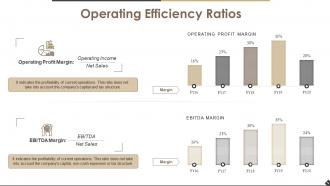
Slide 2: This slide presents Operating Efficiency Ratios with the following sub headings- Operating Profit Margin, EBITDA Margin.
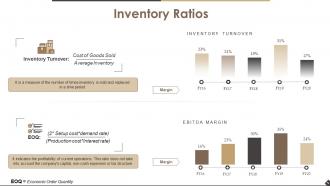
Slide 3: This slide shows Inventory Ratios with Inventory Turnover and EOQ (Economic Order Quantity).
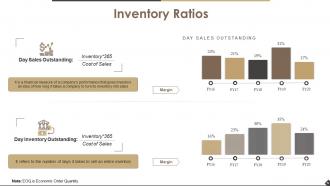
Slide 4: This slide shows Inventory Ratios with subheadings of- Day Sales Outstanding and Day Inventory Outstanding.
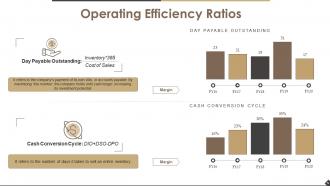
Slide 5: This slide shows Operating Efficiency Ratios with the following subheadings- Day Payable Outstanding and Cash Conversion cycle.
Slide 6: This is a Coffee Break slide to halt.
Slide 7: This slide is titled Additional slides to move forward.
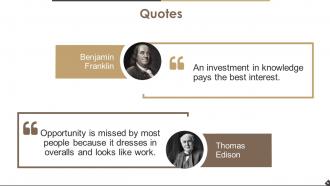
Slide 8: This is a Quotes slide. State any highlighting factor, values through Quote.
Slide 9: This slide presents Our Team with name, image & text boxes.
Slide 10: This is Our Vision slide showing Vision, Mission and Goals. State them here.
Slide 11: This is an About Us slide. State about your company team, company essentials, highlights etc. here.
Slide 12: This is an Our Goal slide. State your goals here.
Slide 13: This is a Target slide. State your targets etc. here.
Slide 14: This slide shows a Bulb or Idea. State creative, innovative aspects etc. here.
Slide 15: This is a Venn diagram slide. Show information, etc. here.
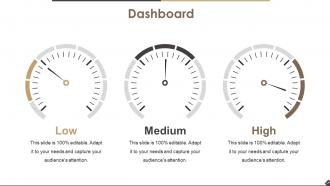
Slide 16: This is a Dashboard slide. Present High Low and Medium aspects etc. here.
Slide 17: This is a Time Line slide to show company/product growth, position, milestones etc.
Slide 18: This is a Bar Graph titled heading slide. Edit as per your requirement.
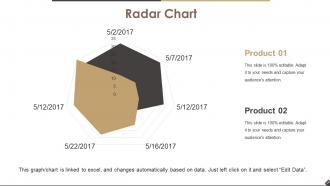
Slide 19: This is a Radar Chart to show product comparison.
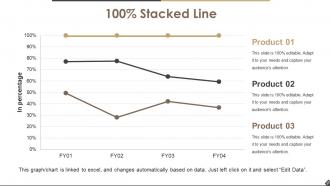
Slide 20: This slide shows a Stacked Line for product perfomance etc.
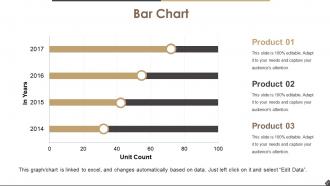
Slide 21: This is a Bar Chart to showcase product comparison.
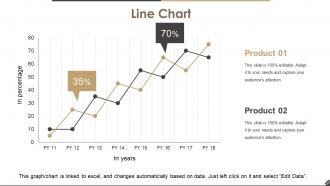
Slide 22: This slide presents a Line Chart for showcasing product/company growth etc.
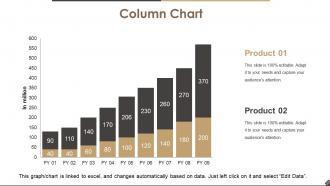
Slide 23: This slide shows a Column Chart for product comparison etc.
Slide 24: This is a Thank You slide with Address:# Street Number, City, State, Contact Number, Email Address.
Operational Efficiency Ratios Powerpoint Presentation Slides with all 24 slides:
Broaden the database with our Operational Efficiency Ratios Powerpoint Presentation Slides. Get a bigger bandwidth to choose from.








FAQs for Operational Efficiency Ratios
Okay so the big ones you wanna track are inventory turnover, receivables turnover, payables turnover, and asset turnover. These are different from profit margins or cash flow stuff - they actually show how well you're running day-to-day operations. Are you sitting on too much inventory? Collecting payments fast enough? Getting decent returns from your assets? That kind of thing. Honestly, they're way more practical than some of the fancy financial metrics people obsess over. Start by comparing yours to industry averages so you know where you stand.
Look, these efficiency ratios are basically your way to catch where you're hemorrhaging cash or wasting time. Track stuff like inventory turnover and how well you're actually using your assets - the data will call out problems even when everything seems fine on the surface. I'd honestly just pick 2-3 ratios that match your biggest pain points and check them weekly. Compare against industry standards and your own past numbers to figure out what needs fixing first. The whole point is turning those numbers into actual fixes, not just staring at fancy charts all day.
Look, operational efficiency ratios are basically your report card for how you're doing against competitors. You take metrics like asset turnover, inventory turnover, receivables turnover - then see where you're winning and where you're getting beat. Pretty straightforward stuff. Just make sure you're comparing apples to apples though - a tech startup's ratios will look totally different from some massive manufacturing company. Honestly, I'd grab financials from your top 3-5 competitors and run the same calculations you do internally. That'll show you exactly where you stand.
Honestly, just focus on 3-4 ratios each month - inventory turnover, receivables turnover, and asset turnover. They'll show you exactly where your cash is getting stuck. Don't overthink the tools at first; a basic spreadsheet works fine (I learned this the hard way after buying expensive software too early). Compare your numbers to industry standards and your own past performance. The real value comes when you actually act on what you find - maybe you need less inventory sitting around, or tighter payment terms. Some months will be better than others, but consistency is what matters. Keep it simple and you'll spot problems way earlier.
Here's the thing - those ratios only show internal stuff. Great inventory turnover? Cool, but what if customers hate you and you're losing market share? The ratios won't reveal that mess. They're also backward-looking, so you're basically driving by checking your rearview mirror. Plus they miss the soft stuff - like whether your team actually wants to work there or if you've got any decent ideas in the pipeline. Honestly, I'd use them alongside customer data and some forward-looking metrics. Don't rely on them alone.
Hey! So operational efficiency ratios are basically your company's report card - they show where money's going and if you're getting good bang for your buck. Look at stuff like inventory turnover, how fast you collect receivables, asset usage, that kind of thing. When these start dropping or you're way behind competitors, that's when you know something's off. Honestly, I think of it like getting bloodwork done - catches problems early. Calculate the main ones every month, then focus on whatever looks worst first. That's usually where the biggest savings are hiding anyway.
Tech upgrades are amazing for operational ratios once they're running smoothly. Your asset turnover and inventory numbers will look way better with automated processes and fewer screw-ups. Here's the catch though - they'll actually make your ratios worse at first. All that upfront spending plus your team figuring things out creates a temporary mess. I learned this the hard way at my last job. Most companies bounce back strong after 6-12 months once everyone gets comfortable with the new systems. Honestly, just track everything monthly during rollout so you know when you've turned the corner.
Monthly at minimum, but weekly's way better if you can swing it. Most places I know do deep monthly reviews plus quick weekly check-ins on their most critical stuff. Efficiency problems have this annoying habit of spiraling fast when you're not watching. Honestly? I'd rather check too often than get blindsided by something major. Set up automated reports if you can - total lifesaver timewise. Maybe start monthly and then bump up the frequency for anything that directly hits your revenue or makes customers unhappy.
Don't fall into the trap of comparing your ratios to random industries - like, your inventory turnover will obviously suck next to a grocery store if you're making heavy equipment. That's just how it works. Single period numbers are pretty useless too, especially for seasonal businesses that swing all over the place. Here's what really gets people: they see a dropping asset turnover ratio and panic, but maybe you just bought new equipment that'll pay off later. I always tell people to stick with industry benchmarks and track trends over several quarters instead of freaking out over one snapshot.
Manufacturing companies need tons of inventory and heavy equipment, so their inventory turnover is usually high but asset turnover? Not so much. Service businesses are the opposite - consulting firms can make serious money without owning much physical stuff, so their asset turnover rocks. Receivables turnover tends to be higher too. Honestly, comparing a factory to a consulting firm is pretty pointless. You'll get way better insights if you stick to comparing your ratios against similar companies in your industry. Otherwise you're just setting yourself up for confusion.
Look, operational efficiency ratios are basically your reality check when everything's going sideways. They'll show you if your inventory turnover is crashing or if you're burning through working capital way too fast. I always tell people to compare current numbers against pre-crisis levels first - gives you the clearest snapshot of what's actually broken. These ratios don't sugarcoat anything when the world feels chaotic. You can figure out which operations need cutting and where to throw your limited resources. Asset utilization dropping? Working capital disappearing? The math will tell you before your gut does.
Honestly? Just build them into your monthly dashboards like any other KPI. Pick maybe 3-4 ratios that actually matter for your business - asset turnover, inventory turnover, whatever fits. Most companies calculate these once for some report and never look again, which is nuts. Track them monthly, set real targets, and - here's the key part - break them down by department so managers can see how their stuff affects the big picture. I'd tie executive bonuses to hitting efficiency targets too. Oh, and definitely benchmark against competitors when you can. It's way more useful than people think for spotting where you're bleeding money.
Honestly, start with the boring stuff that's killing your time - automate whatever repetitive tasks you can. Then check if you're staffing things weird, like having too many people in one spot while another team is drowning. It really is like organizational Tetris, which sounds dumb but it's true. Get your team leads tracking the important numbers weekly instead of waiting months to see what's happening. That's where you'll actually catch problems before they spiral. Performance reviews of your key metrics should be regular too - trends are way easier to fix early.
Look, these ratios are basically your early warning system for when stuff's going sideways. If inventory turnover starts tanking, you know to either speed up sales or stop buying so much crap. Asset utilization shows whether your warehouses and equipment are actually earning their keep - and trust me, the results can be pretty shocking. Receivables turnover? That tells you if customers are being slow payers, which screws up your cash flow when it's time to pay suppliers. I check mine monthly now. Catching trends early means you can tweak supplier deals or inventory levels before small problems turn into budget nightmares.
Yeah, there's definitely a connection there. Better operational efficiency usually means happier customers - makes sense when you think about it. Faster inventory turnover and smoother processes = shorter wait times and fewer "sorry, we're out of stock" moments. I've seen this play out where companies fix their backend stuff and boom, customer satisfaction scores jump up too. It's almost predictable at this point. The trick is tracking both metrics side by side since they tend to move together. Oh, and definitely dig into which specific efficiency issues are causing your biggest customer headaches first.
-
Very unique, user-friendly presentation interface.
-
Really like the color and design of the presentation.