


Operational planning powerpoint presentation slides


Try Before you Buy Download Free Sample Product
 Impress Your
 Audience
Editable
of Time


Select our content ready Operational Planning PowerPoint Presentation Slides to represent elements of tactical planning. With the help of this visually appealing integrated business planning presentation deck, you can demonstrate quality standards, desired outcomes, staffing & resources requirements, implementation timetables, the process of monitoring progress, etc. Incorporate professionally designed business operating plan PPT deck to analyze the utilization of financial resources and management. Furthermore, the easy- to- use strategic business plan PowerPoint complete deck contains self-explanatory templates such as Executive summary, vision & mission, operational highlights, milestone achieved, key performance indicators, financial summary, business operating plan, operating plan initiatives, operational challenges, team goals, hiring plan, sources of revenue, product roadmap, risk & mitigation plan etc. Create a roadmap of day to day operations & provide the clear picture of team’s tasks & responsibilities using easy-to-understand operational management presentation graphics. Download the professional-looking business planning PPT visuals to represent the process of planning strategic goals. Boost the chances of consensus with our Operational Planning Powerpoint Presentation Slides. Focus on factors that foster agreement.
People who downloaded this PowerPoint presentation also viewed the following :
Content of this Powerpoint Presentation
Slide 1: This slide introduces Operational Planning. State Your Company Name and begin.
Slide 2: This slide shows Content of the presentation.
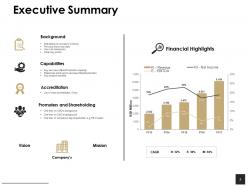
Slide 3: This slide presents Executive Summary describing- Background, Capabilities, Accreditation, Promoters and Shareholding.
Slide 4: This slide displays Our Vision and Mission with related imagery and text.
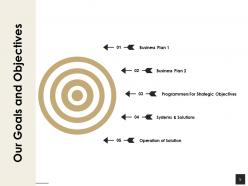
Slide 5: This slide presents Our Goals and Objectives with these of the following stages- Business Plan, System and Solutions, Programmers for Strategic Objectives, Business Plan, Operation of Solution.
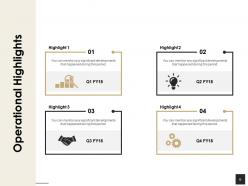
Slide 6: This slide represents Operational Highlights in a timeline form.
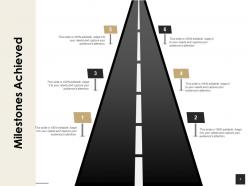
Slide 7: This slide showcases Milestones Achieved.
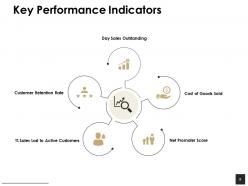
Slide 8: This slide presents Key Performance Indicators which further showcases- Cost of Goods Sold, Net Promoter Score, % Sales Lost to Active Customers, Customer Retention Rate, Day Sales Outstanding.
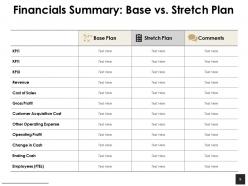
Slide 9: This slide shows Financials Summary: Base vs. Stretch Plan.
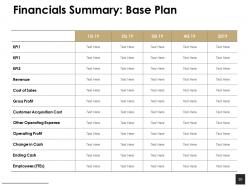
Slide 10: This slide presents Financials Summary: Base Plan.
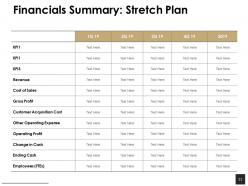
Slide 11: This slide represents Financials Summary: Stretch Plan.
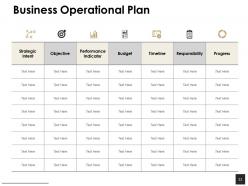
Slide 12: This slide displays Business Operational Plan with categories as- Strategic intent, Objective, performance indicator, Budget, Timeline etc.
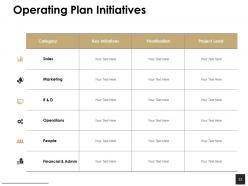
Slide 13: This slide showcases Operating Plan Initiatives in a tabular form with categories, Key initiatives, Prioritization and project leads.
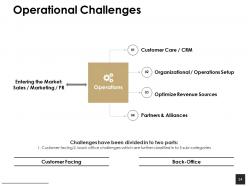
Slide 14: This slide is titled as Operational Challenges which further showcases- Customer Facing, Back-Office, Operations, Entering the Market, Sales / Marketing / PR, Customer Care / CRM, Partners & Alliances, Organizational / Operations Setup, Optimize Revenue Sources.
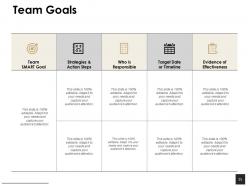
Slide 15: This slide shows Team Goals with a table for different areas.
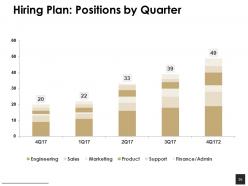
Slide 16: This slide presents Hiring Plan: Positions by Quarter in a graph form with categories as- Finance, support, product and marketing.
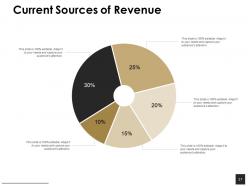
Slide 17: This slide shows Current Sources of Revenue with additional text boxes.
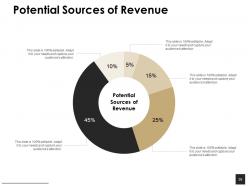
Slide 18: This slide presents Potential Sources of Revenue with the help of pie chart.
Slide 19: This slide displays Product Roadmap with text boxes to show information.
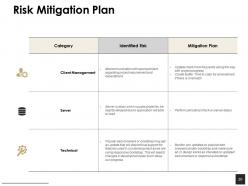
Slide 20: This slide represents Risk Mitigation Plan with Category, Identified risk and mitigation plan.
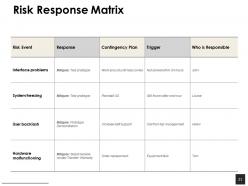
Slide 21: This slide showcases Risk Response Matrix with categories as- Risk event, response, trigger etc.
Slide 22: This slide displays icons for Operational Planning.
Slide 23: This slide reminds about 15 minutes coffee break.
Slide 24: This slide is titled as Additional Slides for moving forward.
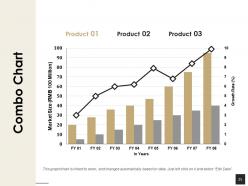
Slide 25: This slide shows Combo Chart with three products comparison.
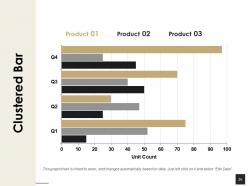
Slide 26: This slide presents Clustered Bar Chart with three products comparison.
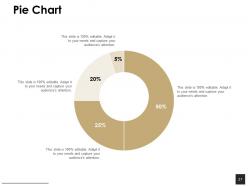
Slide 27: This slide displays Pie Chart with data in percentage.
Slide 28: This is Our Team slide with names and designation.
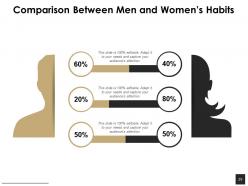
Slide 29: This is a Comparison slide to state comparison between commodities, entities etc.
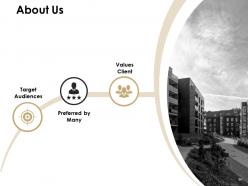
Slide 30: This is About Us slide to show company specifications etc.
Slide 31: This is a Venn slide with text boxes.
Slide 32: This is a Quotes slide to convey message, beliefs etc.
Slide 33: This is a Comparison slide to state comparison between commodities, entities etc.
Slide 34: This is an Idea Generation slide to state a new idea or highlight information, specifications etc.
Slide 35: This slide is titled as Post it. Post your important notes here.
Slide 36: This is a Puzzle slide with text boxes to show information.
Slide 37: This is a Target slide. State your targets here.
Slide 38: This slide shows Mind Map for representing entities.
Slide 39: This is Our Goal slide. Show your firm's goals here.
Slide 40: This is a Thank You slide with address, contact numbers and email address.
Operational planning powerpoint presentation slides with all 40 slides:
Use our Operational Planning Powerpoint Presentation Slides to effectively help you save your valuable time. They are readymade to fit into any presentation structure.
-

Operational planning powerpoint presentation slides
-
Operational planning powerpoint presentation slides
-
Operational planning powerpoint presentation slides
-

Operational planning powerpoint presentation slides
-
Operational planning powerpoint presentation slides
-
Operational planning powerpoint presentation slides
-
Operational planning powerpoint presentation slides
-
Operational planning powerpoint presentation slides
-
Operational planning powerpoint presentation slides
-
Operational planning powerpoint presentation slides
-
Operational planning powerpoint presentation slides
-
Operational planning powerpoint presentation slides
-
Operational planning powerpoint presentation slides
-
Operational planning powerpoint presentation slides
-
Operational planning powerpoint presentation slides
-
Operational planning powerpoint presentation slides
-
Operational planning powerpoint presentation slides
-
Operational planning powerpoint presentation slides
-

Operational planning powerpoint presentation slides
-
Operational planning powerpoint presentation slides
-
Operational planning powerpoint presentation slides
-
Operational planning powerpoint presentation slides
-

Operational planning powerpoint presentation slides
-

Operational planning powerpoint presentation slides
-
Operational planning powerpoint presentation slides
-
Operational planning powerpoint presentation slides
-
Operational planning powerpoint presentation slides
-

Operational planning powerpoint presentation slides
-
Operational planning powerpoint presentation slides
-
Operational planning powerpoint presentation slides
-
Operational planning powerpoint presentation slides
-

Operational planning powerpoint presentation slides
-

Operational planning powerpoint presentation slides
-
Operational planning powerpoint presentation slides
-
Operational planning powerpoint presentation slides
-
Operational planning powerpoint presentation slides
-
Operational planning powerpoint presentation slides
-

Operational planning powerpoint presentation slides
-
Operational planning powerpoint presentation slides
-

Operational planning powerpoint presentation slides
FAQs for Operational planning
So you need clear goals first - figure out exactly what you're trying to accomplish. Then break it down into specific steps with deadlines that actually make sense. Assign someone to each task (this is crucial or stuff just falls through cracks). Budget is honestly where most people screw up, so get super detailed there. Set up ways to measure progress and catch problems early. I'd also think through what could go wrong and have backup plans. Oh, and schedule regular check-ins so you're not flying blind. Start with your big picture goals then work backwards - helps you spot all the little things you'd otherwise miss.
Break down each big goal into stuff you can actually measure. Then connect your day-to-day work directly to those targets. Monthly check-ins work well - weekly feels excessive unless your industry changes constantly. Every project should tie back to strategy somehow, otherwise why are you doing it? Build in ways to course-correct because things will go sideways. The whole point is creating that clear line from "here's our vision" down to "here's what Sarah's doing Tuesday." Honestly, most companies skip this step and wonder why nothing sticks.
Honestly, start with KPI dashboards and balanced scorecards - they're game changers for seeing real-time performance vs your actual plans. Gantt charts work great if you've got multiple projects running. Set up automated alerts when your metrics hit certain levels, then do weekly check-ins with your team. The trick is focusing on maybe 3-5 metrics that actually move the needle instead of drowning in data (learned this the hard way lol). Variance analysis reports help too. Just start simple and add more tracking as you go - don't overcomplicate it from day one.
Honestly? I'd say monthly check-ins are the sweet spot, then go deeper every quarter. Markets are crazy right now - stuff changes so fast you can't just set it and forget it. Most teams I know do quick monthly reviews to catch problems early, then quarterly deep dives for the big adjustments. Your industry super volatile? Maybe stick to monthly as standard. Budget shifts, staffing drama, random curveballs... your plan's gotta roll with all that. Block out like 2 hours next month to see how you're tracking. Trust me, waiting too long just makes the adjustments harder.
Dude, you absolutely have to get stakeholders involved from the start. People hate when plans get dropped on them out of nowhere - learned that the hard way at my last job. Get input from whoever's actually doing the work, paying for it, or dealing with the fallout. They'll spot problems you totally missed and give you way better estimates on timing and budget. Map out who really matters first, then set up regular check-ins to gather feedback. Trust me, the extra effort upfront saves you from major headaches later when everything goes sideways.
Honestly, you've gotta build this stuff into your planning from the start - don't wait until things go sideways. During those first planning meetings, map out what could go wrong and figure out who's handling what. I keep a basic risk register that we check every week (sounds boring but trust me, it works). When you're setting timelines and budgets, build in backup plans right away. Oh and make it a regular thing in team meetings - like actually talk about risks weekly instead of pretending they don't exist. Update everything when plans shift. Way easier than scrambling later.
Honestly, it totally depends on what you're trying to accomplish, but I'd stick to three main buckets: efficiency stuff (cycle time, how well you're using resources), quality measures (error rates, whether customers are happy), and the money side (cost per unit, ROI). Too many teams go overboard tracking like 15 different things - it just becomes white noise. You want maybe 3-5 solid KPIs that actually connect to your goals. Mix it up with leading indicators (stuff that predicts if you'll succeed) and lagging ones (what actually happened). Start with defining what winning looks like, then figure out which metrics will tell you that story. Way easier than doing it backwards.
Dude, tech can totally save your butt with operational planning. Start with something simple - maybe a project management app to track where everything's at. Real-time updates alone will cut down on so much back-and-forth nonsense. There's predictive stuff now that'll flag problems before they blow up, which is pretty sweet. Mobile apps keep your field teams in the loop without constant phone calls. AI can help with scheduling too, though that might be overkill at first. Honestly? Pick whatever's driving you crazy right now and find one tool that fixes just that thing.
Ugh, resource constraints are the worst - you're always doing more with less. Plus priorities keep shifting every week, which drives everyone crazy. Communication between teams is a nightmare too because nobody's on the same page about deadlines. Your data's probably incomplete when you need to make big decisions (story of my life). Honestly feels like chaos half the time. But if you build in flexibility upfront and get people talking early, you can roll with the punches better. Still sucks though when everything changes again next month!
Stop treating innovation like it's this separate thing you do "someday." Build it right into how you actually work - block out time for experiments, budget for testing weird ideas, get different teams working together so they can move fast. Companies love talking innovation but then create these insane quarterly plans that crush any creative ideas before they start (drives me nuts honestly). You need structure, sure, but also room to breathe. Make your metrics reward smart risks, not just safe targets. Pick one process this quarter where your team can try something totally different.
Honestly, your team knows stuff you don't see from up there. They'll catch timeline issues and resource problems way before you do. When people help build the plan, they actually care about making it work - basic human nature, right? Your frontline people understand customers better than anyone in meetings does. So get them involved early and don't just pretend to listen. I learned this the hard way when my "perfect" rollout crashed because I missed obvious workflow issues. Short version: their input saves you from major headaches later.
Honestly, focus on nailing down your big goals and deadlines - those can't move. But everything else? Keep it loose. I've watched so many teams completely fall apart because they made these super detailed plans that went to hell the second something unexpected happened. Rolling forecasts work way better than trying to predict a whole year ahead. Also figure out who makes what decisions when stuff inevitably goes wrong. The key is having solid processes that can actually adapt. Oh, and definitely separate what's absolutely set in stone from where you can pivot fast.
Honestly, just pick one format and make everyone use it - same template every time with priorities, deadlines, and ownership. Don't let teams go rogue with their own systems (learned this the hard way). Actually walk through the plans with people instead of just emailing docs. Short meetings work better than long ones. Set up a way for teams to easily flag problems or changes - maybe Slack or whatever you already use. The key thing? Stick to ONE communication channel religiously. Sounds boring but it works way better than having updates scattered everywhere.
So manufacturing is all about making actual stuff - you're dealing with supply chains, inventory, production schedules, that whole thing. Way more predictable honestly. Services though? Total different beast. You can't stockpile a haircut or store customer service for later, so you're constantly juggling staffing, managing how many people show up when, trying to keep quality consistent even though every interaction is different. Manufacturing lets you plan ahead more easily since physical products follow clearer patterns. With services you're basically always adapting because people are... well, unpredictable. Just match your planning style to whether you're making things or dealing directly with customers.
Honestly, data analytics is like putting on glasses for the first time - suddenly you can see what's actually broken in your business instead of just guessing. You'll catch bottlenecks, figure out when demand spikes are coming, and find those sneaky processes that are quietly draining your budget. Real numbers beat gut feelings every time, trust me. It helps with staffing decisions, resource planning, all that stuff. Oh and you can actually fix problems before they turn into total disasters. My advice? Don't go crazy at first - just pick one thing you want to improve and focus your analytics there.
-
Editable templates with innovative design and color combination.
-
Presentation Design is very nice, good work with the content as well.
-
Really like the color and design of the presentation.
-
Qualitative and comprehensive slides.