Actual Vs Budget Variance Powerpoint Presentation Slides
Compare changes in financial performance with our content ready Actual Vs Budget Variance PowerPoint Presentation Slides. Identify financial problems and investigate issues using the topic-specific budget analysis report presentation deck. The professionally designed financial forecasting PowerPoint complete deck includes a set of ready-to-use templates such as actual cost vs budget, month-wise forecasting, overhead cost analysis, quarterly budget analysis, variance analysis, actual vs target variance, budget vs plan vs forecast, forecast and projection, etc. Discuss variance in business statements using plan vs. actual financial performance PPT visuals. Utilize professional looking budget variance analysis PowerPoint templates to figure out why your planned and actual performance doesn’t match. Incorporate variance reporting PowerPoint templates to control current expenditures and future costs. Furthermore, the self-explanatory variance analysis in budgeting PPT slides is also helpful in the financial forecast and planning. Thus, download the budget presentation to create a performance audit report. Our Actual Vs Budget Variance Powerpoint Presentation Slides can carry a heavy burden. You will find they have great capacity.
- Google Slides is a new FREE Presentation software from Google.
- All our content is 100% compatible with Google Slides.
- Just download our designs, and upload them to Google Slides and they will work automatically.
- Amaze your audience with SlideTeam and Google Slides.
-
Want Changes to This PPT Slide? Check out our Presentation Design Services
- WideScreen Aspect ratio is becoming a very popular format. When you download this product, the downloaded ZIP will contain this product in both standard and widescreen format.
-

- Some older products that we have may only be in standard format, but they can easily be converted to widescreen.
- To do this, please open the SlideTeam product in Powerpoint, and go to
- Design ( On the top bar) -> Page Setup -> and select "On-screen Show (16:9)” in the drop down for "Slides Sized for".
- The slide or theme will change to widescreen, and all graphics will adjust automatically. You can similarly convert our content to any other desired screen aspect ratio.
Compatible With Google Slides

Get This In WideScreen
You must be logged in to download this presentation.
PowerPoint presentation slides
Our Actual Vs Budget Variance Powerpoint Presentation Slides presentation deck is a helpful tool to plan & prepare the topic with a clear approach. This PPT deck displays twentyone slides with in-depth research. We provide a ready to use deck with all sorts of relevant topics subtopics templates, charts and graphs, overviews, analysis templates. It showcases all kinds of editable templates. Edit the color, text, font style at your ease. Download PowerPoint templates in both widescreen and standard screen. The presentation is fully supported by Google Slides. It can be easily converted into JPG or PDF format.
People who downloaded this PowerPoint presentation also viewed the following :
Content of this Powerpoint Presentation
Slide 1: This slide introduces Actual vs Budget Variance. State Your Company Name and begin.
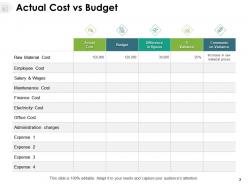
Slide 2: This slide shows Actual Cost vs Budget in tabular form.
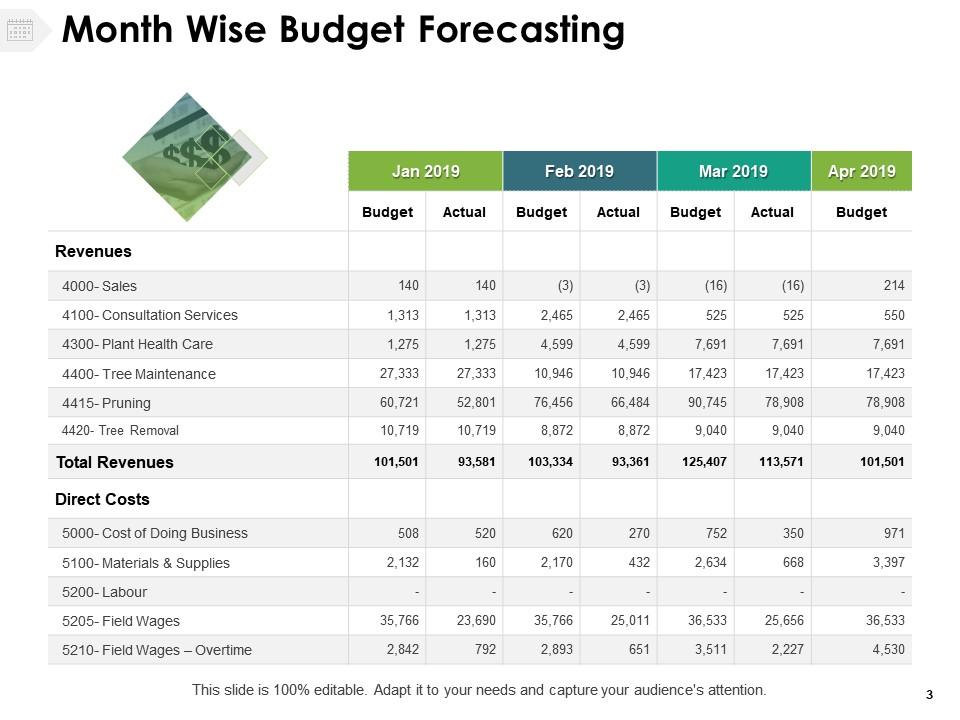
Slide 3: This slide presents Month Wise Budget Forecasting.
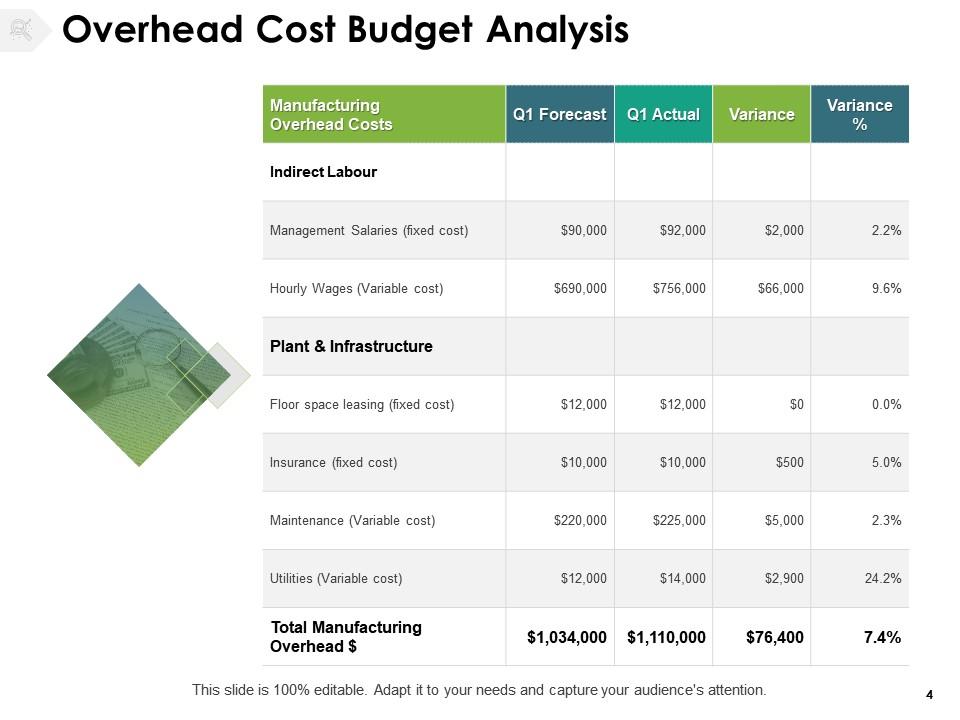
Slide 4: This slide displays Overhead Cost Budget Analysis.
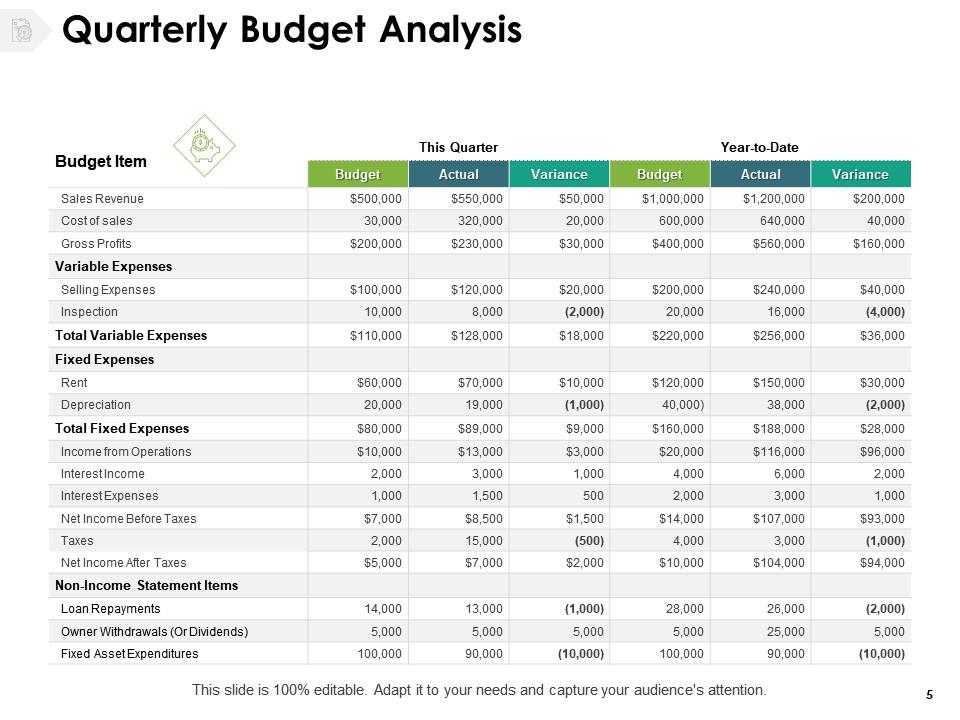
Slide 5: This slide represents Quarterly Budget Analysis in tabular form.
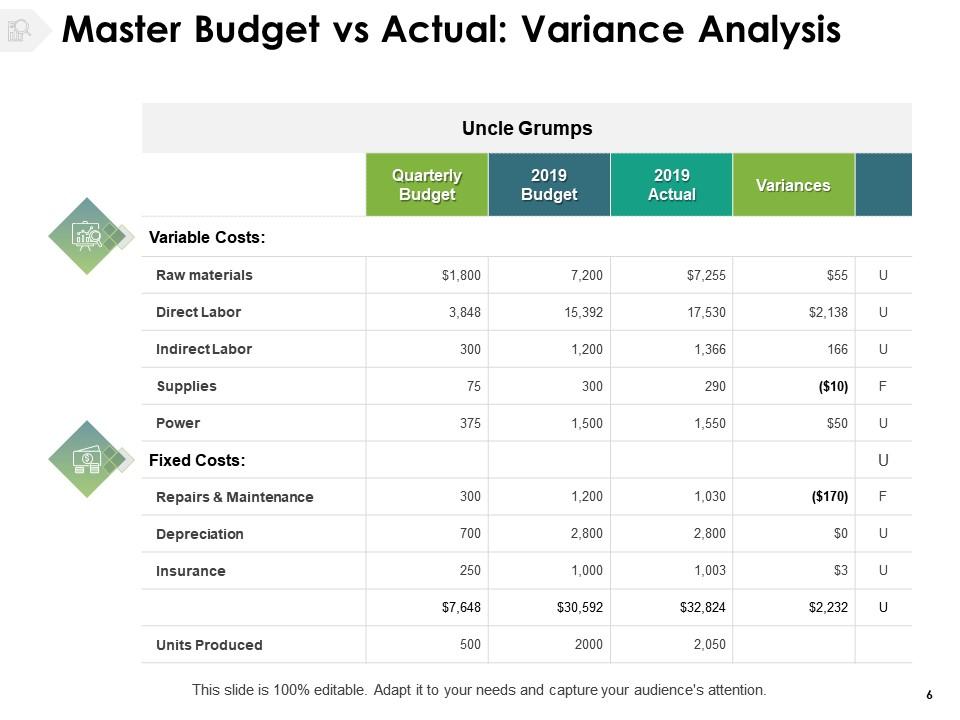
Slide 6: This slide showcases Master Budget vs Actual: Variance Analysis with variable and fixed costs.
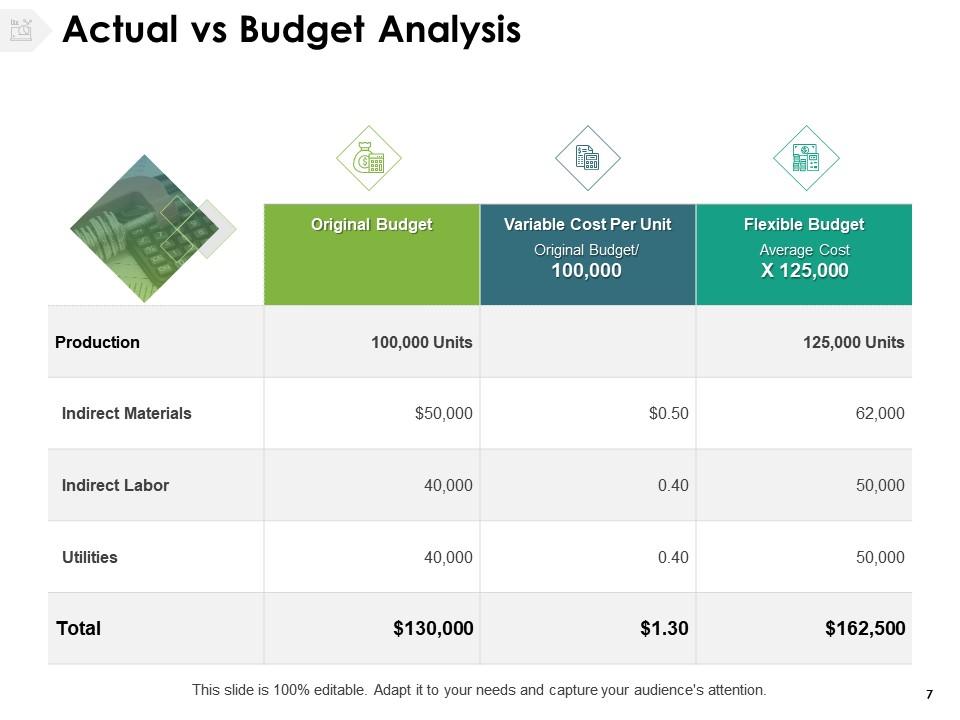
Slide 7: This slide shows Actual vs Budget Analysis with categories as original budget, variable cost per unit and flexible budget.
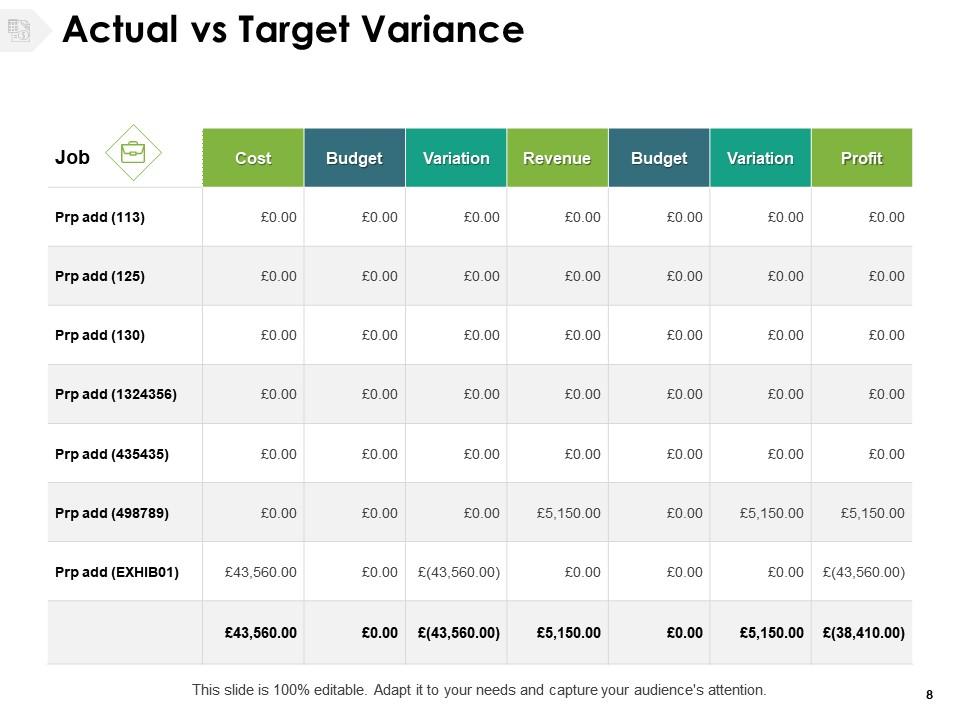
Slide 8: This slide presents Actual vs Target Variance.
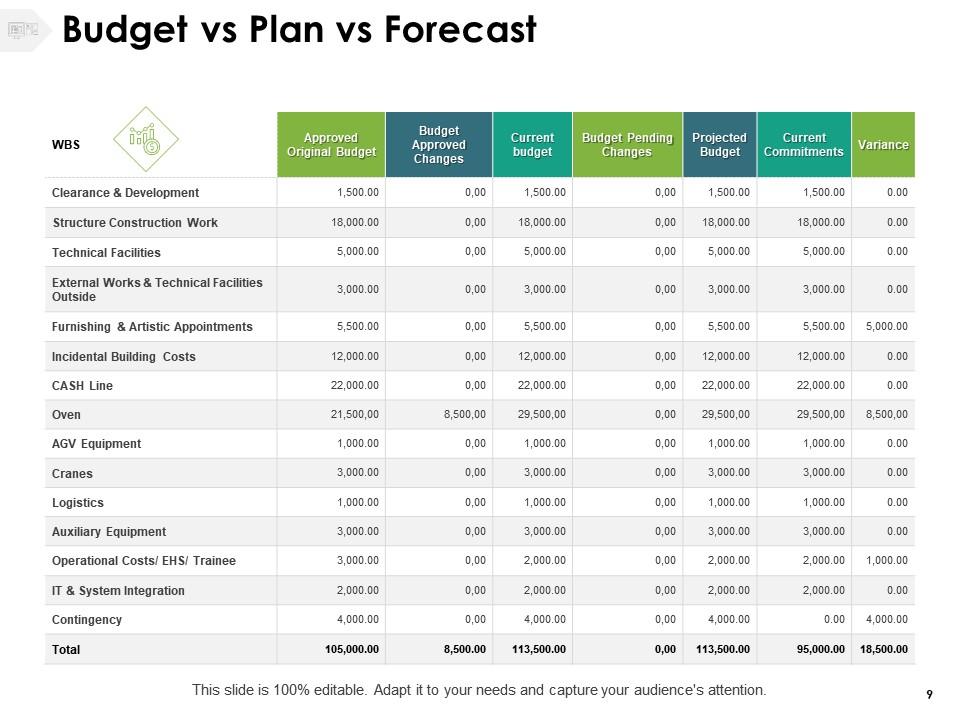
Slide 9: This slide displays Budget vs Plan vs Forecast. You can add data as per requirements.
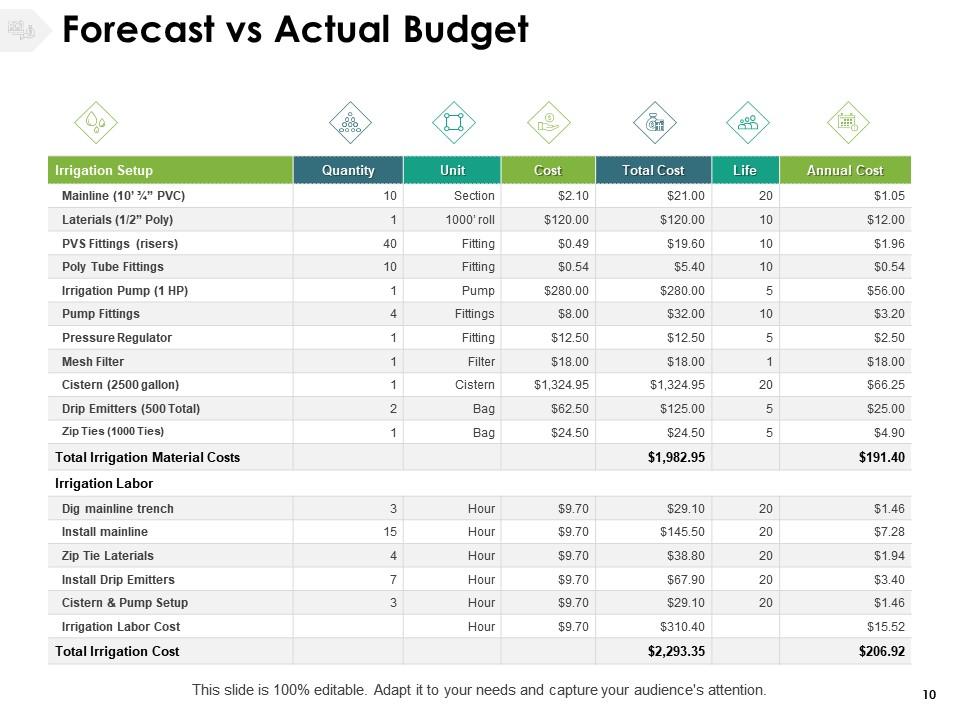
Slide 10: This slide represents Forecast vs Actual Budget.
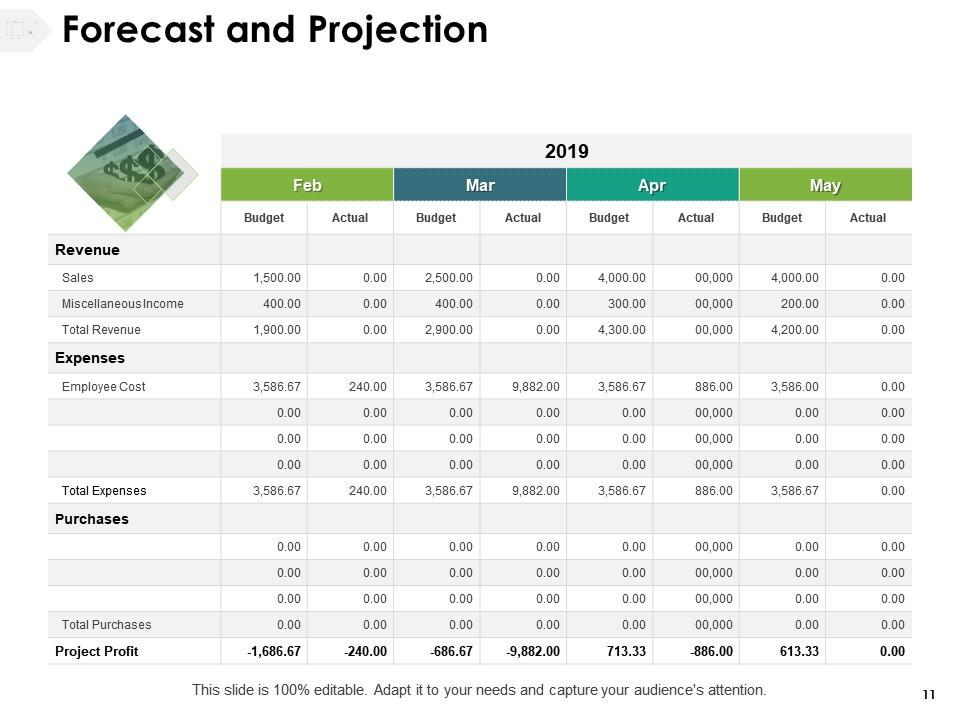
Slide 11: This slide showcases Forecast and Projection on monthly basis.
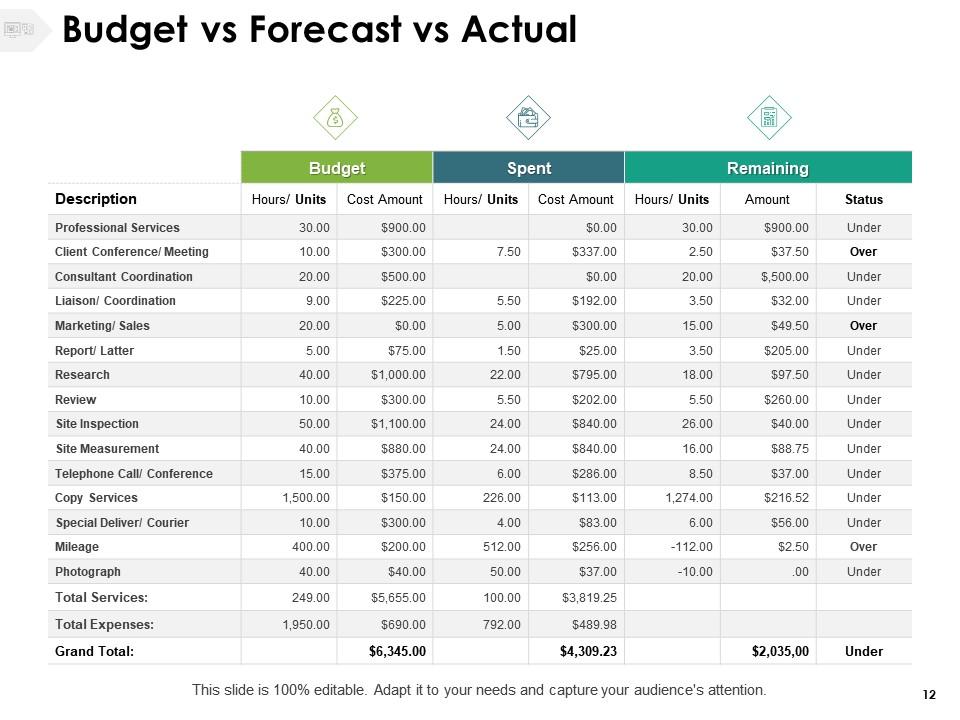
Slide 12: This slide shows Budget vs Forecast vs Actual.
Slide 13: This slide displays icons for Actual vs Budget Variance.
Slide 14: This slide is titled as Additional Slides for moving forward.
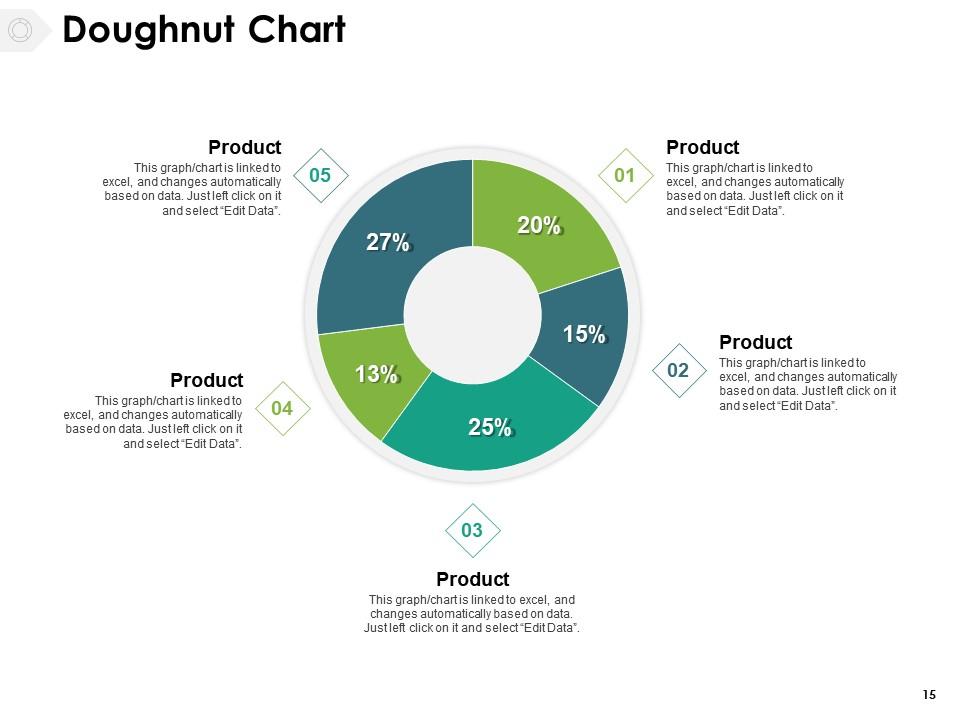
Slide 15: This slide displays Donut chart with data in percentage.
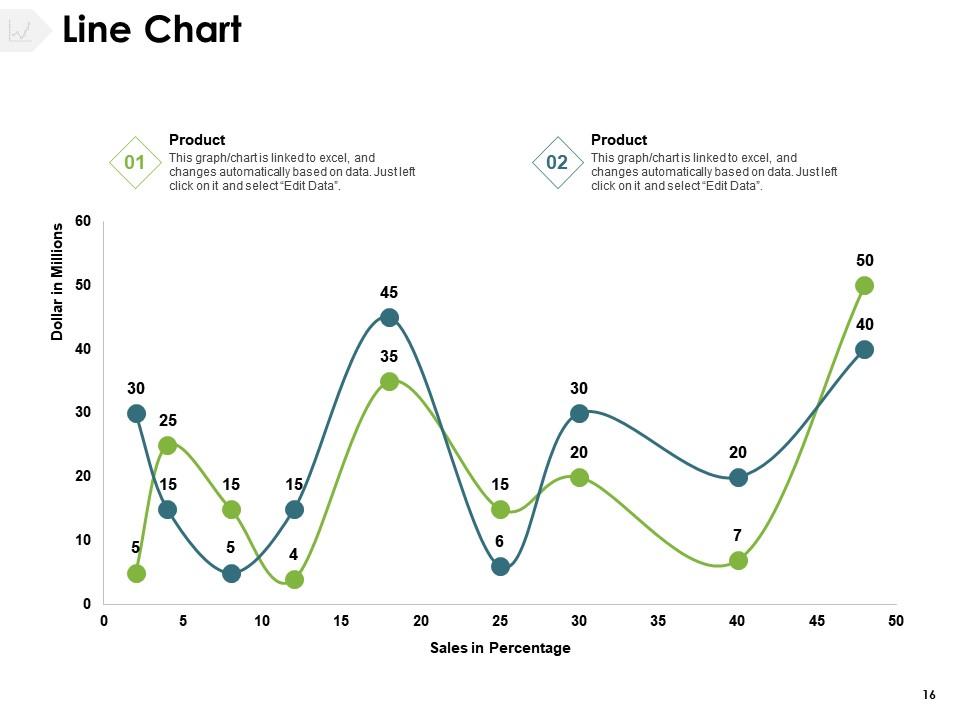
Slide 16: This slide shows Line Chart with two products comparison.
Slide 17: This is Our Mission slide with related imagery and text.
Slide 18: This is Our Team slide with names and designation.
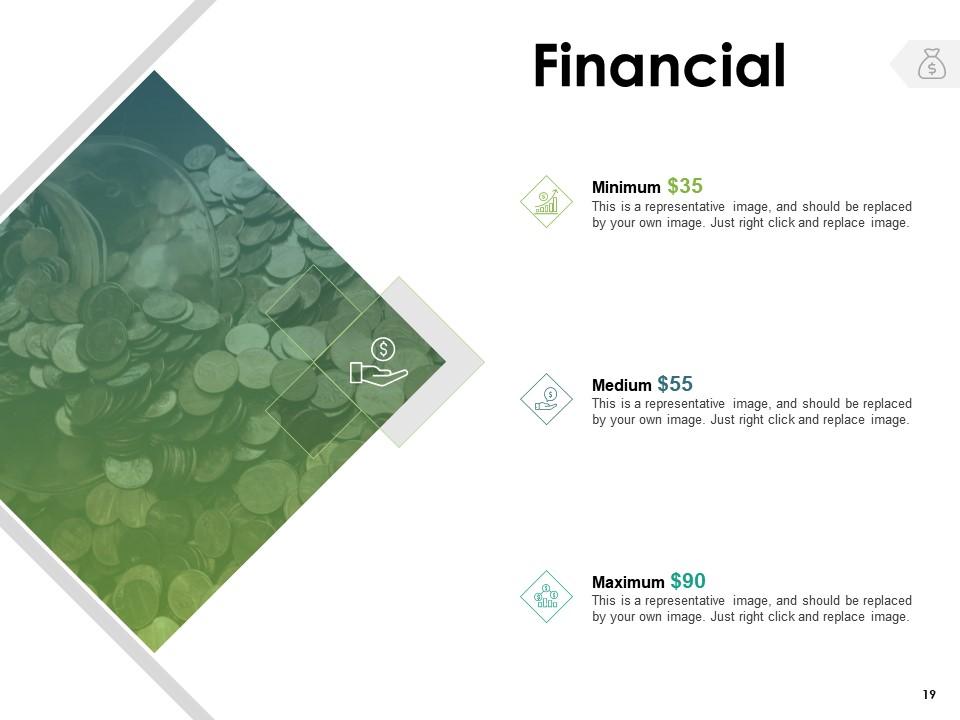
Slide 19: This is a Financial slide. Show your finance related stuff here.
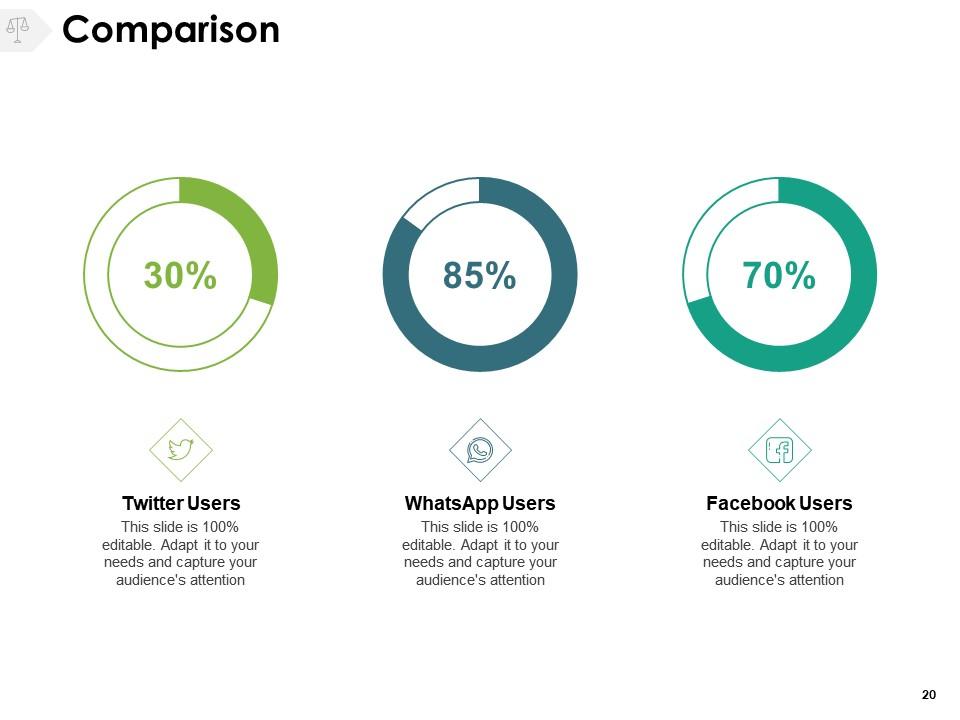
Slide 20: This is a Comparison slide to state comparison between commodities, entities etc.
Slide 21: This is a Thank You slide with address, contact numbers and email address.
Actual Vs Budget Variance Powerpoint Presentation Slides with all 21 slides:
Use our Actual Vs Budget Variance Powerpoint Presentation Slides to effectively help you save your valuable time. They are readymade to fit into any presentation structure.
-
Easy to edit slides with easy to understand instructions.
-
Easily Understandable slides.
-
Great product with highly impressive and engaging designs.
-
Very well designed and informative templates.


