


Monthly Financial Report With Budget And Variance




Try Before you Buy Download Free Sample Product
 Impress Your
 Audience
 100%
100% Editable
 Save Hours
 of Time


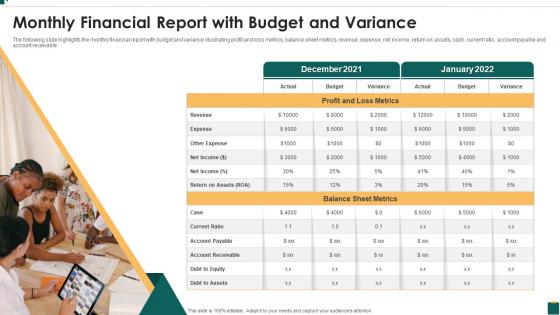
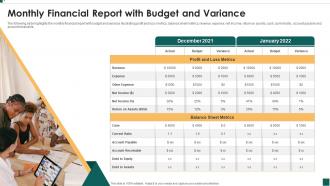
The following slide highlights the monthly financial report with budget and variance illustrating profit and loss metrics, balance sheet metrics, revenue, expense, net income, return on assets, cash, current ratio, account payable and account receivable.
People who downloaded this PowerPoint presentation also viewed the following :
Monthly Financial Report With Budget And Variance with all 6 slides:
Use our Monthly Financial Report With Budget And Variance to effectively help you save your valuable time. They are readymade to fit into any presentation structure.





FAQs for Monthly Financial Report With
Look, start with the big three: profitability stuff like ROE and profit margins, liquidity ratios (current ratio, quick ratio), and debt ratios like debt-to-equity. There's honestly tons of other ratios but those'll give you the foundation. Asset turnover and inventory turnover are solid too - shows if they're actually using their resources well or just sitting on stuff. Here's the thing though: one year's numbers don't mean much. Compare to industry averages and look at 3-5 year trends. That's where you'll spot the real patterns and see if they're improving or sliding.
Honestly, cash flow tells you way more than profit numbers ever will. Look at the operating cash flow section first - that's where you'll catch companies doing accounting tricks. Can they actually turn profits into real money? Are they generating enough cash to pay bills without scrambling for loans? I always check trends over a few quarters too. Short bursts don't mean much. If they're consistently burning cash or can't cover short-term debts from operations, that's your warning sign right there.
Look, trend analysis is basically your crystal ball for predicting finances. Pull 3-5 years of historical data first - revenue patterns, expenses, seasonal stuff, growth rates. Short-term trends can contradict long-term ones though, which always trips people up. You're hunting for consistent patterns that'll help build realistic forecasts instead of just winging it. I've watched too many people crash and burn with wild guesses. Both timeframes matter since they tell different stories about where your business is actually headed. Way more reliable than gut feelings.
Honestly, just focus on three main statements and you'll be fine. Income statement shows if they're making money and growing. Balance sheet tells you their debt situation - don't want that getting crazy high. Cash flow is huge though because companies can look profitable on paper but still be broke (weird but it happens). Compare a few key ratios to their competitors and past years. I'd stick to maybe 3-4 ratios at first so you don't go down a rabbit hole. Look for steady growth, decent debt levels, and positive cash coming in from operations. That'll give you a solid read on whether they're actually healthy or just good at accounting tricks.
Think of economic indicators as your reality check when analyzing companies. GDP growth, inflation, unemployment, interest rates - they all matter because context is everything. A company posting 5% growth during a recession? That's actually pretty solid. Same 5% during an economic boom? Meh, not so impressive. You can't really judge if management is skilled or just lucky without knowing what's happening in the broader economy. Plus these indicators give you hints about what's coming next - like whether the company will face headwinds or catch some tailwinds. Always check the economic backdrop before making your final call on any investment.
So variance analysis is just comparing what you planned to spend vs what you actually spent. Pretty simple concept. You look at the gaps between budgeted and real numbers - could be revenue, expenses, whatever you're tracking. The whole point is catching issues before they get out of hand. I'd honestly skip doing this just once a year because that's useless. Monthly reports work way better. Focus on the biggest differences first since those tell you the most. It's basically your heads-up system for when things go sideways financially. Oh, and don't forget to actually figure out WHY the numbers are off - that's the important part.
Vertical analysis turns everything into percentages - like each expense becomes a % of total revenue, balance sheet items become % of total assets. Super helpful for comparing different sized companies. Horizontal analysis tracks changes over time, usually year-over-year stuff. You'll spot what's growing or tanking pretty fast this way. I always start with revenue and the big expense lines first - that's honestly where most of the interesting stuff jumps out at you. Both methods are clutch for seeing patterns you'd miss just staring at raw numbers.
Think of borrowing money for your business like using a magnifying glass - it makes everything bigger, good and bad. When times are good, you'll earn way more than what you're paying in interest. Pretty sweet deal, right? But here's where it gets tricky. Those loan payments don't care if you had a rough month or your biggest client bailed. They're due no matter what. I've seen too many businesses get crushed because they borrowed too much when things were going well. You want enough debt to grow faster, but not so much that one bad quarter tanks everything.
Honestly, financial modeling is a game-changer for planning stuff out. You can run through different scenarios - market crashes, sudden growth, new products - without actually risking anything. Pretty much like having a crystal ball but with real numbers behind it. The coolest part? You'll spot problems way before they hit, and when you're pitching to investors or your team, you've got solid data instead of just "trust me on this." I learned this the hard way after making too many gut decisions early on. Start simple though - don't overcomplicate it right away.
Honestly, charts and graphs are your best friend here - way better than just throwing numbers at people. Pick 3-4 ratios that actually move the needle for your audience. I've sat through too many presentations with like 20 ratios where everyone's eyes just glaze over. Group similar stuff together (profitability, liquidity, whatever) and always compare to competitors or industry standards. Nobody cares about a 15% ROE unless they know if that's good or terrible. Explain everything in normal language - not everyone speaks finance. Oh, and always end with "here's what this means for us" so people don't just stare blankly.
Excel's still king - seriously, I live in that thing like 70% of my workday. Bloomberg and FactSet are amazing if your company pays for them, but they cost a fortune. Python's solid too if you don't mind coding, saves tons of time on repetitive stuff. Oh and Tableau or Power BI make your charts actually look professional instead of like a middle schooler made them. Start with Excel's advanced functions and pivot tables though. That'll cover most of what you need daily. Once you nail those, everything else is just bonus features honestly.
Market conditions are like a multiplier on your valuation - they can totally amplify or crush what your fundamentals actually say you're worth. Bull markets make investors pay crazy premiums for everything (sometimes stupidly high, honestly). Bear markets? They compress those same ratios even for rock-solid companies. Look at comparable company analysis - P/E ratios swing all over the place based on sentiment, interest rates, economic vibes. I mean, it's wild how much they fluctuate. The trick is figuring out when market conditions are just creating temporary noise versus actually signaling real shifts in your industry.
Honestly, don't mess around with the data - present everything truthfully even if some numbers look bad. Disclose any financial interests you have, that's non-negotiable for credibility. Confidential info stays confidential, obviously. I've watched people torpedo their careers by trading on insider knowledge, not worth it. Your sources better be solid and your methods clear. Oh, and be upfront about where your analysis falls short - nobody expects perfection but they do expect honesty. Client's interests come first, always.
Look, financial analysis is basically your GPS for any M&A deal - tells you if you're about to drive off a cliff or not. Dig deep into their cash flows, debt situation, and profit trends from the past three years. Those due diligence spreadsheets are absolutely painful but you can't skip them. Focus on whether their revenue's actually sustainable or just lucky timing. Watch out for sneaky liabilities they've buried somewhere. And honestly? Most projected synergies are complete BS, so be realistic about what you can actually achieve. Don't trust the pretty PowerPoint - trust the numbers.
Yeah so financial statements are basically looking backwards - like driving with just your rearview mirror, which is sketchy. They miss all the intangible stuff that actually matters now: brand value, good employees, market position. Companies can also play around with accounting methods to make their numbers look however they want, honestly. Management quality? Industry changes? Competitive threats? None of that shows up either. You'll want to dig into market research and forward-looking data too. Don't just rely on the statements alone or you're missing half the story.
-
Thrilled to see several customizable templates catering various verticals and industries.
-
Great designs, really helpful.