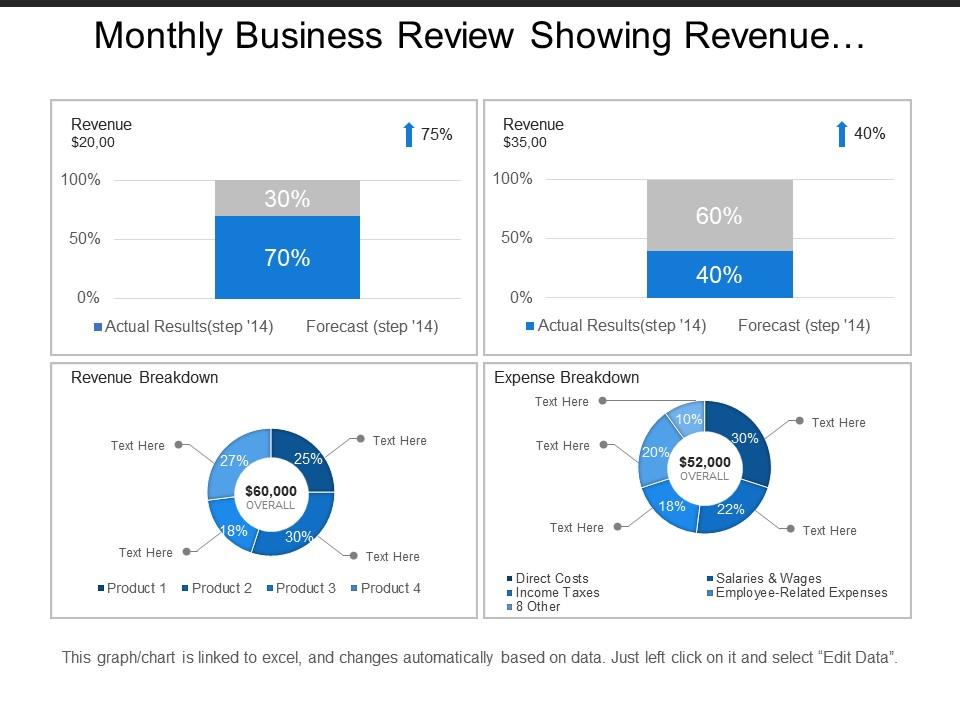
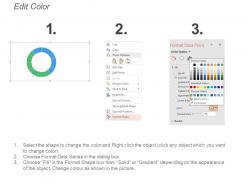
Monthly business review showing revenue and expense breakdown

Rating:
80%
Monthly business review showing revenue and expense breakdown
Slide 1 of 5
Favourites Favourites

Try Before you Buy Download Free Sample Product

Audience Impress Your
Audience
Editable 100%
Editable
Time Save Hours
of Time
The Biggest Sale is ending soon in
0
0
:
0
0
:
0
0
Rating:
80%
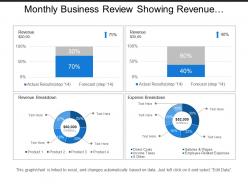
Presenting this set of slides with name - Monthly Business Review Showing Revenue And Expense Breakdown. This is a four stage process. The stages in this process are Monthly Business Review, Monthly Business Report, Monthly Company Review.

FAQs for Monthly business review showing revenue

Key metrics for Monthly Business Review presentations include revenue performance, customer acquisition costs, operational efficiency indicators, market share analysis, and employee productivity measures. These metrics enable organizations to track strategic progress, identify emerging trends, and make data-driven decisions, with many companies finding that consistent measurement across financial, operational, and competitive dimensions ultimately delivers enhanced accountability and accelerated business growth.

Visual storytelling enhances Monthly Business Review effectiveness by transforming complex data into compelling narratives through charts, infographics, trend visualizations, and performance dashboards. These visual elements streamline communication, accelerate decision-making, and improve stakeholder engagement, with many organizations finding that visual presentations reduce meeting time while increasing comprehension and strategic alignment across departments.

Best practices for structuring a Monthly Business Review presentation include starting with an executive summary, presenting key performance indicators against targets, analyzing variances with root causes, highlighting strategic initiatives progress, and concluding with forward-looking action plans. These structured approaches enhance decision-making by providing clear performance visibility, identifying operational gaps, and enabling proactive resource allocation, with many organizations finding that consistent formatting accelerates leadership discussions and drives accountability across departments.

Tailoring Monthly Business Reviews involves customizing content depth, metrics focus, and presentation format based on each stakeholder's role and priorities. Executive leadership requires high-level strategic insights and key performance indicators, while department heads need operational details and resource allocation updates, and board members focus on financial performance and market positioning, ultimately ensuring each audience receives relevant, actionable information for informed decision-making.

Data visualization transforms complex monthly metrics into clear, actionable insights through charts, graphs, dashboards, and infographics that highlight trends, performance gaps, and opportunities. These visual tools streamline decision-making by enabling stakeholders to quickly identify patterns, compare departmental performance, and track progress against goals, with many organizations finding that visual presentations enhance meeting efficiency and drive faster strategic responses.

Effectively highlighting successes and areas for improvement requires clear data visualization, balanced storytelling, and actionable insights that demonstrate both achievements and growth opportunities. Through comprehensive dashboards, trend analysis, and strategic recommendations, organizations can showcase performance wins while identifying operational gaps, resource optimization needs, and market expansion possibilities, ultimately enabling stakeholders to make informed decisions that drive competitive advantage.

Common pitfalls include presenting data without insights, focusing solely on metrics rather than strategic implications, lacking clear action items, overwhelming stakeholders with excessive details, and failing to address performance gaps honestly. Many organizations find that successful reviews balance comprehensive reporting with actionable recommendations, ultimately delivering transparency and accountability while enabling informed decision-making for competitive advantage.

Monthly Business Reviews should be conducted consistently every month, with quarterly deep-dives and mid-month check-ins for critical metrics when needed. This strategic combination enables organizations to maintain operational momentum, identify trends early, and make data-driven adjustments, with many companies finding that consistent monthly cadence ultimately delivers better forecasting accuracy and enhanced performance visibility.

Effective financial performance presentations include revenue trend analysis, budget-to-actual comparisons, key performance indicator dashboards, profit margin breakdowns, and cash flow summaries. These elements streamline executive decision-making by highlighting variances, identifying growth opportunities, and showcasing operational efficiency, with many organizations finding that visual data storytelling ultimately delivers faster strategic insights and enhanced stakeholder confidence.

**INPUT**: How do you ensure action items from the previous review are addressed in the next session? **OUTPUT**: Ensuring action items are addressed requires systematic tracking through status dashboards, designated owners with clear deadlines, and structured follow-up protocols integrated into each session's agenda. These accountability mechanisms streamline progress monitoring by establishing regular check-ins, automated reminders, and performance metrics, with many organizations finding that consistent tracking ultimately delivers improved execution rates and enhanced operational efficiency. **Word count: 57 words**

Tools that enhance Monthly Business Review presentations include PowerPoint, Tableau, Power BI, Google Slides, and Prezi for visual storytelling and data visualization. These platforms streamline reporting by automating data integration, creating interactive dashboards, and enabling real-time collaboration, with many organizations finding that strategic visual presentation delivers clearer insights, faster decision-making, and improved stakeholder engagement across departments.

Incorporating team feedback involves structured collection methods like surveys, focus groups, and cross-departmental input sessions before the review meeting. This approach enables comprehensive performance insights, identifies operational bottlenecks, and captures frontline perspectives that senior leadership might miss, ultimately delivering more accurate business assessments and stronger strategic alignment across organizations.

Monthly Business Reviews drive strategic decision-making by providing comprehensive performance analysis, identifying market trends, assessing resource allocation effectiveness, and highlighting operational gaps requiring attention. Through systematic data evaluation and cross-departmental insights, organizations can pivot strategies, reallocate investments, and capitalize on emerging opportunities, with many companies finding that regular reviews enhance agility and competitive positioning.

Monthly Business Reviews typically last 2-3 hours, allowing comprehensive discussion of performance metrics, strategic initiatives, departmental updates, and action planning without overwhelming participants. This duration enables thorough analysis of financial results, operational challenges, and market opportunities while maintaining engagement, with many organizations finding that structured agendas and focused discussions within this timeframe deliver actionable insights and strategic alignment across teams.

Follow-up strategies can be integrated through dedicated action item tracking, accountability assignments with specific deadlines, and progress monitoring sections within each MBR agenda. This structured approach ensures initiatives from previous reviews are evaluated for completion status, roadblocks are addressed systematically, and team members remain accountable, ultimately creating continuous improvement cycles that enhance operational efficiency and strategic execution across departments.

Ratings and Reviews

80% of 100
Review Form
Write a review
Most Relevant Reviews
  1. 80%

    by Charles Nguyen

    Awesome use of colors and designs in product templates.
  2. 80%

    by Edwardo Wheeler

    Easily Editable.

2 Item(s)

per page: