

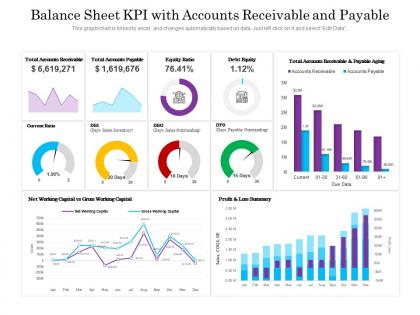
Balance sheet kpi with accounts receivable and payable




Try Before you Buy Download Free Sample Product
 Impress Your
 Audience
 100%
100% Editable
 Save Hours
 of Time


Our Balance Sheet KPI With Accounts Receivable And Payable are topically designed to provide an attractive backdrop to any subject. Use them to look like a presentation pro.
People who downloaded this PowerPoint presentation also viewed the following :
Balance sheet kpi with accounts receivable and payable with all 2 slides:
Use our Balance Sheet KPI With Accounts Receivable And Payable to effectively help you save your valuable time. They are readymade to fit into any presentation structure.
FAQs for Balance sheet kpi with accounts
You know the SMART thing - specific, measurable, achievable, relevant, time-bound? That actually works. Pick 3-5 metrics that connect to what you're trying to accomplish, not vanity numbers that just look pretty. Everyone should understand what moves the needle and how their work affects it. I swear, half the companies I know have these massive dashboards with like 50 metrics nobody looks at twice. Keep it simple so you can actually collect the data without going crazy. Choose stuff that makes people want to do something about it, not just stare at reports.
Look, first thing - map every KPI back to a strategic goal. Can't make that connection? Toss it. Too many teams get obsessed with vanity metrics that look pretty in reports but don't actually move anything forward. Your metrics should tell you if you're winning or not, period. Check this alignment every quarter because strategies shift and your KPIs better shift with them. Here's the brutal test: if all your KPIs are hitting green but your strategy is still tanking, you're tracking the wrong stuff. Honestly happens more than you'd think.
Honestly, you really need their input - these people are gonna be the ones actually using your KPIs day-to-day. Get perspectives from different levels too, because what the executives think matters might be totally different from what your frontline managers actually need. I've watched so many companies build these elaborate dashboards that just sit there collecting dust because nobody bothered asking users what they wanted. Plus, stakeholder buy-in means your KPIs will actually connect to real outcomes instead of just looking pretty. Oh, and don't just ask what to measure - figure out how they'll use that data to make decisions.
Honestly, quarterly is the bare minimum but I've watched so many teams just abandon their KPIs after setting them. Monthly works way better if you're in a fast-moving department. The real trick? Check if they still match your actual business goals - priorities change all the time, your metrics should too. I always tell people to set calendar reminders because this stuff gets pushed off when work gets crazy. Oh and do a big annual review for major changes. Trust me, outdated KPIs become completely useless faster than you'd think.
Honestly, the worst thing you can do is go crazy with too many KPIs. You'll end up drowning in numbers and lose sight of what actually moves the needle. I've watched teams get obsessed with stuff like page views (which honestly, who cares?) while completely ignoring conversion rates. Makes no sense. Don't just throw metrics at people either - your team needs to get why each one matters. And for the love of god, actually check them regularly instead of setting them once and never looking again. Start small with maybe 3-5 metrics that really count, then expand from there.
Dude, visual dashboards are a total game-changer for KPI tracking. No more hunting through endless spreadsheet rows trying to figure out what's going on. Charts and graphs make trends pop out immediately - you'll actually see patterns instead of just staring at numbers. I honestly used to hate our monthly reviews until we switched to visual dashboards. Now stakeholders actually pay attention during meetings (crazy, right?). You can click around to dig deeper into specific metrics or compare different time periods. Just start with simple bar charts or whatever, then get fancier once everyone's used to it.
Honestly, I'd start with Net Promoter Score if you can only track one thing - it's weirdly predictive of whether your business will actually grow. Customer Satisfaction Score is good for checking if people are happy right after they interact with you. Then there's Customer Effort Score, which tracks how much of a pain you are to deal with (super underrated metric tbh). Support ticket resolution times matter too, plus retention rates give you the real story. NPS though? That's your north star since it shows if customers would actually tell their friends about you.
Honestly, KPI dashboards are game-changers because your team can finally see what's working in real-time. No more of those awkward meetings where everyone's looking at different numbers and nobody knows what's actually happening. You'll catch problems way earlier, and people can check their own progress without bugging you every five minutes. The trick is picking metrics that actually help you make decisions - I've seen too many dashboards packed with impressive-looking stats that don't really tell you anything useful. Oh, and trends become super obvious when everything's visual instead of buried in spreadsheets.
Honestly, culture is everything when it comes to KPIs actually working. When leadership creates that blame-heavy vibe, people just start fudging numbers or completely ignore them - which is basically useless, right? You need teams to feel safe reporting bad news without getting their heads chopped off. The places I've seen crush it treat KPIs like a GPS, not a report card. Leadership has to walk the walk too - can't just collect data and let it sit there gathering dust. Oh, and psychological safety isn't just some HR buzzword. It's what separates teams that improve from ones that just... don't.
Honestly, just start with whatever you've got - Excel or Google Sheets work fine if you're not ready to drop money on fancy stuff. You can automate most of the data collection and avoid manually updating spreadsheets every month (which is soul-crushing, trust me). Tools like Tableau or Power BI are great for pulling everything together and making those real-time dashboards that actually look professional. The main thing is picking something your team will actually use. I've seen too many companies buy expensive software that just sits there collecting digital dust. Build up your tracking gradually - you don't need to go from zero to enterprise-level overnight.
Here's the thing - figure out who you're talking to first. Executives just want the big picture stuff and how it affects the business. Your ops team? They need all the nitty-gritty details and what to do next. Don't dump spreadsheets on people (seriously, nobody opens those). Dashboards and simple charts work way better. Set up regular check-ins so everyone knows when updates are coming. Always explain the "why" behind your numbers. What caused that dip? What're you doing to fix it? Focus on what it all means, not just rattling off data points.
Honestly, I'd go with a balanced scorecard thing - map your short-term stuff directly to long-term goals. Like track monthly customer acquisition but also watch lifetime value over a year or more. The real challenge is weighting them right in reviews and not letting daily fires completely trash your strategic tracking (which happens way too often). Monthly reviews work, but I'd adjust targets quarterly. Oh, and make sure each short-term KPI connects to at least one bigger goal - otherwise you're just measuring random stuff. It's tricky but doable.
Assign specific KPIs to individual people, not whole teams - otherwise everyone just blames each other when stuff goes wrong. Weekly check-ins work great where they actually look at their numbers and explain what happened. Seriously, I can't tell you how many dashboards I've seen that nobody even opens! Make it matter by connecting performance to their reviews or bonuses. Write down who owns what, deadlines, and what happens if they miss targets. That way nobody can play dumb later and say they didn't know what you wanted.
So basically, different teams need different metrics that actually make sense for what they do. Sales should track revenue and conversions - obvious stuff. HR might look at retention rates or how long it takes to fill positions. Marketing gets tricky because they'll fight forever about who deserves credit for leads (trust me on this one). Start by asking each team what winning looks like to them, then figure out how to measure it. Don't just slap the same KPIs on everyone because it's convenient. Match their metrics to what they actually control and your bigger business goals.
So basically, leading indicators show what's coming while lagging ones tell you what already went down. You need both though. Picture driving - lagging indicators are like checking your rearview mirror (revenue, customer satisfaction) and leading ones are looking ahead through the windshield (pipeline stuff, how engaged your team is). Most people get way too focused on the lagging metrics because they're simpler to track. But honestly? The leading ones are where you can actually do something before everything goes sideways. Set up a dashboard with both so you're not flying blind.
-
Commendable slides with attractive designs. Extremely pleased with the fact that they are easy to modify. Great work!