


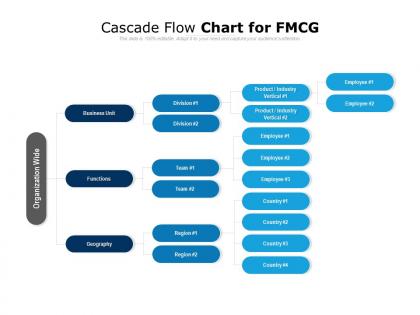
Cascade flow chart for fmcg




Try Before you Buy Download Free Sample Product
 Impress Your
 Audience
 100%
100% Editable
 Save Hours
 of Time


Our Cascade Flow Chart For FMCG are an excellent form of business communication. They assure cross cultural acceptance.
People who downloaded this PowerPoint presentation also viewed the following :
Cascade flow chart for fmcg with all 5 slides:
Our Cascade Flow Chart For FMCG assure cross cultural acceptance. They are an excellent form of business communication.
FAQs for Cascade flow
So basically, demand planning sits at the top of these flow charts. Then you've got supply planning, production scheduling, and distribution planning flowing down below it. Each step feeds into the next one - makes total sense when you actually see it laid out. There's also inventory management scattered throughout, plus quality control checkpoints and the retailer/consumer stuff at the bottom. Shows the whole journey from forecasting to shelves, which is honestly pretty cool. Definitely check out your company's specific version though - they're all different depending on how you distribute and what products you're dealing with.
So basically it's like drawing out your whole supply chain from factory to store shelves. Shows you every handoff point and where things usually get stuck - super helpful when you're wondering why stuff isn't hitting stores on time. You'll see how one delay screws up everything downstream. Honestly, most people don't realize how many bottlenecks they have until they map it out visually. Start with your best-selling products first. Way easier to spot the problems when you can actually see the flow instead of just guessing what went wrong.
Honestly, data analytics are game-changers for FMCG flow optimization. You can finally see bottlenecks, predict demand spikes, and get your inventory levels dialed in at every stage. Real-time tracking of supplier performance and retail velocity beats guessing any day - we used to just cross our fingers and hope for the best, which was pretty stressful. The algorithms catch slow-moving products in distribution centers and warn you about potential stockouts before they bite you. Plus you get solid insights on tweaking your flow settings. My advice? Start with basic dashboards first. Once you visualize everything, the patterns jump out at you.
So basically, you can use cascade flow charts to map out your whole product journey - concept to when you finally kill it off. Track development, launch, growth, maturity, decline. Each stage shows how your decisions mess with the next one. Game-changer for spotting where things get stuck and figuring out resource allocation. Plus you'll see patterns across different products, which is pretty cool for predicting what's coming next. Honestly, just start with one product mapped end-to-end first. Way easier than trying to do everything at once, and you'll have your template ready.
Honestly, the biggest mistake is overcomplicating things from day one - stakeholders will check out instantly. Also avoid tons of parallel streams without clear decision points. That's just chaos waiting to happen. Talk to your field teams first though! They always spot stuff you miss sitting at your computer. Most people forget about feedback loops and exception handling too, which is dumb because FMCG distribution never goes according to plan anyway. My advice? Start simple, pilot it small, then layer on complexity once you know the foundation actually works.
Customer feedback flows backwards through your whole FMCG chain - from shoppers to retailers to distributors and back to you. Pretty much like a boomerang effect, honestly. It hits every level because people are telling you what they actually want, what's broken, or what's selling like crazy. You'll see shifts in production needs, maybe tweak your distribution, sometimes even reformulate products. The smart move? Set up solid feedback loops at each stage. That way you catch trends before your competition does - and trust me, being first matters way more than being perfect in FMCG.
Start with the basics - units sold, where you're distributed, how fast inventory moves. Financial stuff comes next: revenue, margins, what it costs to get each customer. Sell-through rates are huge though. Days of inventory too. These show you exactly where stuff gets bottlenecked. Market share helps if you can find decent data - gives you perspective on whether you're actually winning or just riding a wave. Honestly, most teams overcomplicate this. Pick like 5-6 things everyone can easily track. You can always add more later once people aren't drowning in spreadsheets.
Honestly, connecting your real-time data sources makes a huge difference for flow chart accuracy. Your ERP can feed live inventory numbers directly in, plus sales data from POS systems - no more dealing with those nightmare spreadsheets we all hate updating manually. IoT sensors are pretty cool too, they'll actually track where products are moving through your distribution network. AI forecasting helps predict demand patterns way better than guessing. I'd probably start with just your top 3 data sources though, don't try to connect everything at once. Makes the whole thing reflect what's actually happening instead of last week's numbers.
So your sales team can watch products move from warehouse to shelf - pretty straightforward. Supply chain managers spot bottlenecks and fix inventory issues with the same data. Marketing gets excited seeing their promos actually flow through distribution (honestly, they geek out over this stuff). Finance uses it for cash flow forecasting since they'll know timing at each stage. Everyone's looking at identical info but pulling what matters for their job. I'd start by figuring out who needs access, then customize each team's view. Makes the whole thing way more useful when people aren't drowning in irrelevant details.
Make sure your arrows point clearly in the right direction - sounds obvious but you'd be surprised how many people mess this up. Stick with the same colors throughout (like blue for manufacturing, green for retail, whatever makes sense). Don't cram text together or use weird random shapes that make it look like a kindergarten art project. Spacing matters too - give everything room to breathe so the flow from start to finish is easy to follow. Oh, and definitely have someone else look at it first. If they squint or look confused, you probably need to simplify things.
So cascade flow charts basically map out how demand moves through your whole supply chain - raw materials all the way to customers. Makes forecasting way more accurate. You'll spot bottlenecks and seasonal stuff easily, plus see how one change affects everything downstream. Honestly, they're kind of addictive once you figure them out. Start by sketching your current flow from supplier to shelf. Then throw your historical sales data on top to find the patterns that actually matter. It's crazy how well you can predict demand spikes before they smack you in the face.
Honestly, those cascade charts are super helpful for mapping out how all the different teams connect. Marketing, supply chain, sales, ops - they're all tangled up together way more than you'd think. The visual really helps spot where handoffs usually go wrong between departments. Plus teams can see their dependencies clearly, which makes coordinating on timing and resources way smoother. I'd definitely pull it out at your next project kickoff - gets everyone aligned on who's doing what when. Trust me, it beats having five different interpretations of the same plan floating around.
Honestly, the key is tweaking each category based on what makes it tick. Dairy and perishables? You'll need way shorter cycles and constant velocity checks - that stuff goes bad fast. Shelf-stable products can chill with longer replenishment windows. Beauty items are weird though, they follow totally different seasonal patterns than cleaning supplies. I'd start by figuring out your category's specific quirks first. Then mess with your safety stock calculations, lead times, and throw in some category-specific metrics like freshness scores. Oh, and don't forget promotional lift tracking - that actually matters more than people think.
Give them the big picture first - nobody wants to jump into details without context. Make your visual hierarchy clean with consistent colors and simple arrows people can actually follow. Too many of these things look like a mess honestly. Focus on the key decision points instead of every tiny step. Include real numbers when you can, and yeah, definitely prep backup slides because someone's always gonna want to dig deeper. I'd test it on someone who doesn't know the process first. Walk through it once, then just let them ask questions - don't over-explain everything.
So cascade flow charts are basically your diagnostic tool for spotting where things get jammed up in FMCG operations. You'll see exactly which stage is causing problems - manufacturing, distribution, retail, whatever. Honestly, they're lifesavers when your product launch is crawling along and you can't figure out why. Map out your current process first, then use that as your starting point. The visual format makes it way easier for teams to catch improvement opportunities. Plus you can actually track if the changes you make are doing anything - which is half the battle, right?
No Reviews