


Cloud Dashboard For Product Sales Analysis Sap Analytics Cloud




Try Before you Buy Download Free Sample Product
 Impress Your
 Audience
 100%
100% Editable
 Save Hours
 of Time


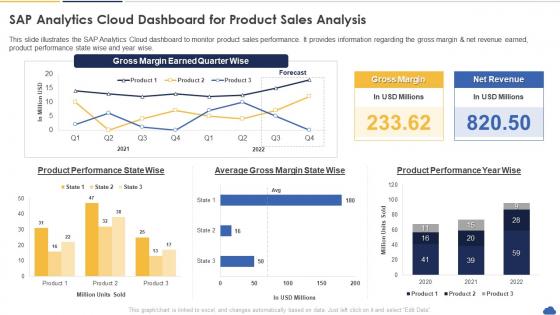
This slide illustrates the SAP Analytics Cloud dashboard to monitor product sales performance. It provides information regarding the gross margin and net revenue earned, product performance state wise and year wise.
People who downloaded this PowerPoint presentation also viewed the following :
Cloud Dashboard For Product Sales Analysis Sap Analytics Cloud with all 7 slides:
Use our Cloud Dashboard For Product Sales Analysis Sap Analytics Cloud to effectively help you save your valuable time. They are readymade to fit into any presentation structure.





FAQs for Cloud Dashboard For Product Sales Analysis
Honestly, just start with the basics - CPU, memory, storage, plus response times and error rates. Don't try to build some crazy comprehensive thing right away, trust me on this one. Real-time stuff is great but you also need trends over time so you can catch slow degradation before it bites you. Cost tracking is huge too if you're on AWS or whatever. Set up alerts with reasonable thresholds because staring at dashboards 24/7 isn't sustainable. Oh and security alerts obviously. Build it simple first, then add the fancy stuff once everyone's actually using it.
Honestly, cloud dashboards are game-changers for teams. Everyone sees the same real-time data instead of playing email tag with old spreadsheets. No more pestering people for updates or sitting through endless status meetings (thank god). You'll spot bottlenecks instantly and can set alerts so problems hit your radar immediately. Remote work becomes way less painful when everyone can jump in from anywhere. Oh, and start simple - figure out what metrics your team actually looks at daily, then build around those. Don't overthink it at first.
First thing - match your chart type to what you're showing. Bar charts for comparing stuff, line graphs when you're tracking changes over time. Don't go crazy with colors either, stick to a consistent palette (seriously, those rainbow dashboards hurt my eyes). Label your axes clearly and don't shove too much data into one view - nobody wants to squint at a cluttered mess. Group related stuff together so it makes sense. Oh, and definitely check how it looks on different screens since people will pull it up on phones, tablets, whatever. Get feedback from whoever's actually gonna use this thing early on. They'll catch stuff you missed.
Basically, real-time data lets you see what's happening *now* instead of checking yesterday's stats. Your dashboard updates constantly, so problems pop up right away and you can actually do something about them. Way better than flying blind, you know? I mean, imagine trying to fix user issues or system crashes hours after they happen - nightmare scenario. You'll catch performance drops, weird user patterns, all that stuff as it's happening. Just make sure you set up alerts for things that actually move the needle for your business, not every tiny metric.
Hey! Authentication is your starting point - lock down who can see what data. HTTPS everywhere, obviously, and encrypt the sensitive stuff. Role-based permissions saved my butt on this one project where different teams kept seeing each other's metrics (awkward). API security matters too, plus input validation so nobody can inject nasty code. Oh and logging - you'll want to track who accessed what. Regular security audits are smart but honestly, nail the auth and encryption first. Those give you the biggest bang for your buck. Everything else can come later once you've got the basics solid.
Start with navigation - make it dead simple. Put your most crucial metrics right at the top where people can't miss them. I've literally seen dashboards that look like someone barfed spreadsheets everywhere, so don't be that person! For the detailed stuff, hide it behind expandable sections or tabs. Loading speed matters too - nobody's got patience for slow dashboards. Oh, and actually test your search function because half the time those things are useless. Really though, just ask yourself what your users check every single day versus what they might glance at once a month. Focus on the daily stuff first.
Your cloud dashboard gets way smarter when you add AI to the mix. It spots weird patterns automatically and flags potential issues before they actually blow up. Honestly, the predictive stuff is where it really shines - you'll get heads up about problems days ahead instead of panicking at 2am when everything crashes. No more manually hunting through endless metrics either. The AI just surfaces the important anomalies and tells you what needs optimizing. Most platforms have some AI monitoring features already built in, so I'd start there and see what clicks for you.
Dude, cloud dashboards are seriously clutch for compliance stuff. Real-time visibility into all your data governance and security controls without the headache. I've seen teams automate monitoring for GDPR, HIPAA, whatever regulations they need - beats the hell out of manual reporting. Your audit trails, data access logs, retention policies all get tracked automatically. Reports that used to take weeks? Now it's literally a few clicks. Oh and set up those key metrics as dashboard widgets so you catch problems early. Trust me, you'll wonder how you survived without it. Way better than scrambling around different systems when audit season hits.
Data integration is the absolute worst - nothing ever wants to talk to each other properly. Performance gets really sluggish when you're pulling live data from everywhere. Then there's security headaches since you're basically exposing all your sensitive stuff. People hate change too, even when the new thing is way better (honestly drives me crazy). Costs always balloon faster than you expect. Start with just one important metric instead of trying to do everything at once. Get that working smoothly first, then add more later. Trust me on this one.
Dude, cloud dashboards are a game changer for tracking spending. Connect all your accounts first - trust me, you need the full picture. The visual breakdowns will show you exactly which services are draining your budget. I bet you'll find some random stuff you forgot about that's still running. Set alerts for when costs hit certain amounts, and honestly? Automate shutdowns for non-critical stuff during off hours. Focus on whatever's costing the most first - that's where you'll see real savings. Sometimes I check mine and wonder what the hell I was thinking with some of these resources.
Good dashboards do real-time monitoring and analytics that actually matter for your setup. The crappy ones just show surface stuff, but decent ones give you predictive insights and alerts that don't go off every five minutes. Multi-cloud visibility is huge if you're running hybrid. API integrations are usually way better too. Honestly? The interface makes or breaks it when you're stuck looking at the thing all day. User permissions are cleaner on the pricier options. I'd definitely demo a few before committing - you'll know pretty quick which one doesn't make you want to throw your laptop.
First step is figuring out what systems you want pulling data into the dashboard - this part always drags on way longer than expected. APIs and webhooks are your main options for connecting everything. Grafana and DataDog already have connectors built for most monitoring tools, databases, and ticketing systems you're probably using. Check what your dashboard provider supports first. Most platforms handle SSO integration too, which is clutch since nobody wants another password to forget. Direct database connections work if you need real-time data feeds.
Dude, mobile dashboards are seriously clutch. Real-time alerts hit your phone so you can catch issues before they explode. I was at my kid's soccer game last month and spotted a server spike - fixed it right from the bleachers. The touch interfaces actually work well now, not like those clunky desktop versions crammed onto phones. Charts display properly too. You can troubleshoot on the go and loop in teammates instantly. Honestly beats being glued to your desk all day. Just grab your dashboard's app or bookmark the mobile site. Trust me, you'll need it at the worst possible moment.
Build your dashboard like Legos from the start - modular pieces instead of one giant block. Cloud tools that auto-scale are your friend here. Our system totally ate it during a growth surge because we didn't plan for this stuff early enough! Containerization and load balancing will save your butt. Honestly, the stress-testing part is kind of boring but super necessary - throw fake data at it that matches where you think you'll be in six months. Start tracking performance now so you'll catch problems before users start complaining.
Honestly, React or Vue.js are your best bet for the frontend - they're great with real-time updates. Backend-wise, I'd go Node.js or Python with Flask/FastAPI. Chart.js is super straightforward for visualizations, though D3.js is more powerful if you don't mind the steeper learning curve (took me forever to get comfortable with it). Grafana's actually perfect for cloud monitoring since it's built exactly for that. AWS CloudWatch and the other cloud monitoring tools plug right in too. I'd start basic with React + Chart.js and build from there.
-
Nice and innovative design.
-
It's always a delight to see new templates from you! I am extremely pleased with the fact that they are easy to modify and fit any presentation layout in seconds!