

SAP Analytics Cloud Powerpoint Presentation Slides




Try Before you Buy Download Free Sample Product
 Impress Your
 Audience
 100%
100% Editable
 Save Hours
 of Time


SAP Analytics Cloud SAC is an all-in-one service provided by SAP for business intelligence BI and predictive analytics. Here is a competently designed module on SAP Analytics Cloud. It will assist business organizations in drafting an actionable strategy to deploy SAP Analytics Cloud, a software as a service SaaS, to improve their decision-making capabilities for accelerated business growth. The deck includes a business profile of the organization covering vision, mission, employee count, and global presence. It contains a financial performance section to showcase the impact of poor decisions on its revenue and earnings per share. Then, it highlights the organizations key challenges in poor decision making, limited integrated business planning, and the non-existence of predictive analytics capabilities. Further, the PowerPoint deck includes the SAC deployment process flow, pricing plans, and installation options such as cloud and hybrid spaces. Also, the PPT module includes a budget, training plan, and the impact of installing SAP Analytics Cloud on business performance regarding fact-based decision making, accurate forecasting, and collaborative planning. Additionally, it contains dashboards for income forecasting, sales analysis, and HR department reporting. Get access to this 100 percent editable template now.
People who downloaded this PowerPoint presentation also viewed the following :
Content of this Powerpoint Presentation
Slide 1: This slide introduces SAP Analytics Cloud. State Your Company Name and begin.
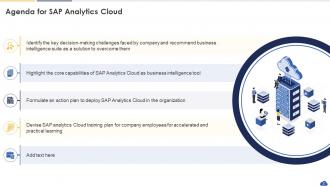
Slide 2: This slide states Agenda of the presentation.
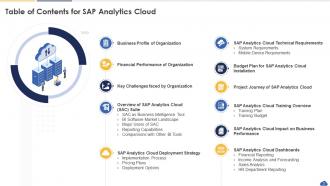
Slide 3: This slide presents Table of Content for the presentation.
Slide 4: This slide highlights title for topics that are to be covered next in the template.
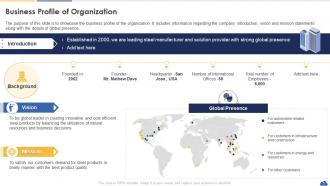
Slide 5: The purpose of this slide is to showcase the business profile of the organization.
Slide 6: This slide highlights title for topics that are to be covered next in the template.
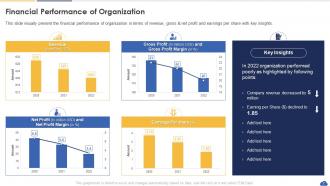
Slide 7: This slide visually present the financial performance of organization.
Slide 8: This slide highlights title for topics that are to be covered next in the template.
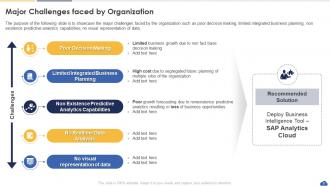
Slide 9: This slide represents Major Challenges faced by Organization.
Slide 10: This slide highlights title for topics that are to be covered next in the template.
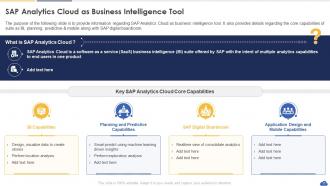
Slide 11: This slide showcases SAP Analytics Cloud as Business Intelligence Tool.
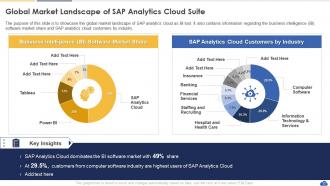
Slide 12: This slide shows Global Market Landscape of SAP Analytics Cloud Suite.
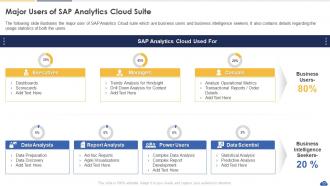
Slide 13: This slide presents Major Users of SAP Analytics Cloud Suite.
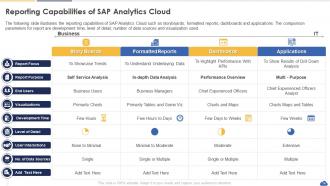
Slide 14: This slide displays Reporting Capabilities of SAP Analytics Cloud.
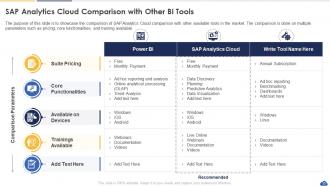
Slide 15: This slide represents SAP Analytics Cloud Comparison with Other BI Tools.
Slide 16: This slide highlights title for topics that are to be covered next in the template.
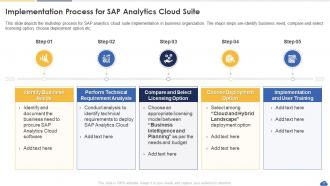
Slide 17: This slide showcases Implementation Process for SAP Analytics Cloud Suite.
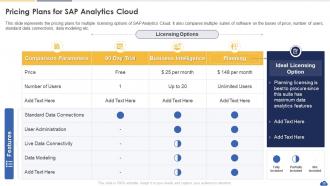
Slide 18: This slide represents the pricing plans for multiple licensing options of SAP Analytics Cloud.
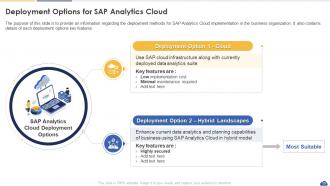
Slide 19: This slide showcases Deployment Options for SAP Analytics Cloud.
Slide 20: This slide highlights title for topics that are to be covered next in the template.
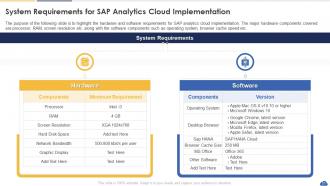
Slide 21: This slide shows System Requirements for SAP Analytics Cloud Implementation.
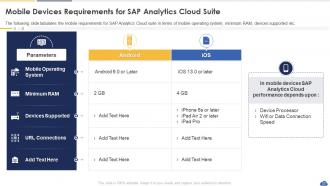
Slide 22: This slide presents Mobile Devices Requirements for SAP Analytics Cloud Suite.
Slide 23: This slide highlights title for topics that are to be covered next in the template.
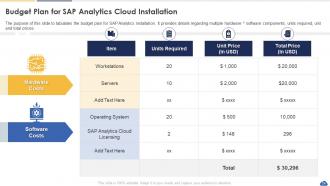
Slide 24: This slide displays Budget Plan for SAP Analytics Cloud Installation.
Slide 25: This slide highlights title for topics that are to be covered next in the template.
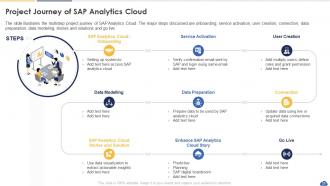
Slide 26: The slide illustrates the multistep project journey of SAP Analytics Cloud.
Slide 27: This slide highlights title for topics that are to be covered next in the template.
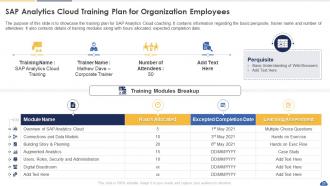
Slide 28: This slide represents SAP Analytics Cloud Training Plan for Organization Employees.
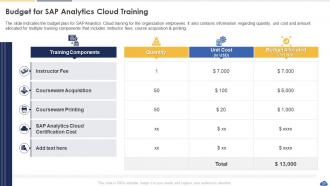
Slide 29: The slide indicates the budget plan for SAP Analytics Cloud training for the organization employees.
Slide 30: This slide highlights title for topics that are to be covered next in the template.
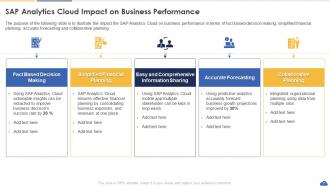
Slide 31: This slide showcases SAP Analytics Cloud Impact on Business Performance.
Slide 32: This slide highlights title for topics that are to be covered next in the template.
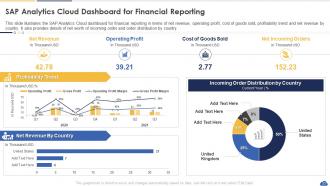
Slide 33: This slide shows SAP Analytics Cloud Dashboard for Financial Reporting.
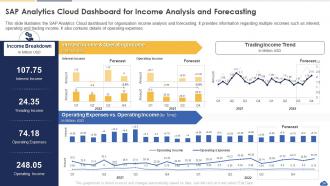
Slide 34: This slide presents SAP Analytics Cloud Dashboard for Income Analysis and Forecasting.
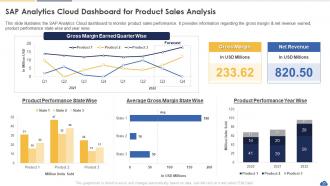
Slide 35: This slide displays SAP Analytics Cloud Dashboard for Product Sales Analysis.
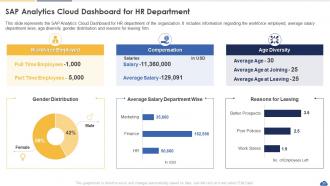
Slide 36: This slide represents SAP Analytics Cloud Dashboard for HR Department.
Slide 37: This slide showcases Icons for SAP Analytics Cloud.
Slide 38: This slide is titled as Additional Slides for moving forward.
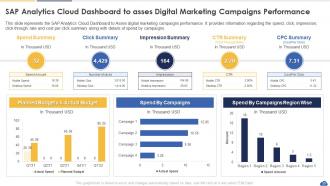
Slide 39: This slide shows SAP Analytics Cloud Dashboard to asses Digital Marketing Campaigns Performance.
Slide 40: This is Our Mission slide with related imagery and text.
Slide 41: This is Our Target slide. State your targets here.
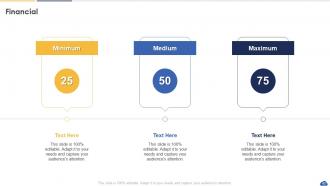
Slide 42: This is a Financial slide. Show your finance related stuff here.
Slide 43: This slide shows Post It Notes. Post your important notes here.
Slide 44: This slide depicts Venn diagram with text boxes.
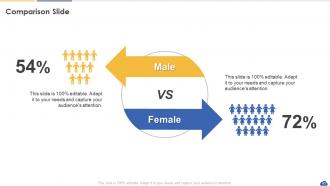
Slide 45: This is a Comparison slide to state comparison between commodities, entities etc.
Slide 46: This slide displays Mind Map with related imagery.
Slide 47: This slide shows Funnel with related imagery.
Slide 48: This slide presents Roadmap with additional textboxes.
Slide 49: This slide contains Puzzle with related icons and text.
Slide 50: This is a Timeline slide. Show data related to time intervals here.
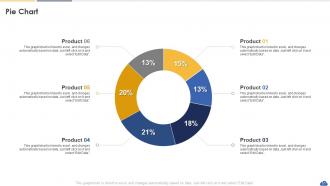
Slide 51: This slide shows Pie Chart with data in percentage.
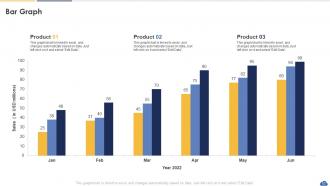
Slide 52: This slide presents Bar chart with two products comparison.
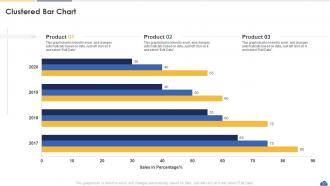
Slide 53: This slide provides Clustered Bar chart with two products comparison.
Slide 54: This is a Thank You slide with address, contact numbers and email address.
SAP Analytics Cloud Powerpoint Presentation Slides with all 59 slides:
Use our SAP Analytics Cloud Powerpoint Presentation Slides to effectively help you save your valuable time. They are readymade to fit into any presentation structure.






FAQs for SAP Analytics Cloud
Dude, the main thing with SAP Analytics Cloud is it does everything in one place - BI, planning, AND predictive stuff. Most other tools? You're stuck using like three different platforms. Obviously it connects great to SAP systems, but honestly the non-SAP integrations work pretty well too. The planning features are actually solid compared to regular BI tools that just... report things. Being cloud-native means no server nightmares on your end. Your team can collaborate on analyses in real-time, which is nice. If you're already using SAP stuff, definitely check it out - way cleaner than piecing together random solutions.
So SAP Analytics Cloud hooks up to your data through live connections, imports, or APIs. Native connectors work great for SAP stuff like S/4HANA and BW. Non-SAP sources? You've got options for major databases, cloud platforms, Excel, CSV - the usual suspects. Live connections are clutch since your data stays current without uploading constantly. Oh, and you can mix data from different sources in one model, which honestly saves so much headache. Start by figuring out what data sources you actually need though - don't get ahead of yourself there.
So SAP Analytics Cloud has these machine learning algorithms that'll forecast stuff using your old data. Pretty neat actually - you don't need to be some data science genius to use it. Just create predictive models right in your dashboards. The system does all the heavy lifting with data prep and picking algorithms. Point it at your data, tell it what to predict, and boom - you get forecasts with confidence intervals and what's driving the results. I'd start simple, maybe try forecasting sales numbers first to get the hang of it.
So SAC's ML features are pretty clutch - they'll automatically suggest chart types when you're stuck staring at your data. Smart insights pop up anomalies and trends you'd probably miss otherwise. You can drop forecasting straight into dashboards too, which beats switching between different tools. Oh, and it explains weird data points for you automatically. Honestly the chart suggestions alone are worth it. Just flip on "Smart Insights" in your stories first - it'll show you what patterns the system thinks are actually worth paying attention to.
Just hook SAP Analytics Cloud straight into your live data - works with SAP systems, cloud stuff, even Excel files. Dashboards update automatically when data changes, so no more stale numbers. Honestly, the real-time alerts are pretty clutch when KPIs go sideways. I'd start with whatever data you check obsessively - sales numbers, inventory levels, that kind of thing. Build your first dashboard around those since you'll actually use it. The whole "is this current?" headache just disappears once it's set up properly.
Figure out what your users actually need first - don't just throw all your data at them. Clean layouts with consistent colors work way better than flashy stuff. Honestly, the biggest mistake I see is people cramming everything onto one screen because they think it looks impressive. It doesn't. Strategic filters let people dig deeper without the initial overwhelm. Put your key metrics front and center, then group related stuff together logically. Oh, and definitely test it with real users before you call it done - they'll spot problems you totally missed.
So SAC's collaboration features are actually pretty solid. You can share planning models with your team and set permissions so people only access what they need. The real-time updates mean no one's working with stale data - honestly such a lifesaver. Multiple people can work on forecasts at the same time without conflicts, which is nice. The commenting system works well for discussing specific numbers too. Oh, and there's automated approval routing that sends stuff to the right stakeholders. My advice? Start small with maybe 3-4 people to test the workflow before going company-wide.
Yeah, SAP Analytics Cloud's got solid security features. Data gets encrypted whether it's sitting around or moving between systems. Role-based access is clutch - you can control exactly who sees what. Single sign-on works with whatever identity system you're already using, which honestly saves so much headache. The audit trails track everything users do, plus you get data lineage and all those compliance certs like SOC 2. Oh, and definitely set up your user roles first - that's where most people mess up and create security holes. Trust me on that one.
Yeah, SAP Analytics Cloud can definitely handle financial forecasting! The predictive analytics stuff is actually pretty solid - you just feed it your historical data and the machine learning does most of the work. What I like is you can build different scenarios and run what-if analyses, plus factor in external variables that might mess with your numbers. Real-time collaboration is clutch during budget season too. Oh, and connect your data sources first, then check out Smart Predict - that's probably your best starting point. The interface isn't terrible either, which is saying something for SAP.
Honestly, the mobile app is super handy - you can check all your dashboards and reports from anywhere. Real-time data, push notifications for alerts, the whole deal. Touch interface works really well too, so you can tap and swipe through everything instead of being stuck at your computer. Perfect when you're traveling or someone needs numbers right away. Oh, and definitely set up notifications for your main KPIs - I learned that one the hard way after missing some important changes. Way better than constantly refreshing stuff on your laptop.
First thing - figure out which reports are actually worth saving versus just starting over. Most of the time you can export your data models and use SAC's import wizard, but honestly? It's gonna be messy. The formatting never translates perfectly and you'll end up recreating half the visualizations anyway since SAC is kinda picky about how things display. I'd start with maybe 3-4 of your most important reports in a test environment first. Get those working smoothly, then tackle the rest. Trust me, don't try to migrate everything at once - learned that the hard way on my last project!
So SAP Analytics Cloud has this drag-and-drop story builder that's honestly pretty slick. You just combine charts, tables, and text to create narratives that business people can actually understand. Interactive dashboards let stakeholders dig into the data themselves instead of getting boring static reports (thank god). Add annotations for context, use smart discovery to highlight key stuff, even throw in videos or images if you want. Oh, and you can push everything to mobile so executives can check insights on the go - which they love. Just start with their templates, makes life way easier.
Honestly, SAC has some annoying quirks you should know about. Data modeling is way more restrictive than other BI tools I've used. Customizing charts? Good luck - you're basically stuck with SAP's default options. Performance gets sluggish with big datasets too, which is super frustrating when you're crunching millions of rows. The learning curve hits harder than expected since it mashes planning, analytics, and predictive stuff together. Oh, and definitely run a proper pilot with your real data first - don't just trust the demo. Better to find out now if it actually works for your specific needs.
SAC has really good customization options for reports. You can drag and drop visualizations around, set up custom filters, and build calculated measures for whatever KPIs you're tracking. The styling stuff is decent - colors, fonts, layouts can all match your company's look or just make things cleaner. Dynamic parameters are clutch because then users can slice the data themselves instead of constantly asking for new reports (which gets old fast). I'd start with basic charts and filtering first, then add the more advanced features once you get the hang of it.
So SAP has this free Learning Hub that's actually decent now - way better than their old stuff. I'd start there with the "Getting Started" path, then focus on whatever you'll use most like dashboards or planning. The SAP Community forums are solid too, lots of real examples from people who've been there. Your company might spring for the instructor-led classes if they have budget, those are pretty thorough. Honestly though, the free route works fine if you're just getting your feet wet first.
-
Making a presentation has never been this easy for me. Thank you SlideTeam for offering a splendid template library.
-
I’ve been your client for a few years now. Couldn’t be more than happy after using your templates. Thank you!