

Company Valuation Powerpoint Presentation Slides






Try Before you Buy Download Free Sample Product
 Impress Your
 Audience
 100%
100% Editable
 Save Hours
 of Time


Get ready-made Company Valuation PowerPoint Presentation Slides to analyse all the profit and net value your business has made. Conduct a thorough evaluation of a company’s management, capital structure, future earning prospects, and more with the help of professionally designed company valuation PPT presentation templates. Determine the current worth of a business and assess all aspects of a business. This deck comprises of several company valuation PowerPoint templates like valuation methodology, valuation steps, company valuation methodologies, determining free cash flow, valuation results, business due-diligence process, strategic due-diligence methodology, and more. Incorporate business valuation PowerPoint slideshow to estimate the selling price of the business. Use business valuation methods PowerPoint techniques for valuing a business asset such as cost approach, cost to build, replacement cost, market approach, discounted cash flow, forecast future cash flow, etc. Grab access to the company valuation complete PowerPoint deck for a business analysis. Employ a few jocular expressions with our Company Valuation Powerpoint Presentation Slides. It helps insert a bit of humor.
People who downloaded this PowerPoint presentation also viewed the following :
Content of this Powerpoint Presentation
Slide 1: This slide introduces Company Valuation. State Your Company Name and begin.
Slide 2: This slide presents Valuation Methodology which further showing some of the methodology in form of flow chart.
Slide 3: This slide shows Valuation Steps with these some of the approaches- Asset – Based Approach, Reconcile indicated value(S) to arrive at a conclusion of value Present findings in a report, Consider valuation adjustments (e.g. discounts or premiums), Income Approach, Market Approach. Consider all three (3) valuation approaches, Obtain an in – depth understanding of the business and business ownership interest, Perform a thorough financial and qualitative analysis.
Slide 4: This slide showcases Company Valuation Methodologies. We have listed out all the commonly used valuation methodologies. Highlight the one which you are going to use. Since DCF and relative valuation is the most commonly used method, we have discussed it in detail in the later slides
Slide 5: This slide presents Discounted Free Cash Flow (DCF) Technique - Data Set. You can add the data and make use of it.
Slide 6: This slide showcases Determining Free Cash Flow. Add the data in this and make use of it.
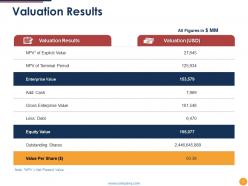
Slide 7: This slide shows Valuation Results. The following methodology will help in determining the Equity value & Value per share of the company
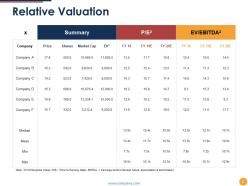
Slide 8: This slide showcases Relative Valuation with summary and P/e with company details.
Slide 9: This slide displays Business Due-Diligence Process with four steps. Add your own information and make use of it.
Slide 10: This slide showcases Strategic Due-Diligence Methodology. You can add the details and make use of it.
Slide 11: This slide presents Company Valuation Icon Slide.
Slide 12: This slide showcasesCoffee Break Time.
Slide 13: This slide displays the title Charts & Graphs.
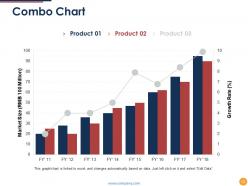
Slide 14: This slide showcases Combo Chart. With this you can compare the products.
Slide 15: This slide presents Scatter line. Add the dat and use it accordingly.
Slide 16: Area Chart www.company.com 16 Product 01 Product 02 100% This graph/chart is linked to excel, and changes automatically based on data. Just left click on it and select “Edit Data”.
Slide 17: This slide is titled Additional slides.
Slide 18: This slide contains Our Mission with text boxes.
Slide 19: This slide showcases Our Team with Name and Designation to fill.
Slide 20: This slide helps show- About Our Company. The sub headings include- Creative Design, Customer Care, Expand Company .
Slide 21: This slide shows Our Goals for your company.
Slide 22: This slide shows Comparison of Positive Factors v/s Negative Factors with thumbsup and thumb down imagery.
Slide 23: This is a Financial Score slide to show financial aspects here.
Slide 24: This is a Quotes slide to convey message, beliefs etc.
Slide 25: This slide displays a Venn diagram image.
Slide 26: This is a Thank You image slide with Address, Email and Contact number.
Company Valuation Powerpoint Presentation Slides with all 26 slides:
Insist on considering facts alone with our Company Valuation Powerpoint Presentation Slides. Demonstrate intellectual integrity.
-

Company Valuation
-
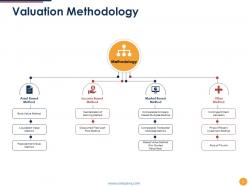
Valuation Methodology
-

Valuation Steps
-
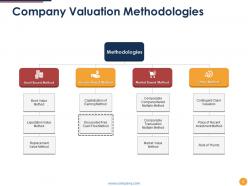
Company Valuation Methodologies
-
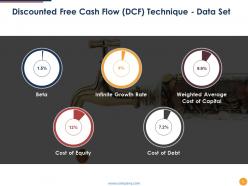
Discounted Free Cash Flow DCF Technique Data Set
-
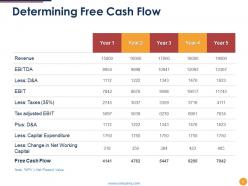
Determining Free Cash Flow
-
Valuation Results
-
Relative Valuation
-

Business Due Diligence Process
-

Strategic Due Diligence Methodology
-
Company Valuation Icon Slide
-

Coffee Break Time
-

Graphs And Charts
-
Combo Chart
-
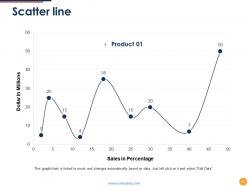
Scatter line
-
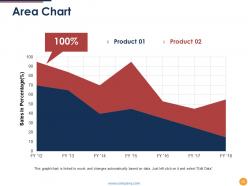
Area Chart
-

Additional Slides
-

Our Mission
-

Meet Our Team
-

About Us
-

Our Goals
-

Comparison
-
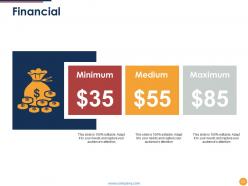
Financial
-

Company Valuation
-
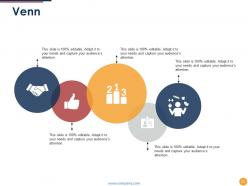
Venn
-

Thank You
FAQs for Company Valuation
So there's basically three ways to value a company. Asset-based just looks at what they own minus debt - simple but usually lowballs growing businesses. Then there's income-based like DCF where you project future cash flows and discount them back (though honestly those projections are often total guesswork). Market-based compares to similar companies that sold recently or are public. Each works better for different industries and situations. Oh and definitely use at least two methods to get a decent range - don't just pick one and call it done.
Look, market vibes totally change what people will pay for companies. Bull markets? Everyone's throwing money around and P/E ratios go crazy high. Bear markets flip that script - suddenly nobody cares about your "growth story" if it's overpriced. Interest rates mess with your DCF models too since they change discount rates. Honestly, I learned this the hard way last year. The trick is comparing to recent deals, not some old benchmarks from 2019. Current market sentiment matters way more than historical averages when you're actually trying to price something.
Look, financial statements are your starting point for any valuation - they've got all the raw data you need. Pull revenue, margins, cash flow, and debt straight from the income statement, balance sheet, and cash flow statement. That's what feeds your models. But here's the thing - you can't value a company with garbage data. It's like trying to bake without knowing what's actually in your ingredients. Quality of your valuation depends entirely on solid financials. Always check the footnotes too. Companies love hiding weird accounting stuff in there that'll mess up your numbers if you're not careful.
Honestly, there are a few ways to tackle this. Most people go with the income approach - figure out what cash flows the brand will generate, then discount back to today's value. Market approach is another option where you compare to similar brand sales, but finding good matches is basically impossible. Cost approach just adds up what it'd take to build the brand from zero. My take? Don't overthink getting one perfect number. Use two or three methods and see where they land you - that range is probably more realistic anyway than pretending you can nail it exactly.
So EBITDA strips away all the financial engineering stuff - taxes, interest payments, depreciation - and shows you what the business actually makes from operations. Investors love it because they can plug in their own financing structure later. Makes sense, right? It's also clutch for comparing companies that might have totally different debt loads or tax situations. Like, you can finally see apples to apples. Just don't completely ignore those "removed" costs though - interest and taxes are still real money going out the door that whoever buys will have to deal with.
So you'd bake future growth into your DCF by bumping up those revenue projections and terminal value rates. If you think the company's gonna crush it compared to competitors, forecast higher cash flows in the later years. The hard part? Being realistic about it - I've seen way too many people convince themselves they're valuing the next Amazon when it's really just another decent business. You need actual reasons for those growth assumptions though, like solid expansion plans or new products in the pipeline. Definitely run conservative, base case, and optimistic scenarios to see how much your valuation swings.
So industry comps are basically your sanity check - you look at what similar companies are trading for and use those multiples (P/E, EV/EBITDA, revenue multiples) to value your target. Pretty straightforward stuff. Finding truly comparable companies though? That's where it gets annoying. You need similar size, growth, margins - the whole package. I usually grab like 5-10 solid comps and see where my company lands in that range. Just don't get lazy with the selection process or you'll end up comparing a tech startup to IBM or something equally useless.
So basically, when interest rates go up, it makes future cash flows worth less today - which absolutely murders growth stocks since they're all about future potential. Inflation's weird though. Sure, companies might get higher revenues, but their costs spike too. Higher rates also make bonds look way more appealing than stocks, so money flows out of equities. Different sectors get hit differently, which is honestly kind of annoying to track. My advice? Look for companies that can actually raise their prices when inflation hits, and ones with solid cash flow right now. And yeah, you'll want to recalculate your valuations when rates move big.
Don't get stuck using old comps or fall in love with just one valuation method. I've watched so many deals blow up because people assumed crazy growth rates like 30% forever - totally unrealistic. Management quality matters way more than people think, even if the financials look amazing. Market conditions can mess everything up too. You want to run DCF, comp analysis, and precedent transactions, then see where they all land. Never put all your eggs in one basket with these things. Oh, and seriously avoid those overly optimistic projections - they'll bite you every time.
Honestly, company size totally changes how you value businesses. Big public companies? You've got tons of data, so comparable analysis and DCF models work great. But small businesses are a nightmare - their books are usually messy, so you end up using asset-based methods or whatever industry multiples you can find. Private companies fall somewhere between the two. The trick is just matching your approach to whatever decent data you can actually get your hands on. Don't overthink it with some complex model when the numbers aren't even reliable to begin with.
DCF calculates what your company's actually worth by projecting future cash flows and bringing them back to today's value. Pretty straightforward math, honestly. CCA works differently - you're comparing your business to similar public companies already trading. It's like selling your house. DCF would be figuring out construction costs and rental potential. CCA? Just seeing what comparable houses sold for in your area recently. Oh, and definitely run both methods. They'll give you a solid range and one usually backs up the other.
So basically you bump up your discount rate when there's more risk involved - riskier companies need to offer higher returns to attract investors, which drives down the present value. In DCF models, I usually increase the WACC based on stuff like market volatility or regulatory headaches. Beta calculations are honestly such a headache but they do help quantify this. Oh and definitely run some scenarios with different risk assumptions - like what happens if things go south? Document the risks you can't put numbers on. The key is running sensitivity analyses so you can see how different risk levels mess with your valuation range.
So ownership structure totally changes how much a company's worth. Majority stakes get like 20-30% premiums because you actually control stuff - makes sense, right? But minority positions? They usually take 10-25% haircuts since you're basically just along for the ride. Public companies trade higher than private ones mostly due to liquidity. Family businesses are weird though - sometimes they get discounted for sketchy governance, other times they're worth more because they're stable. I've seen it go both ways honestly. Just make sure you're thinking about who owns what when you're running numbers.
Honestly, I'd do it at least once a year, but it really comes down to where you're at. If you're early stage? Maybe quarterly since everything's moving so fast. More established companies can probably get away with annual check-ins. But here's the thing - don't just stick to a schedule. Big product launch, fundraising round, or your industry gets shaken up? Time for a fresh look. I actually missed doing this once and it bit me during negotiations. Set a reminder right now or you'll totally forget. Trust me on that one.
You'd use liquidation value when a company's basically circling the drain - bankruptcy, might shut down, that kind of mess. Manufacturing companies are perfect examples. If they're struggling, you don't care about ongoing operations anymore. What matters is what those machines would sell for at auction, you know? Asset-heavy businesses make sense for this too. Insurance companies love liquidation values for obvious reasons. Honestly, any time you're worried about downside risk or the business won't survive, that's when you'd calculate it instead of fair market value.
-
Enough space for editing and adding your own content.
-
Amazing product with appealing content and design.