


Valuation Of Shares Powerpoint Presentation Slides





Try Before you Buy Download Free Sample Product
 Impress Your
 Audience
 100%
100% Editable
 Save Hours
 of Time


Clientele grows with our Valuation Of Shares Powerpoint Presentation Slides. Give a big boost to your customer base.
People who downloaded this PowerPoint presentation also viewed the following :
Content of this Powerpoint Presentation
Slide 1: This slide shows the Valuation of Shares as per your company. State your company name here and get started.
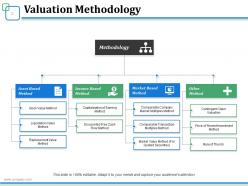
Slide 2: This slide shows Valuation Methodology flow chart with four basic divisions- Asset Based Method, Income Based Method, Market Based Method, Other Method. It also shows the sub points of these categories individually.
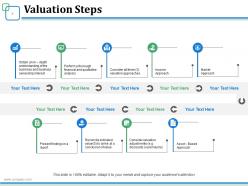
Slide 3: This slide shows Valuation Steps which are- Obtain an in – depth understanding of the business and business ownership interest, Perform a thorough financial and qualitative analysis, Consider all three (3) valuation approaches, Income Approach, Market Approach, Reconcile indicated value(S) to arrive at a conclusion of value, Present findings in a report, Asset – Based Approach, Consider valuation adjustments (e.g. discounts or premiums).
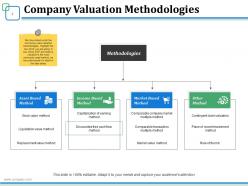
Slide 4: This slide shows Company Valuation Methodologies. We have listed out all the commonly used valuation methodologies. Highlight the one which you are going to use. Since DCF and relative valuation is the most commonly used method, we have discussed it in detail in the later slides.
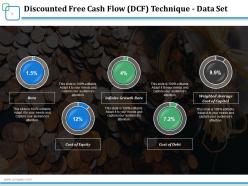
Slide 5: This slide presents Discounted Free Cash Flow (DCF) Technique - Data Set showing- Beta, Cost of Equity, Infinite Growth Rate, Cost of Debt, Weighted Average Cost of Capital.
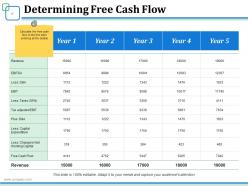
Slide 6: This slide presents yearly stats for Determining Free Cash Flow in a tabular form. Showcase various attributes such as Revenue, EBITDA etc. here.
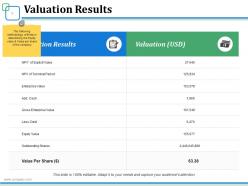
Slide 7: This slide presents Valuation Results table. Showcase your company/ business valuation result here.
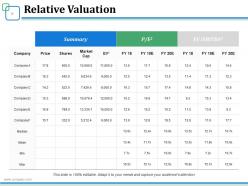
Slide 8: This slide presents Relative Valuation with three main sub headings- Summary, P/E2, EV/EBITDA3 to be discussed.
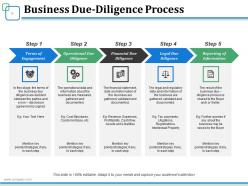
Slide 9: This slide showcases Business Due-Diligence Process with these five steps that we have mentioned.
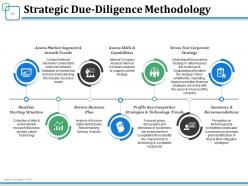
Slide 10: This slide shows Strategic Due-Diligence Methodology. We have also listed few its features like- Assess Market Segment & Growth Trend, Assess Skills & Capabilities, Stress Test Corporate Strategy, Baseline Starting Situation etc. that you can use.
Slide 11: This is an Icon Slide showing a number of icons that you can alter as per your need.
Slide 12: This is a Coffee Time slide . Can be altered as per requirement.
Slide 13: This slide forwards to Graphs And Charts. You can alter the content as per need.
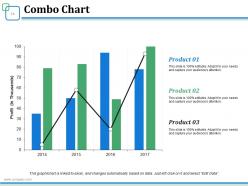
Slide 14: This slide presents Combo Chart to show product/ entity growth, comparison etc.
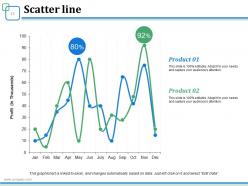
Slide 15: This is a Scatter Line slide to show product/ entity comparison, specifications etc.
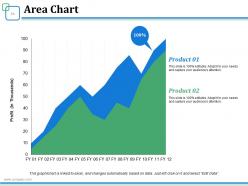
Slide 16: This is an Area Chart slide to show product/ entity growth, comparison, specifications etc.
Slide 17: Additional Slides
Slide 18: This slide showcases Our Mission. Show your company mission and goals here.
Slide 19: This is Meet Our team slide with names and designation.
Slide 20: This is an About us slide to state company specifications etc.
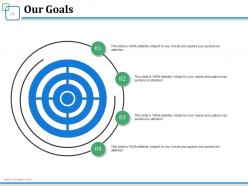
Slide 21: This is Our Goal slide. State your important goals here.
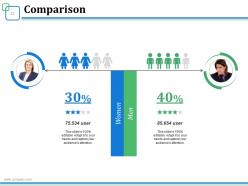
Slide 22: This slide showcases Comparison of two entities in male female chart imagery form.
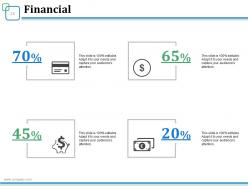
Slide 23: This is a Financial score slide. State financial aspects, information etc. here.
Slide 24: This is a Quotes slide to convey company/ organization message, beliefs etc. You may change the slide content as per need.
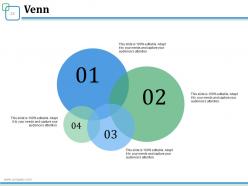
Slide 25: This is a Venn diagram image slide to show information, specifications etc.
Slide 26: This is a Thank You slide with Address# street number, city, state, Contact Numbers, Email Address.
Valuation Of Shares Powerpoint Presentation Slides with all 26 slides:
Augment your ability to function with our Valuation Of Shares Powerpoint Presentation Slides. They are an asset worth having.









FAQs for Valuation Of Shares
So there's three main ways people value stocks. Fundamental analysis is where you dive into the company's actual financials - earnings, debt, revenue growth, that whole DCF thing. Then there's technical analysis, which is basically reading charts and price patterns (I swear some of it feels like astrology lol). Comparative valuation compares your stock to similar companies using ratios like P/E. Pretty straightforward stuff. Most smart investors I know mix at least two methods - you don't want to bet everything on just one approach. Charts can lie, but so can balance sheets sometimes.
DCF models basically try to figure out what a company's actually worth by looking at future cash flows and discounting them back to today's dollars. You project cash generation over maybe 5-10 years, then apply a discount rate based on risk. Most analysts swear by this method since it focuses on real cash instead of whatever Wall Street's feeling that day. Getting your growth assumptions right is crucial though - mess up the discount rate and you'll be way off. I always start conservative and run different scenarios. Oh and stress-test everything because you never know what'll happen.
Dude, market sentiment basically trumps everything else when it comes to stock prices. Like, investors' feelings about a company can matter way more than the actual financials - it's honestly wild sometimes. You've got solid companies getting hammered just because people are scared, while mediocre ones moon because everyone's hyped. Two identical businesses? They'll trade at completely different valuations just based on vibes. I learned this the hard way last year. Short-term price moves are all about emotion, so you gotta read the room before making any calls on what shares are really worth.
So P/E ratio is basically stock price divided by earnings per share - shows you what people are willing to pay for every dollar the company makes. Compare it to similar companies or what that stock usually trades at. High P/E could mean everyone expects big growth (or maybe it's just overpriced, who knows). Low P/E might be a steal or there's something sketchy going on. Only downside is it uses old earnings data. You'll want to check the PEG ratio too, or forward P/E if you can find it. Pretty useful for quick comparisons though.
Intrinsic value is what a stock's actually worth when you crunch the numbers - earnings, assets, growth prospects, all that. Then there's extrinsic value, which is just market emotions messing with the price. Say you figure a stock should be $50 based on solid fundamentals, but it's at $65 because everyone's going crazy over AI or some trend. That extra $15? Pure hype. Still real money though, which is kinda wild if you think about it. I'd focus on intrinsic stuff for long-term plays, but you can't totally ignore the hype when timing your buys and sells.
So macro stuff is basically the big economic backdrop that moves everything. Interest rates going up makes future cash flows worth less, so stock prices drop. Inflation's a pain because it hits both what companies pay for materials AND what consumers can spend - super hard to predict tbh. GDP growth shows if the economy's healthy, which usually means better corporate profits. Oh and currency moves really matter for companies doing business overseas. I always peek at Fed announcements and jobs data when I'm wondering why my stocks suddenly tanked or jumped. None of this is company-specific, but it sets the whole playing field.
So dividends basically show you the actual cash you'll get back from owning shares. There are valuation models that literally calculate what a stock's worth based on future dividend payments - pretty straightforward when you think about it. Even companies that don't pay dividends yet still get valued partly on whether they might start later. It's kinda like that fruit tree analogy, right? Companies with solid dividend track records usually trade higher because people love that steady income. Honestly, I always look at both the current yield and whether they're likely to keep growing those payments.
So basically you need industry comps to sanity-check your valuation work. Look at P/E ratios and EV/EBITDA multiples from similar companies - if you're wildly different, something's probably wrong. It's honestly like checking your homework against other people's answers. Without this context, you might accidentally value a tech startup like it's some boring utility stock (been there). Growth rates, margins, risk - all that stuff needs to match what's realistic for the sector. I usually grab 4-5 comparable companies minimum when I'm doing this.
Yeah, so here's the thing with historical data - you're basically driving forward while staring at your rearview mirror. Past performance doesn't guarantee future results, right? Companies pivot, markets shift, entire industries get disrupted by some new tech nobody saw coming. I mean, look at how COVID flipped everything upside down. Historical trends are decent for getting a baseline feel for things, but you can't just stop there. You'll want to dig into what's actually happening now - industry changes, current market vibes, where the company's headed. Don't put all your eggs in the backwards-looking basket.
When geopolitical stuff hits the fan, different sectors get whipsawed in pretty predictable ways. Defense and energy stocks usually rocket up during conflicts. Travel and luxury brands? They get absolutely crushed. Financial services are weird though - they can swing wildly depending on interest rates and which regions they're exposed to. Tech and healthcare typically ride it out better, unless you're dealing with trade wars or supply chain chaos. I'd run some stress tests on your portfolio, especially if you're heavy in companies with global footprints. Actually, travel stocks might be worth watching for bounce-back plays once tensions cool down.
So tech is basically flipping stock valuation on its head right now. Real-time analytics and AI models can crunch data in seconds vs the old quarterly report grind. Machine learning spots market patterns we'd totally miss - honestly it's getting pretty crazy how fast this stuff moves. Makes everything way more dynamic, but yeah, the downside is your models can be wrong and markets get even more volatile. Oh and algorithmic trading is everywhere now too. My take? Learn these tools for sure, but don't ditch the fundamentals. Use tech to boost your analysis, not replace actually thinking through stuff.
Dude, management quality can totally make or break your investment. You're basically betting these people know what they're doing with your money. Good leaders can save a dying company or squeeze even more profits from successful ones. Bad executives? They'll destroy anything, even businesses with solid fundamentals. Check their track record and how they've made decisions in the past. Also pay attention to how they talk to shareholders - are they straight shooters or full of corporate BS? Trust me, if you don't believe in the leadership team, just walk away. The numbers might look pretty but incompetent management will find a way to screw it up.
So basically, when companies buy back their own shares, it usually drives the price up. Simple supply and demand - fewer shares floating around means each one's worth more. Also signals that management thinks their stock is cheap right now, which gets investors excited. Though honestly, I've seen it not work sometimes depending on what else is happening in the market. One thing to check - are they using cash they actually have or borrowing money to do it? Makes a difference in how sustainable it really is.
Don't get obsessed with P/E ratios - they're just one piece of the puzzle. Cash flow matters way more than most people think. Also, stop holding onto stocks just because you paid more for them originally (guilty of this myself lol). Market hype will mess with your head every time. Look at debt levels and how they stack up against competitors too. Oh, and forget about timing the market perfectly - it's basically impossible. Use different valuation methods like DCF and comparable analysis. Understanding the actual business is what counts.
So basically behavioral finance shows why markets act crazy - it's all about psychology vs logic. People chase momentum and create bubbles when they're overconfident. Or they anchor to old prices and miss good deals. I mean, we've all held onto losers way too long because nobody likes admitting they screwed up, right? Herding behavior causes crashes that spreadsheets can't predict. The cool part? These emotional mistakes create real opportunities. When everyone's panicking or getting too hyped, that's usually when the math doesn't match reality and smart money can capitalize.
-
Content of slide is easy to understand and edit.
-
Designs have enough space to add content.