


Private Equity Powerpoint Presentation Slides


Try Before you Buy Download Free Sample Product
 Impress Your
 Audience
Editable
of Time


SlideTeam presents you yet another archetypal design for your private equity PowerPoint presentation slides. Enforced with various processes, and flat designs, Private Equity demands a clear representation of planning and growth. While dealing with funds and investors that directly invest in private companies, or that engage in buyouts of public companies, one needs to be sure of the concerns being projected. Initiating with the table of contents, we have highlighted executive summary, key problems, and solution, financial and growth plans, and growth charts. Private Equity relates to venture capital and angel investors, making it a critical presentation for the organization's future. The visions used here are tentatively chosen in relevance to the motive of this exhibition. Big images add brevity to the slides and appropriate colors add a minimal touch to your projection. Download this presentation for a perpetual experience and leave an obstinate impression while explaining your agendas and concepts through this impressive PowerPoint design. Our Private Equity Powerpoint Presentation Slides deliver bigger benefits. They also do it at a lesser cost.
People who downloaded this PowerPoint presentation also viewed the following :
Content of this Powerpoint Presentation
Slide 1: This slide introduces Private Equity. State your Company.
Slide 2: This slide presents Table Of Contents. Show your points and make it for your company.
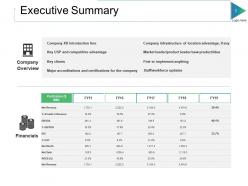
Slide 3: This slide showcases Executive Summary with financial and overview.
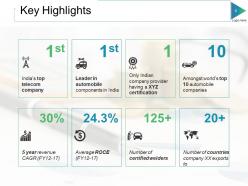
Slide 4: This slide presents Key Highlights with some parameters.
Slide 5: This slide shows The Problem. You can add the problem and solution.
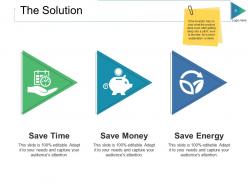
Slide 6: This slide presents The Solution with these three factors- Save Time, Save Money, Save Energy, If the investor has no clue what the product does even after getting deep into a pitch; now is the time for a short explanation or demo
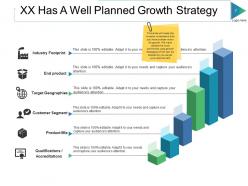
Slide 7: This slide showcases XX Has A Well Planned Growth Strategy with these six factors- Product Mix, Qualifications / Accreditations, Customer Segment, Target Geographies, End product, Industry Footprint, This slide will make the investor understand that you have a clear vision for growth. We have added the most commonly used growth strategies which can be altered by you as per your requirement
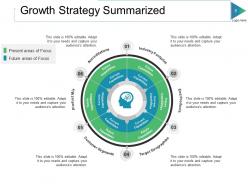
Slide 8: This slide presents Growth Strategy Summarized with these six parameters.
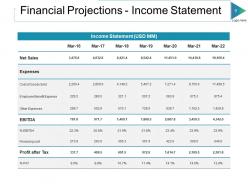
Slide 9: This slide showcases Financial Projections - Income Statement.Add the Income Statement (USD MM).
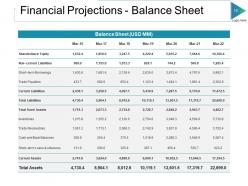
Slide 10: This slide presents Financial Projections - Balance Sheet. Add the Balance Sheet (USD MM) and make use of it.
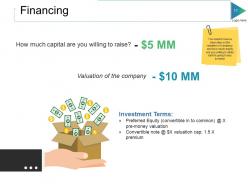
Slide 11: This slide shows Financing. You need to have a clear idea on the valuation of company, and how much equity are you willing to dilute before going to any investor.
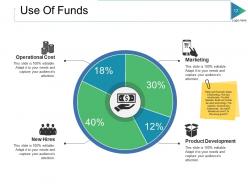
Slide 12: This slide showcases Use Of Funds with these four factors- Operational Cost, New Hires, Marketing, Product Development. Relevant Example: Sales & Marketing, Hire key employees, Founder Salaries; Build out/further develop technology, File patents; Achieve key milestones: 1st client? Breakeven time? 3x Revenue growth?
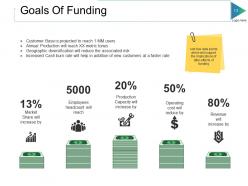
Slide 13: This slide showcases Goals Of Funding. Add few data points which will support the implications of after-effects of funding.
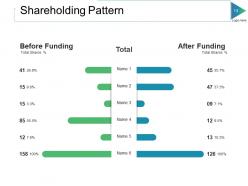
Slide 14: This slide presents Shareholding Pattern. Add the before and after funding.
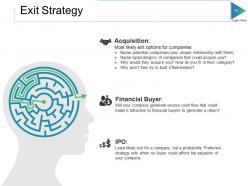
Slide 15: This slide shows Exit Strategy which further showcases three of the factors.
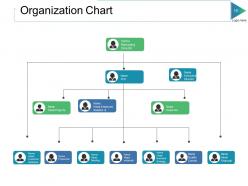
Slide 16: This slide presents Organization Chart. You can add the team member names.
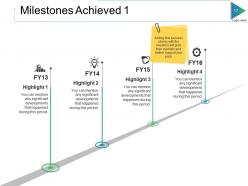
Slide 17: This slide showcases Milestones Achieved 1. Adding few success stories with the investors will grab their eyeballs and further support your pitch.
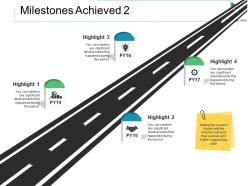
Slide 18: This slide presents Milestones Achieved 2. Adding few success stories with the investors will grab their eyeballs and further support your pitch
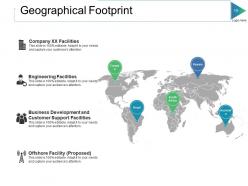
Slide 19: This slide showcases Geographical Footprint with which you can add with several different factors.
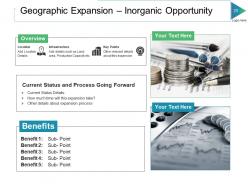
Slide 20: This slide presents Geographic Expansion – Inorganic Opportunity.
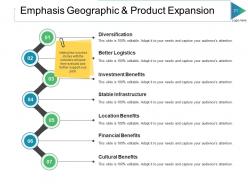
Slide 21: This slide showcases Emphasis Geographic & Product Expansion. Adding few success stories with the investors will grab their eyeballs and further support your pitch.
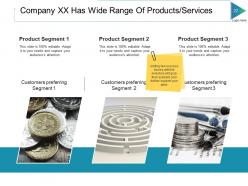
Slide 22: This slide presents Company XX Has Wide Range Of Products/Services. Adding few success stories with the investors will grab their eyeballs and further support your pitch
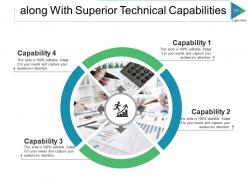
Slide 23: This slide shows along With Superior Technical Capabilities. Add the four capabilities and use of it.
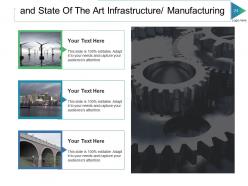
Slide 24: This slide presents and State Of The Art Infrastructure/ Manufacturing.
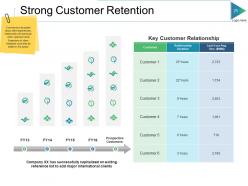
Slide 25: This slide showcases Strong Customer Retention. Comments to be added about client experiences, relationship with particular client, special events
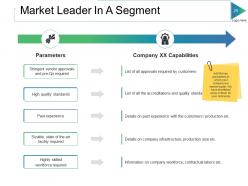
Slide 26: This slide shows Market Leader In A Segment. Add the key parameters in which your company is a market leader. We have shortlisted some of them for your reference
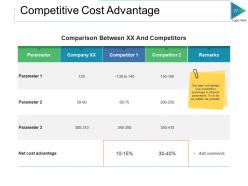
Slide 27: This slide presents Competitive Cost Advantage. This slide will highlight your competitive advantage in different parameters. Try to be as realistic as possible.
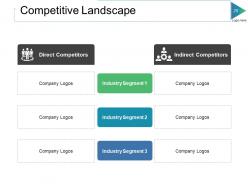
Slide 28: This slide showcases Competitive Landscape with two kinds of the competitors.
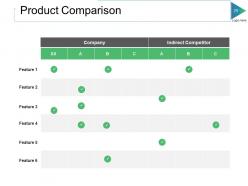
Slide 29: This slide showcases Product Comparison table with features and product name.
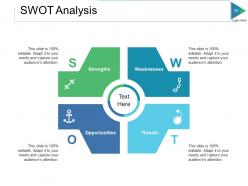
Slide 30: This slide presents SWOT Analysis with these four parameters- Opportunities, Weaknesses, Threats, Strengths.
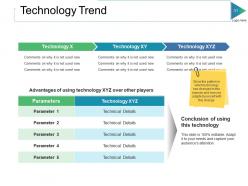
Slide 31: This slide presents Technology Trend. Show the pattern in which technology has changed in this industry and how you adapted yourself with this change.
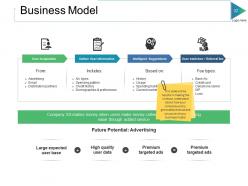
Slide 32: This slide showcases Business Model.This slide will be helpful in making the investor understand about how your company works, generates revenue and structure of your business model
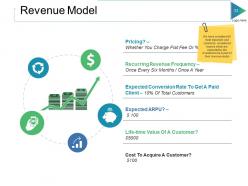
Slide 33: This slide shows revenues model .We have considered 6 most important and commonly considered factors which are expected by the investors to be a part of their revenue model
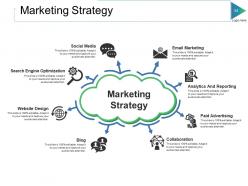
Slide 34: This slide showcases Marketing Strategy with these factors- Email Marketing, Analytics And Reporting, Paid Advertising, Collaboration, Blog, Website Design, Search Engine Optimization, Social Media, Marketing Strategy.
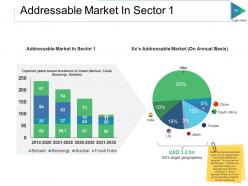
Slide 35: This Addressable Market In Sector 1. Show the market potential in each of your segment and try to be as realistic as possible. You can use two approaches: 1. Bottom-up approach where you calculate and show the working or 2. direct approach where do you do some secondary research for the market size
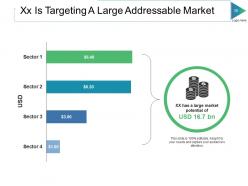
Slide 36: This slide presents Xx Is Targeting A Large Addressable Market with which you can add the better graphical form.
Slide 37: This slide showcases Financial Summary with which you can add the summary financial and revenue splits.
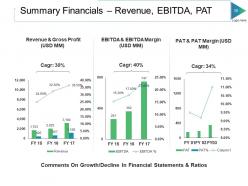
Slide 38: This slide presents Summary Financials – Revenue, EBITDA, PAT with different graphs.
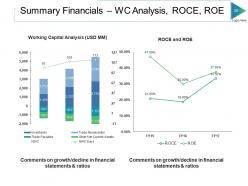
Slide 39: This slide showcases Summary Financials – WC Analysis, ROCE, ROE with working capital and Roce.
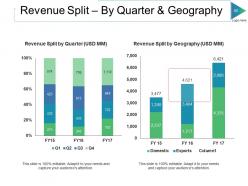
Slide 40: This slide presents Revenue Split – By Quarter & Geography. Add the data and use it properly.
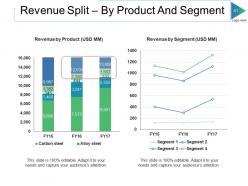
Slide 41: This slide shows Revenue Split – By Product And Segment with these graphical representation.
Slide 42: This slide presents Client Testimonials.
Slide 43: This is a Coffee Break slide to halt. You may change it as per requirement.
Slide 44: This slide is titled Charts & Graphs to move forward.
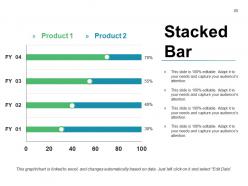
Slide 45: This slide presents a Stacked Bar graph in arrow form with text boxes.
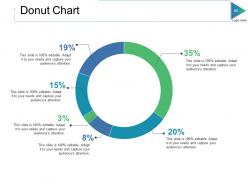
Slide 46: This slide showcases Donut Chart with which you can compare the products.
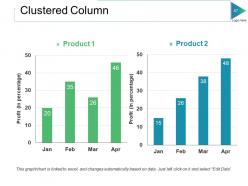
Slide 47: This slide presents Clustered Column. You can add the data as per your requirement.
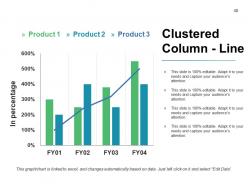
Slide 48: This slide showcases Clustered Column - Line.
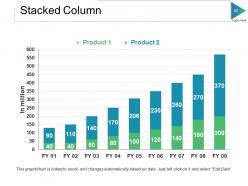
Slide 49: This slide presents Stacked Column.
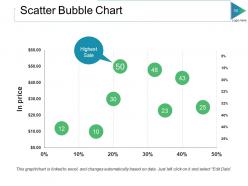
Slide 50: This slide shows Scatter Bubble Chart. You can add the details as per you want.
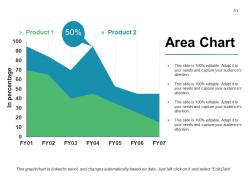
Slide 51: This is an Area Chart slide for product/entity comparison
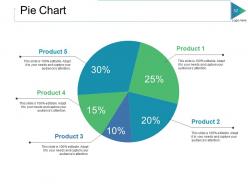
Slide 52: This slide showcases Pie Chart with a percentage score you can calculate.
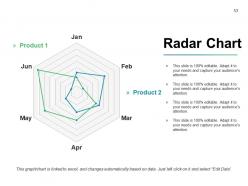
Slide 53: This slide presents Radar Chart. Add the requirement and use it.
Slide 54: This slide is titled Additional Slides to move forward.
Slide 55: This is an Our Goal slide. State them here.
Slide 56: This slide showcases Our Team with Name and Designation to fill.
Slide 57: This slide helps show- About Our Company. The sub headings include- Creative Design, Customer Care, Expand Company
Slide 58: This slide shows Comparison of number of users and Time.
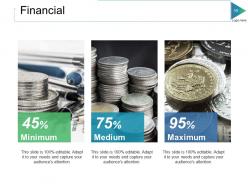
Slide 59: This slide displays Financial Projections And Key Metrics for customers and employees.
Slide 60: This is a Quotes slide to highlight, or state anything specific.
Slide 61: This is a Dashboard slide displaying- Revenue, Purchase Value, Units Sold.
Slide 62: This slide showcases Global Project Locations with a World map and text boxes to make it explicit.
Slide 63: This slide shows an image with text boxes titled Business Person with Post It notes.
Slide 64: This is a Timeline slide to show milestones, growth or highlighting factors.
Slide 65: This is a Puzzle image slide to show information, specification etc.
Slide 66: This is a Circular image slide to show information, specifications etc.
Slide 67: This slide shows Target image with text boxes.
Slide 68: This is a Venn diagram slide to show information etc.
Slide 69: This slide presents a Mind map with text boxes.
Slide 70: This slide showcases a Matrix with the following content- Development Clients, Dilemna Clients, Star Clients, High Value Clients.
Slide 71: This is a Lego Box slide with the following subheadings- Teach, Encourage, Increase, Build.
Slide 72: This is a Silhouettes image slide with the subheadings- INVENTORY, PAYMENT, CASH, CREDITCARD, CHECKOUT.
Slide 73: This slide showcases Hierarchy with which you can use for adding company management.
Slide 74: This is a Bulb Or Idea image slide to show information, innovative aspects etc.
Slide 75: This is a Funnel image slide showing: Calls-to-action, Reachability, User Experience, Color Schemes, Engagement, Simplicity.
Slide 76: This is a Thank You slide with Address# street number, city, state, Contact Numbers, Email Address.
Slide 77: This is a Thank You slide with Address# street number, city, state, Contact Numbers, Email Address.
Private Equity Powerpoint Presentation Slides with all 77 slides:
Our Private Equity Powerpoint Presentation Slides are adept at encouragement. Your thoughts will be energising.


FAQs for Private Equity
So PE basically works in four chunks. Firms start by raising money from big investors - pension funds and whatnot. Next comes the hunting phase where they scout companies and dig deep into everything (financials, operations, you name it). After buying, they spend 3-7 years running the show and making improvements. The whole point is the exit - IPO, selling to another company, or flipping to another PE firm. That's where the real money happens. When you're checking out PE firms, look at which part of this cycle they're actually good at. Makes a huge difference in their track record.
So PE firms are crazy thorough with their due diligence - they'll tear apart your financials, check out your management team, analyze market position, all that stuff. What they really care about is whether they can boost your company's value over like 3-7 years and hit their exit numbers. They're also thinking about operational fixes they can implement, maybe some bolt-on acquisitions too. Market conditions matter a lot obviously. Oh and if you're presenting to them? Your financial projections better be rock solid and show exactly how they'll hit their return targets. These guys don't mess around.
Look, due diligence is basically your insurance policy before dropping serious cash on a company. You're gonna spend weeks (maybe months if it's complicated) going through their books, operations, legal stuff, and figuring out if their management actually knows what they're doing. It's your shot to catch any red flags and see if their growth projections are realistic or just wishful thinking. The more thorough you are now, the better you can negotiate terms and avoid getting burned later. Honestly, most deals that go sideways could've been caught in DD. Cover financials, commercial, and legal - don't skip anything.
Think of it like buying a house with a mortgage, but for companies. PE firms borrow 3-5x their equity investment, so returns get amplified both ways. Company grows 20%? You might see 40-60% returns since you put way less cash down. But here's the thing - if stuff goes sideways, you're screwed harder too. Those monthly debt payments don't care if business slows down. I've seen deals where everything looked solid until cash flow dropped and suddenly they can't make interest payments. It's honestly pretty wild how much debt these firms pile on, but that's how they hit those crazy returns.
So PE firms have a few ways to cash out. Strategic sales are huge - selling to competitors or related companies who'll pay extra for synergies. IPOs are another route, but timing's everything there. Secondary buyouts work too (selling to another PE firm). Management buyouts happen where the existing team buys it themselves. Honestly, strategic sales usually work best since buyers often overpay for strategic value. Oh, and sometimes they'll do a combo of these depending on market conditions.
PE timing is everything, honestly. Buy low during recessions when valuations tank, but good luck getting out - IPO markets die and buyers disappear. Boom times flip this around completely. Sure, exits are easy but you're overpaying like crazy upfront. The smartest PE guys I know actually get excited about downturns because that's when the real deals happen. Quick tip though - always check when a fund is raising money versus where we are in the cycle. That timing tells you way more than their fancy pitch deck ever will.
So basically, VC is all about those early startups with crazy growth potential - you know, trying to find the next big thing. PE is different though, they go after companies that are already established and profitable. VC guys usually take smaller chunks of ownership and help with scaling, but PE firms? They love buying majority control so they can really shake things up operationally. The money's totally different too. VC deals are in the millions while PE can drop hundreds of millions or even billions (wild, right?). If you're thinking about getting into either space, just ask yourself - do you want to bet on innovation or help make existing businesses run better?
So PE firms don't just write you a check and vanish - they become actual partners in growing your business. You'll get their network for finding new deals, hiring talent, maybe even acquisitions. Most put board members on who actually know operations stuff. The decent ones (not the slash-and-burn types everyone hears about) share what's worked at their other companies and bring in consultants when you hit roadblocks. It's like having advisors who make money when you do well. Oh, and when you're looking at offers? Ask them straight up what they do besides funding.
Honestly, the big issues you'll face are pretty predictable - massive layoffs after buyouts, loading companies with so much debt they can barely breathe, and being sketchy about fees with your investors. The whole "vulture capitalist" thing is real too, even when it's unfair. You gotta ask yourself if you're actually creating value or just shuffling money around through fancy financial tricks. My take? Be straight with people about what you're doing from the start. At the end of the day, you need to live with how your deals mess with people's jobs and communities.
Dude, PE fundraising is brutal - way more relationship-heavy than anything else. You're dealing with pension funds and endowments, not random retail investors. Takes like 12-18 months of constant meetings, legal stuff, and hammering out partnership agreements. Super draining honestly. Unlike mutual funds that just keep raising money, PE firms only do it every few years when they launch a new fund. Your track record matters huge here, but honestly? The relationships you've built are everything. Start schmoozing those institutional guys years before you'll actually need their cash - they want to know you're solid before cutting those massive checks. Trust me on this one.
Honestly, the mega-funds just keep getting more ridiculous while everyone fights over the same "quality" deals. ESG isn't optional anymore - LPs won't shut up about it. Tech and healthcare are still where all the money's going, but valuations are absolutely nuts because of it. Here's the thing though - there's so much dry powder sitting around that firms are desperate to put money to work. IPO markets have been a mess, so exits are taking way longer than anyone planned. You might want to look at what sectors your target firms are actually passing on. Could be some decent opportunities hiding there.
So PE funds hit you with the classic "2 and 20" - that's 2% management fee on whatever you committed, plus 20% of profits once they clear the hurdle rate (usually 8%). Though honestly, people are pushing back on those fees more now. Management fees just cover their day-to-day costs. The carry is where they really make bank, but they can't touch it until you get your original investment back plus that preferred return. It's actually not terrible alignment since they only win if you do. Bottom line though - just focus on net returns after all their fees get pulled out. That's the only number that matters for your actual returns.
Ugh, regulatory changes are such a pain for PE shops. You're looking at hiring more compliance people and upgrading systems - costs add up fast. Tax law changes? Those'll mess with your fund economics and what investors actually take home. Plus fundraising regs can totally limit who you can even pitch to. The SEC's been on this reporting kick lately too, which is annoying but whatever. Honestly, just budget for compliance stuff upfront instead of panicking later when new rules drop. Way easier than scrambling to catch up.
Honestly, PE firms can be pretty good for sustainability stuff. They bring serious money and know-how to fix how their companies operate. Most are rolling out ESG programs, updating energy systems, cutting supply chain waste - the works. Here's the thing though: sustainable businesses just make more money long-term, so it's not pure altruism. PE firms have that 3-7 year window to actually make changes happen, unlike public companies stuck worrying about quarterly numbers. If you're eyeing PE opportunities, definitely ask about their ESG track record first.
Look at IRR, TVPI, and DPI - those are your main ones. IRR gives you annualized returns, TVPI shows the total money multiple, and DPI is actual cash they've handed back vs what's still theoretical. I'd honestly focus hard on DPI because funds love to get creative with their unrealized valuations lol. Also check these numbers across different fund years, not just their star performer from whenever. Consistency matters way more than one lucky hit. You want to see if they can actually deliver when markets get weird.
-
Best way of representation of the topic.
-
Visually stunning presentation, love the content.