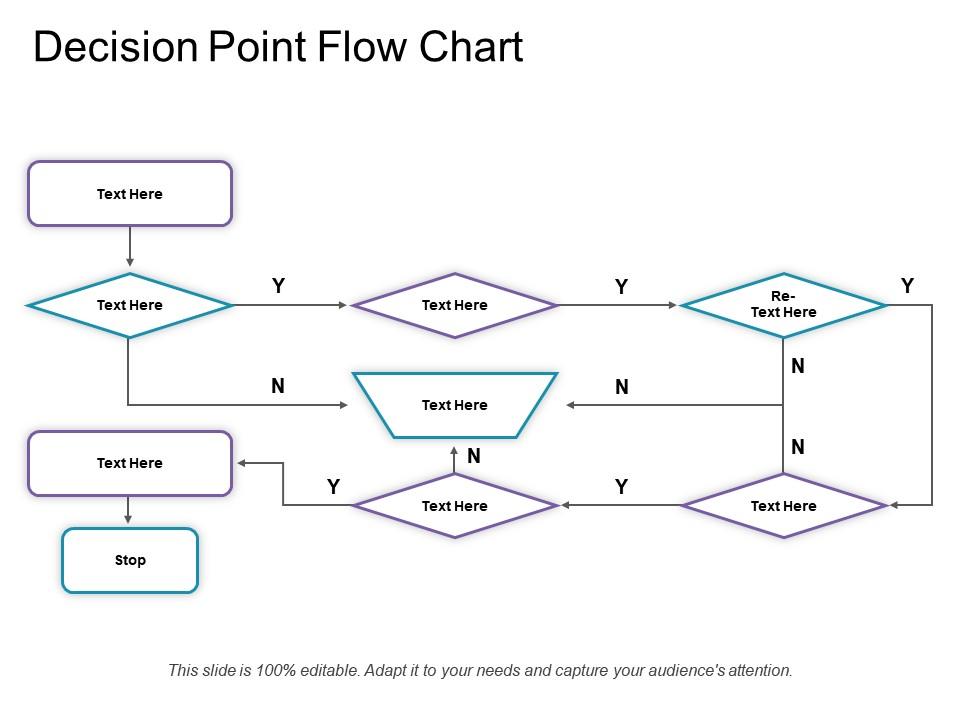
Decision point flow chart
Try Before you Buy Download Free Sample Product
Audience
Editable
of Time
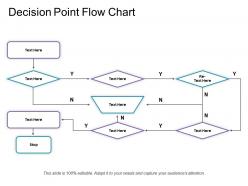
Introducing the Decision Point Flow Chart PowerPoint template. Educate the audience of your reasoning behind the decisions through this flow diagram PPT slide. Exhibit the different possibilities with each choice as you progress through the decision-making process. This information display flow diagram PPT slide will give your team a better understanding of your perspective. This decision-tree flow chart PowerPoint diagram is well-detailed to ensure all the crucial steps involved with strategic business planning can be presented comprehensively. A thorough yes-no situational study will make sure all the possibilities regarding your project can be handled professionally. An awareness of prospective issues will allow your firm to prepare accordingly and minimize the potential for loss and delays. This completely editable flow-graph representation of thought process is a great method of presenting future strategy and building your client’s trust in your project. The text boxes in this PPT slide have been shaped differently at each stage to ensure every point is adequately highlighted during your presentation.
People who downloaded this PowerPoint presentation also viewed the following :
Decision point flow chart with all 5 slides:
Ensure folks acquire a firm foundation with our Decision Point Flow Chart. It helps give them a good grooming.
FAQs for Decision
Effective decision point flow charts include clear decision nodes, defined criteria for each choice, logical pathways connecting outcomes, actionable next steps, and stakeholder responsibility assignments. These components streamline organizational processes by eliminating confusion, accelerating decision-making timelines, and ensuring consistent outcomes across departments, with many companies finding that structured decision frameworks reduce processing time and improve operational efficiency.
Decision point flow charts improve problem-solving by systematically mapping decision pathways, identifying bottlenecks, and standardizing evaluation criteria across teams. These visual frameworks streamline complex processes in manufacturing quality control, financial loan approvals, and customer service escalations, while reducing errors and decision time, ultimately delivering consistent outcomes and enhanced operational efficiency across organizations.
Decision point flow charts excel in scenarios involving complex multi-step processes with conditional branching, regulatory compliance workflows, troubleshooting procedures, and customer service protocols. These diagrams streamline decision-making by providing clear visual pathways through intricate processes, with many organizations in healthcare, finance, and manufacturing finding that structured decision trees reduce errors, accelerate training, and ensure consistent outcomes across teams.
**INPUT**: What software or tools are recommended for creating decision point flow charts? **OUTPUT**: Recommended tools include Microsoft Visio, Lucidchart, Draw.io, Creately, and specialized presentation platforms like SlideTeam. These solutions streamline chart creation by offering pre-built templates, collaborative editing features, and seamless integration capabilities, with many organizations finding that cloud-based platforms enhance team coordination and deliver faster decision-making processes.
Decision point flow charts enhance project management by clarifying critical milestones, establishing clear approval processes, and mapping dependencies between tasks and decisions. These visual tools streamline team collaboration by providing shared understanding of decision ownership, reducing bottlenecks in approval workflows, and enabling faster course corrections, with many project teams finding that structured decision mapping ultimately delivers improved accountability and accelerated project timelines.
Common mistakes include unclear decision criteria, overly complex branching paths, missing exit points, inconsistent terminology, and lack of stakeholder input during design phases. These errors create confusion in organizational processes, reduce operational efficiency, and lead to poor user adoption, with many businesses finding that simplified, well-tested flowcharts ultimately deliver better decision-making outcomes and enhanced workflow transparency.
Visual elements in decision point flow charts enhance comprehension by using colors, shapes, and icons to create intuitive pathways, reducing cognitive load and enabling faster pattern recognition. These design features help users retain information more effectively through visual memory anchors, with many organizations finding that well-designed charts improve decision-making speed by up to 40% while minimizing errors in complex processes.
Decision point labeling best practices include using clear yes/no questions, maintaining consistent verb tenses, keeping labels concise yet descriptive, positioning text for optimal readability, and ensuring each branch clearly indicates the path forward. These practices streamline comprehension by eliminating ambiguity, reducing interpretation time, and enhancing workflow clarity, with many organizations finding that standardized labeling conventions ultimately deliver faster decision-making processes and improved operational efficiency.
Decision point flow charts enhance strategic planning by visualizing critical choices, mapping potential outcomes, and identifying resource allocation pathways throughout the planning process. These tools enable organizations to systematically evaluate scenarios, anticipate risks, and optimize decision-making sequences, with many strategic teams finding that structured visualization ultimately streamlines consensus-building and accelerates implementation timelines.
Decision point flow charts play a crucial role in risk assessment by systematically identifying potential risks, evaluating their likelihood and impact, and mapping appropriate response strategies at each critical juncture. These visual tools enable organizations to streamline risk management processes, enhance decision-making transparency, and ensure consistent evaluation protocols, ultimately delivering more robust risk mitigation strategies and improved operational resilience.
Decision point flow charts remain clear by using consistent symbols, limiting text within shapes, maintaining adequate white space, and following logical top-to-bottom or left-to-right flow patterns. Through strategic color coding and standardized connector lines, organizations streamline complex decision processes while avoiding overcrowded layouts, ultimately delivering enhanced comprehension and faster decision-making across teams.
Real-world examples include emergency response protocols in hospitals, loan approval processes in banks, customer service escalation procedures in retail, and quality control workflows in manufacturing. These flowcharts streamline operations by standardizing decisions, reducing response times, and minimizing errors, with many organizations finding that visual decision frameworks ultimately enhance consistency and operational efficiency.
Stakeholder feedback can be integrated by adding review nodes at critical decision points, establishing feedback loops that allow for chart modifications, and creating designated input channels for ongoing suggestions. Many organizations implement regular review cycles where stakeholders evaluate decision outcomes and propose process improvements, ultimately enhancing chart accuracy and ensuring decisions remain aligned with evolving business needs.
Emerging trends in decision point flow charts include AI-powered dynamic routing, real-time data integration, mobile-responsive designs, collaborative multi-user editing, and predictive analytics capabilities. These innovations streamline decision-making by automating complex pathways, incorporating live metrics, and enabling cross-functional teams to build adaptive workflows, with organizations increasingly finding that intelligent flow charts deliver faster responses and enhanced operational efficiency.
Decision point flow charts adapt across industries by customizing decision criteria, regulatory requirements, stakeholder roles, and outcome measures specific to each sector's operational needs. Healthcare systems use patient triage protocols, financial services incorporate compliance checkpoints, and manufacturing focuses on quality control gates, with many organizations finding that industry-specific adaptations streamline processes while maintaining regulatory compliance and operational efficiency.
-
Nice and innovative design.
-
Illustrative design with editable content. Exceptional value for money. Highly pleased with the product.