

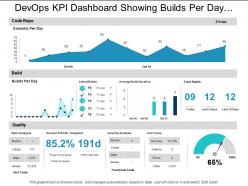
Devops kpi dashboard showing builds per day and code repo





Try Before you Buy Download Free Sample Product
 Impress Your
Audience
 100%
Editable
 Save Hours
of Time


If you're looking for a Devops kpi dashboard that shows builds per day and code repo, look no further than SlideTeam. Our Devops kpi dashboard is designed to help you track your progress and keep your project on track. With our easy-to-use interface, you can easily see how many builds you've completed in a day, week, or month. You can also see how your code repository is progressing over time. We offer a variety of Devops kpi dashboards to choose from, so you can find the one that's right for you. Contact us today to learn more about our Devops kpi dashboards and how they can help you stay on track.
People who downloaded this PowerPoint presentation also viewed the following :
Devops kpi dashboard showing builds per day and code repo with all 6 slides:
Use our Devops Kpi Dashboard Showing Builds Per Day And Code Repo to effectively help you save your valuable time. They are readymade to fit into any presentation structure.


FAQs for Devops kpi dashboard showing builds per day
Start with the DORA metrics - deployment frequency, lead time, MTTR, and change failure rate. Those are the ones that actually tell you something useful. System uptime and test coverage are good too. Pipeline success rates if your builds keep breaking (ours did for like 3 months straight). Don't add a bunch of flashy metrics that look cool but won't help you fix anything. Honestly, I've seen dashboards with 20+ charts and nobody ever looks at them. Pick maybe 2-3 extras based on whatever's currently making your life hell. Keep it clean so people will actually use it.
Honestly, the best thing about DevOps dashboards is they force everyone to look at the same numbers. No more arguing about whose fault the outage was when you can all see deployment frequency, lead times, and recovery stats right there. Short cycles become addictive once you start tracking them properly. What's cool is watching devs suddenly care about uptime and ops people getting excited about faster releases. I'd start small though - maybe 3 metrics everyone can agree on first. Otherwise you'll spend forever debating what to measure instead of actually improving anything.
Dude, you really need real-time data for your DevOps dashboard. Issues pop up fast and waiting hours to find out about them? That's a disaster waiting to happen. Think of it like this - you wouldn't drive a car only looking in the rearview mirror, right? Same logic applies here. Set up alerts for your critical metrics so when something breaks during deployment or performance tanks, you'll know instantly. I learned this the hard way last year, honestly. Quick response times can save you from those cascading failures that ruin everyone's weekend.
Honestly, just figure out what's actually breaking first. Production going down constantly? Track your failure rates and how fast you can roll back. Releases dragging on forever? Measure lead times and deployment frequency. Sure, DORA metrics are popular for a reason, but don't just copy what everyone else does. Ask your devs and ops folks what drives them crazy day-to-day. Your stakeholders probably care about different stuff anyway. Pick maybe 3-5 things that actually relate to those pain points. Test them out for a month before you commit to tracking them long-term.
Start with color coding that actually makes sense - red for critical stuff, green for good metrics, yellow for warnings. Put your most important KPIs at the top where people will see them first. Group related things together too, like deployment frequency next to lead time. I swear, half the dashboards I've seen look like someone just threw data at a wall. Make your time ranges match how people work - daily for incidents, weekly/monthly for trends. Always include targets or baselines so your team knows if they're winning or not. Test it out before you launch.
Hook into your CI/CD pipeline APIs - Jenkins, GitLab, whatever you're running. Grafana and DataDog make this pretty straightforward. Track your pass rates, execution times, and coverage percentages first. Oh, and definitely monitor flaky tests because those things are absolute time vampires. Real-time feeds are clutch so you catch failures right away instead of during deployments (been there, not fun). Honestly though, start small with like 3-4 metrics max. You'll want to add more later but don't overwhelm your team out the gate.
Honestly, most people go with Grafana, Datadog, or New Relic for visualizing metrics. If you're already using ELK stack, Kibana works too. Grafana's my pick though - it's open source and plays nice with everything like Prometheus and InfluxDB. Some teams still use Splunk or build custom dashboards in Tableau, but that's kinda old school now. GitHub and GitLab have basic built-in insights if you don't need anything fancy. Start with Grafana + Prometheus if you're building from scratch. Free, scales well, and you won't regret it later when things get complicated.
So you definitely want those DORA metrics - deployment frequency, lead time, recovery time, and failure rates. Track hours you're saving on manual deployments too, plus error rates before vs after. Deployment frequency is honestly the easiest win to show your boss since the numbers usually look crazy good. I'd start with just 2-3 metrics though, don't go overboard trying to measure everything right away. Oh and set up some kind of dashboard comparing your old baseline to current performance. Makes the impact super obvious when it's visual like that.
Honestly, data quality is gonna be your biggest headache - garbage in, garbage out, you know? Getting all your different tools to actually play nice together takes forever too. Most teams go crazy at first and try tracking like 50 things when maybe 6 actually matter. Oh, and there's always some office politics where everyone wants their favorite metric to be the "most important one." Super fun. I'd say pick 3-4 metrics that really move the needle, nail those first, then add more once you're not drowning.
Weekly reviews for quick tweaks, monthly for bigger picture stuff. Your daily monitoring runs itself obviously, but those weekly check-ins help you spot issues early. The monthly sessions are where you'd actually switch up metrics or change targets - new team members, different tools, whatever. Honestly, I've watched teams track the same useless KPIs for way too long because nobody bothered to revisit them. Don't do that. Just throw a monthly meeting on your calendar right now or you'll keep saying "we should really look at this" forever.
Track these four main ones: how often you deploy, lead time from code to production, mean time to recovery, and change failure rate. Those give you the best snapshot of CI/CD health. MTTR shows how fast you recover from issues - honestly, this one's crucial because downtime sucks. Lead time tells you if your pipeline's actually efficient. Build success rates and test coverage are good extras to watch too. Oh, and change failure rate basically shows what percentage of your deployments break things. Start there and you'll have a solid foundation.
Honestly, get a KPI dashboard set up - it's a game changer. All your compliance stuff and security metrics live in one spot, so you can catch problems early instead of scrambling later. Real-time alerts when something goes wrong with security scans or policy violations. During audit season (ugh), you'll actually have proof that you're monitoring everything properly. The automated reports are clutch too - stakeholders get what they need without you having to manually pull data every time. Way better than finding out about issues weeks after they happen. Trust me on this one.
Dude, stop talking tech jargon with them - they don't care about "deployment frequency." Say "how fast we ship features to customers" instead. Red/green dashboards work way better than spreadsheets full of numbers. Tell stories! Like "remember when our site was down for 30 minutes last month? That's what happens when our recovery metrics spike." Everything needs to connect back to money or customer happiness. Honestly, executives just want to know if this helps us beat competitors or makes customers happier. Start with "here's what this actually means for our business goals" and you're golden.
Dude, latency and response time are like your early warning system - users feel it instantly when things slow down. Track these constantly in DevOps because they show if your deployments actually help or hurt the user experience. I've watched teams get obsessed with how often they deploy while completely ignoring that their pages take forever to load (like, seriously?). Set up alerts on p95 response times. When you see spikes, check if they match recent deployments so you can rollback fast or hunt down bottlenecks before users start complaining.
Honestly, I'd jump on AI-powered insights and predictive analytics first - that stuff is everywhere now for catching problems early. Platform engineering metrics are the next big thing too, so you'll want those covered. Security KPIs aren't going anywhere either with DevSecOps being what it is. Value stream metrics are super hot right now for tracking your whole delivery pipeline. Build your dashboard flexible though - these trends change fast. Even if you just add one basic forward-looking metric now, you won't be stressed when your boss inevitably asks for it later.
-
Enough space for editing and adding your own content.
-
Amazing product with appealing content and design.