


Apresentação de slides da matriz McKinsey
You must be logged in to download this presentation.




Try Before you Buy Download Free Sample Product
 Impress Your
 Audience
 100%
100% Editable
 Save Hours
 of Time


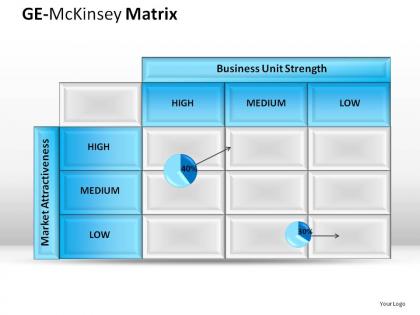
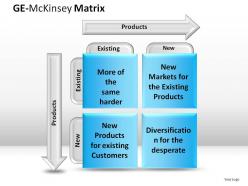
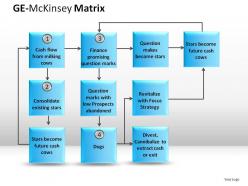
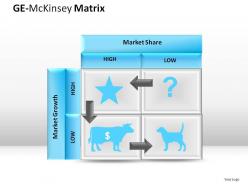
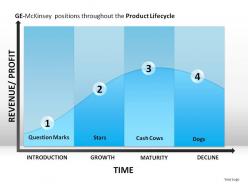
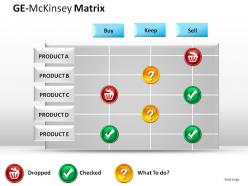
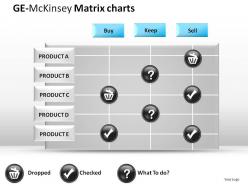
Matriz GE McKinsey: Análise de Portfólio e Triagem de Negócios Através desta matriz de portfólio de nove células, você pode esclarecer sua audiência com todas as informações essenciais relacionadas à medida quantitativa dos negócios de forma sistemática e bem informada. Nossa amostra de apresentação de slides do PowerPoint de análise multifatorial GE (General Electric) ajudará os gerentes de negócios múltiplos a avaliar suas unidades estratégicas de negócios e priorizar os investimentos feitos nelas. Você pode baixar esta apresentação em PowerPoint mesmo quando precisar de ideias de design de slides do BCG growth share matrix, pois é semelhante às informações dos slides da matriz GE/McKinsey. Obtenha o valor do seu dinheiro com nossa Apresentação de Slides do Ge McKinsey Matrix PowerPoint. Adicione valor à qualidade dos seus pensamentos.
People who downloaded this PowerPoint presentation also viewed the following :
Aqui estão as 17 slides da apresentação em PowerPoint da matriz McKinsey: 1. Matriz de Crescimento-Participação 2. Quadrante 1: Estrelas 3. Quadrante 2: Vacas Leiteiras 4. Quadrante 3: Abacaxis 5. Quadrante 4: Cães 6. Análise da Matriz de Crescimento-Participação 7. Fatores Chave de Sucesso 8. Posicionamento Estratégico 9. Estratégias para Estrelas 10. Estratégias para Vacas Leiteiras 11. Estratégias para Abacaxis 12. Estratégias para Cães 13. Alocação de Recursos 14. Análise de Portfólio 15. Vantagens da Matriz McKinsey 16. Limitações da Matriz McKinsey 17. Conclusão
Impressione-os com nossos slides de apresentação da Matriz Ge McKinsey. Eleve seus pensamentos a um crescendo.




FAQs for Ge mckinsey matrix
So the GE McKinsey Matrix has two key parts - industry attractiveness on the y-axis and your business unit strength on the x-axis. Industry attractiveness covers stuff like market growth, how profitable it is, competition levels. Business unit strength is about your market share, brand power, that kind of thing. Way more detailed than BCG's basic matrix, which honestly makes sense since McKinsey wanted something better. You plot each unit on this 3x3 grid to figure out if you should invest big, stay put, or just get out. Really solid for portfolio decisions - I've seen it work well in practice.
So BCG just looks at two things - market share and growth rate. Pretty basic stuff. GE Matrix throws way more variables into the mix though, like competitive position, industry trends, market attractiveness, all that jazz. You get those neat four boxes with BCG (cash cows and whatever), but honestly? Real business is messier than that. GE Matrix captures more of the actual complexity, which is why I'd probably lean toward it if you've got time to dig into the data. BCG's faster but kinda oversimplified imo.
Honestly, it's perfect for when you've got multiple business units or product lines that are all over the place. You know, some killing it, others struggling. Use it when you need to figure out where to throw your money versus where to cut losses. Way better than those basic growth matrices when your situation's complicated. Just make sure you actually have decent data on market attractiveness and how strong you are competitively - otherwise you're just making pretty charts. Great for those annual strategy meetings where everyone's fighting over budget. Oh, and your leadership team will love having something visual to argue over instead of just throwing around opinions.
So you're basically looking at two things here. First, how attractive is the industry itself - market size, growth, profitability, competition levels. Then figure out how strong you actually are in that space compared to everyone else. Market share, brand power, costs, distribution - you know the drill. The weighting part is honestly where most people mess up because not everything matters the same amount. Get different teams involved so you're not just hearing one perspective. Mix hard data with gut feelings too. Once you map everything out, throw your money at whatever lands in those top-left boxes first.
Biggest issues? People try cramming messy businesses into clean boxes when it's way more complicated than that. Also, the whole "industry attractiveness" thing is super subjective - like, what looks good to me might seem terrible to you. Market conditions change fast too, so your matrix could be outdated in six months. Honestly, I'd use it to get conversations started, not as gospel truth. And definitely back up your gut feelings with actual data, because those scoring biases will bite you otherwise.
Okay so the GE McKinsey Matrix is basically like a map for your business units. Plot them by how attractive the market is vs how strong you are competitively. Top-left box? Pour money in. Bottom-right gets scraps or you sell it off. Way better than staring at endless spreadsheets, trust me. Middle sections are trickier - you gotta be selective there. Honestly, it just stops you from throwing money everywhere and helps you focus on what's actually working while you figure out what to do with the losers.
When you're sizing up industries, start with the basics - market size, growth rates, how profitable companies actually are. Competitive intensity matters too, obviously. Don't forget about regulation and how hard it'd be for new players to jump in. Honestly, I think most people focus too much on current conditions when they should be looking ahead. What about tech disruption? How much power do suppliers have? Are customers super concentrated in just a few big players? Pick maybe 5-7 factors that actually matter for your situation. Score them consistently across whatever industries you're comparing.
Honestly, I'd check it every 6 months if your industry moves at all. Markets shift fast these days - your competitive position today might be totally different by next quarter. Annual reviews work for stable industries, but if you're in tech or dealing with changing consumer stuff, go quarterly. The trick is syncing it with when you actually do strategic planning, otherwise it just becomes another useless presentation that sits around. Oh and actually update the real data behind it, not just make the charts look prettier. I mean, what's the point of a pretty matrix if the numbers are stale, right?
Yeah, market growth rate definitely pushes your business units toward the attractive side of the GE McKinsey Matrix - growing markets are where you want to be, obviously. But don't just look at growth alone. The matrix weighs other stuff too like market size, how brutal the competition is, profit trends, regulations... basically the whole industry landscape. I learned this the hard way in a project last year - focused too much on growth numbers and missed some red flags. When you're plotting your units, you'll get way better positioning if you factor in all these pieces together.
Just build it right into your annual planning - plot all your business units on the matrix during strategy meetings. Honestly, seeing everything laid out like that is a real wake-up call. Heavy investment goes to your "invest/grow" units, middle performers get selective funding, and the "harvest/divest" ones? Time for some tough conversations about selling them off. Don't make it a one-and-done thing though. Update it quarterly during budget reviews so you'll catch declining businesses early. Oh, and it's great for spotting new opportunities before your competitors do - that part's probably my favorite use of it.
Hey! So the GE McKinsey Matrix is decent but has some issues. First off, it's way too static - markets change fast and this thing basically gives you a snapshot. The scoring for "industry attractiveness" and "business strength" is super subjective too, which can mess you up if there's bias in your team. Also doesn't account for how different business units work together or what resources you actually have. Honestly, I'd use it but pair it with financial analysis and maybe some scenario planning. Oh and don't rely on it alone for big decisions - learned that one the hard way!
Don't just stick to financial metrics - work in customer satisfaction scores, brand strength, regulatory risks, that kind of stuff. Create scorecards that mix hard numbers with gut calls from different teams. I've watched so many groups get tunnel vision with spreadsheets and totally miss what's actually happening in their market. Document why you picked each qualitative piece though, because someone's definitely gonna question your logic later. Start with maybe 3-4 factors that really matter for your specific industry. Makes the whole analysis way more realistic.
Honestly, Excel or Google Sheets will work for basic GE McKinsey matrices using scatter plots, but they look kinda meh. PowerPoint's way better - you get more control over design and can actually make those bubble sizes look decent for market size. Canva's solid too if you want something cleaner. Tableau and Power BI are total overkill unless you're drowning in data, though they do make everything look super professional. Oh, and draw.io is free and surprisingly good - didn't expect that when I first tried it. I'd just start with PowerPoint since you've got it already. Then maybe switch to fancier stuff if you're presenting to executives who obsess over visuals.
Market trends basically move your business units all over that matrix by messing with both sides of it. Growing or shrinking markets bump your units up and down on industry attractiveness. Tech disruption hits hard - plus regulatory stuff and competition can flip attractiveness pretty much overnight. Your competitive strength gets hit too since what worked before might be totally useless now. Netflix vs Blockbuster, anyone? That's why you've got to keep updating these assessments regularly. Static positioning when everything's changing fast? Yeah, that'll mess up your investment calls real quick.
Oh totally! I actually use GE McKinsey with other frameworks all the time. Porter's Five Forces is perfect for sizing up the industry first, then you can plot your business units with way more context. SWOT analysis helps too – gives you the "why" behind where everything lands on the matrix. BCG Matrix pairs well but honestly? Sometimes they clash and you're left scratching your head. My approach is usually starting with GE McKinsey as the foundation, then bringing in the others to double-check your thinking. Works pretty well for me.
-
Perfect template with attractive color combination.
-
Great product with effective design. Helped a lot in our corporate presentations. Easy to edit and stunning visuals.