

Hospital KPI Dashboard With Patients Feedback





Try Before you Buy Download Free Sample Product
 Impress Your
Audience
 100%
Editable
 Save Hours
of Time


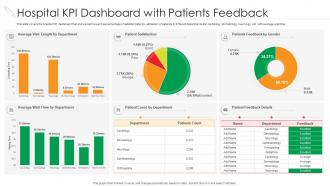
This slide covers the hospital KPI dashboard that shows metrics such as percentage of satisfied patients, admission of patients in different departments like cardiology, dermatology, neurology, etc. with average wait time.
People who downloaded this PowerPoint presentation also viewed the following :
Hospital KPI Dashboard With Patients Feedback with all 7 slides:
Use our Hospital KPI Dashboard With Patients Feedback to effectively help you save your valuable time. They are readymade to fit into any presentation structure.






FAQs for Hospital KPI Dashboard
Essential hospital efficiency KPIs include patient throughput rates, average length of stay, bed occupancy rates, emergency department wait times, and staff productivity metrics. These indicators enable healthcare administrators to streamline operations, optimize resource allocation, and enhance patient care delivery, with many hospitals finding that integrated dashboard monitoring ultimately delivers cost reductions and improved patient satisfaction.
A KPI dashboard improves healthcare decision-making by providing real-time visibility into patient outcomes, operational efficiency, and resource utilization through centralized data analytics. These systems enable hospital administrators to identify bottlenecks, optimize staffing levels, and enhance patient care delivery, with many healthcare organizations finding that streamlined data access reduces response times and ultimately delivers better clinical outcomes.
Effective hospital KPI dashboard visualization techniques include heat maps for patient flow patterns, trend lines for readmission rates, gauge charts for bed occupancy levels, and color-coded alerts for critical metrics like infection rates. These approaches enable healthcare administrators to quickly identify operational bottlenecks, track patient outcomes, and allocate resources efficiently, ultimately delivering improved patient care and streamlined hospital operations.
Patient satisfaction metrics significantly influence hospital performance assessments by affecting reimbursement rates, regulatory compliance scores, and accreditation standings. These metrics, measured through HCAHPS surveys and real-time feedback systems, directly impact Medicare payments and insurance contracts, with many healthcare systems finding that higher satisfaction scores correlate with improved financial performance and competitive positioning.
Real-time data transforms hospital KPI dashboards from static reporting tools into dynamic management platforms by enabling immediate response to patient flow changes, resource shortages, and operational bottlenecks. Through continuous data streams, hospital administrators can optimize staffing levels, reduce patient wait times, and enhance care quality, while clinical teams make faster decisions that ultimately improve patient outcomes and operational efficiency.
Critical financial KPIs for hospital profitability include operating margin, EBITDA margin, revenue per patient day, cost per case, and accounts receivable days outstanding. These metrics enable healthcare administrators to streamline cost management, enhance revenue cycle efficiency, and optimize resource allocation, with many hospital systems finding that integrated dashboard monitoring ultimately delivers improved cash flow and sustainable competitive advantage.
Hospitals can benchmark performance using KPI dashboards by comparing metrics like patient satisfaction scores, readmission rates, average length of stay, and operational efficiency against national healthcare databases and peer institutions. These dashboards enable healthcare administrators to identify performance gaps, track improvement initiatives, and implement best practices from top-performing facilities, ultimately delivering enhanced patient outcomes and competitive positioning.
Challenges in collecting accurate data for hospital KPIs include inconsistent data entry across departments, integration difficulties between legacy systems, incomplete patient records, manual reporting errors, and varying documentation standards among healthcare providers. These obstacles can compromise decision-making quality, though modern healthcare analytics platforms increasingly streamline data collection through automated workflows, standardized protocols, and real-time integration, ultimately delivering more reliable insights for operational improvements.
Predictive analytics enhances KPI dashboards by forecasting patient volumes, identifying at-risk populations, and anticipating resource bottlenecks before they occur. Through machine learning algorithms, hospitals can predict readmission rates, optimize staffing levels, and proactively manage bed capacity, while enabling data-driven decisions that improve patient outcomes and operational efficiency.
Healthcare dashboard technologies include cloud-based BI platforms like Tableau and Power BI, electronic health record integrations, real-time analytics engines, and automated reporting systems. These tools streamline patient flow monitoring, financial tracking, and clinical outcomes measurement by connecting disparate hospital systems, enabling real-time visibility, and delivering actionable insights that enhance operational efficiency and patient care quality.
Hospital KPI dashboards should be updated in real-time for critical metrics like patient flow and bed occupancy, daily for operational indicators, and weekly or monthly for strategic performance measures. This tiered approach enables healthcare administrators to respond immediately to urgent situations while tracking longer-term trends, ultimately delivering enhanced patient care and operational efficiency.
Staff productivity metrics significantly impact hospital performance by improving resource allocation, reducing operational costs, and enhancing patient care delivery timelines. Through tracking nurse-to-patient ratios, physician efficiency rates, and administrative processing speeds, hospitals can identify bottlenecks, optimize staffing schedules, and streamline workflows, ultimately delivering faster patient services and better clinical outcomes while maintaining cost-effective operations.
Clinical outcome indicators significantly influence patient care quality assessments by providing measurable data on treatment effectiveness, patient recovery rates, readmission frequencies, and mortality statistics. These metrics enable hospitals to identify care gaps, benchmark performance against industry standards, and implement targeted improvements, with many healthcare institutions finding that systematic tracking of clinical outcomes ultimately enhances patient safety and delivers more effective treatment protocols.
Hospital KPI dashboards should include patient flow metrics, staff productivity ratios, equipment utilization rates, readmission patterns, and emergency response times alongside traditional financial indicators. These comprehensive metrics enable healthcare administrators to identify bottlenecks, optimize resource allocation, and enhance patient care delivery, with many hospitals finding that integrated dashboards significantly improve operational efficiency and patient satisfaction scores.
KPI dashboards help identify demographic and care trends by aggregating patient data across age groups, conditions, geographical regions, and service utilization patterns in real-time visualizations. Through automated analytics, hospitals can track shifting population health needs, seasonal disease patterns, and resource demands, enabling proactive staffing adjustments and care protocol modifications that ultimately enhance patient outcomes while optimizing operational efficiency.
-
Innovative and Colorful designs.
-
Thanks for all your great templates they have saved me lots of time and accelerate my presentations. Great product, keep them up!