


How to optimize sales performance powerpoint presentation slides




Try Before you Buy Download Free Sample Product
 Impress Your
 Audience
 100%
100% Editable
 Save Hours
 of Time


Gain your customer’s trust and build a connection advantage virtually by using this How To Optimize Sales Performance Powerpoint Presentation Slides. This sales training PPT template will investigate various sales initiatives which will be critical in generating leads, customers, and sales. This sales productivity PowerPoint layout helps you to follow steps starting from analyzing the firm’s present scenario, the sales department’s performance, evaluating sales teams performance, and embracing technology to develop a sales management system. With this action plan PPT design, initiate workforce management by developing a workforce plan, resourcing capabilities, training workplace and implementing a team incentive plan-reward system. In addition to this, you can also handle your customers, analyze marketing campaigns, form marketing strategies and improve customers experience with this ditch and pitch PowerPoint presentation. The major purpose of this sales tracking PPT slideshow is to provide information about the sales plan and techniques to drive revenue, calculate the cost associated with the sales department, the impact of the sales effectiveness initiatives, and projected sales performance.
People who downloaded this PowerPoint presentation also viewed the following :
Content of this Powerpoint Presentation
Slide 1: This title slide introduces How to Optimize Sales Performance. Add the name of your company here.
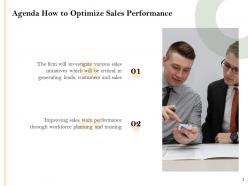
Slide 2: This is the Agenda slide for How to Optimize Sales Performance. It includes - The firm will investigate various sales initiatives which will be critical in generating leads, customers, and sales, Improving sales team performance through workforce planning and training, etc.
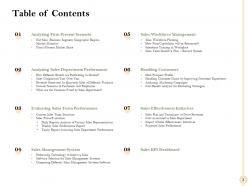
Slide 3: This slide contains the Table of Contents. It contains - Analyzing Firm Present Scenario, Analyzing Sales Department Performance, Evaluating Sales Team Performance, etc.
Slide 4: This is a table of content slide showing Analyzing Firm Present Scenario. It includes - Net Sales and the Firm’s Present Market Share.
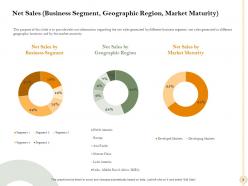
Slide 5: This slide presents the Net Sales. It provides relevant information regarding the net sales generated by different business segments, net sales generated in different geographic locations, and market maturity.
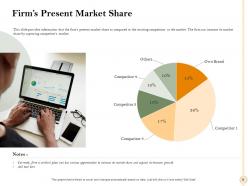
Slide 6: This slide presents the Firm’s Present Market Share. It provides information that the firm’s present market shares as compared to the existing competitors in the market.
Slide 7: This is a table of content slide showing Analyzing Sales Department Performance. It includes - How Different Brands are Performing in Market? Sales Comparison Year Over Year, Revenue Generated by Quarterly Sales of Different Products, etc.
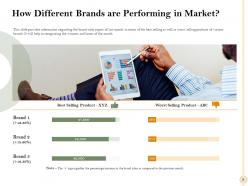
Slide 8: This slide presents How Different Brands are Performing in the Market? It provides information regarding the brand sales report of last month in terms of the best-selling as well as worst-selling products of various brands.
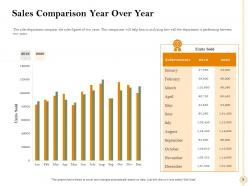
Slide 9: This slide presents the Sales Comparison Year Over Year. This comparison will help the firm in analyzing how well the department is performing between two years.
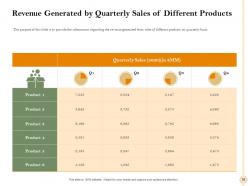
Slide 10: This slide presents the Revenue Generated by Quarterly Sales of Different Products. It provides information regarding the revenue generated from sales of different products on a quarterly basis.
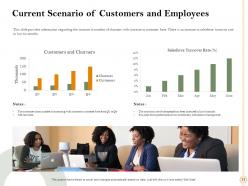
Slide 11: This slide presents the Current Scenario of Customers and Employees. It provides information regarding the increase in the number of churners with an increase in customer base.
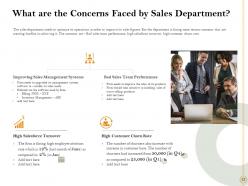
Slide 12: This slide presents What are the Concerns Faced by Sales Department? The concerns are – Bad sales team performance, high salesforce turnover, high customer churn rate.
Slide 13: This is a table of content slide showing Evaluating Sales Team Performance. It includes - Current Sales Team Structure, SalesForce Evaluation, Daily Reports Analysis of Various Sales Representatives, etc.
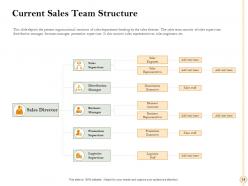
Slide 14: This slide presents the Current Sales Team Structure. It depicts the present organizational structure of the sales department heading by the sales director.
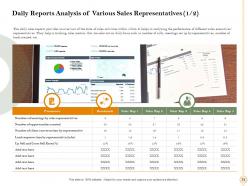
Slide 15: This slide presents the Daily Reports Analysis of Various Sales Representatives (1/2). It helps in analyzing the performance of different sales executives/ representatives.
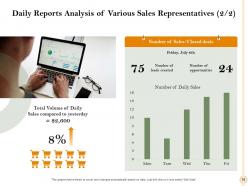
Slide 16: This slide presents the Daily Reports Analysis of Various Sales Representatives (2/2).
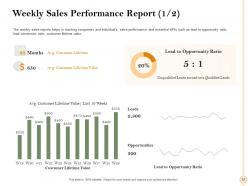
Slide 17: This slide presents the Weekly Sales Performance Report (1/2). The weekly sales reports help in tracking the company's and individuals' sales performance and essential KPIs.
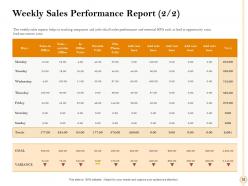
Slide 18: This slide presents the Weekly Sales Performance Report (2/2).
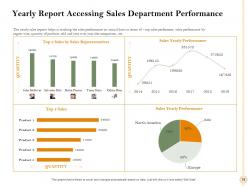
Slide 19: This slide presents the Yearly Report Accessing Sales Department Performance. The yearly sales reports help in tracking the sales performance on annual basis.
Slide 20: This is a table of content slide showing the Various Sales Initiatives Taken by Firms in the Future.
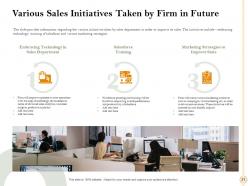
Slide 21: This slide presents the Various Sales Initiatives Taken by Firms in the Future. The initiatives include – embracing technology, training of salesforce, and various marketing strategies.
Slide 22: This is a table of content slide showing the Sales Management System. It includes - Embracing Technology to Improve Sales, Software Selection for Sales Management Systems, and Comparing Different Sales Management Systems Software.
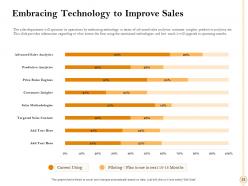
Slide 23: This slide presents the Embracing Technology to Improve Sales. It provides information regarding to what extent the firm using the mentioned technologies and how much it will upgrade in upcoming months.
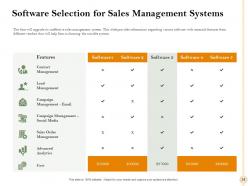
Slide 24: This slide presents the Software Selection for Sales Management Systems. It provides information regarding various software with essential features from different vendors that will help the firm in choosing a suitable system.
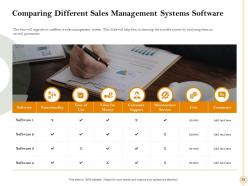
Slide 25: This slide presents the Comparing Different Sales Management Systems Software. It will help firms in choosing a suitable system by analyzing them on several parameters.
Slide 26: This is a table of content slide showing the Sales Workforce Management. It includes - Sales Workforce Planning, How Firm Capabilities will be Resourced? etc.
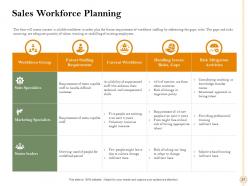
Slide 27: This slide presents the Sales Workforce Planning. The firm will assess the currently available workforce in order to plan the future requirement of workforce staffing by addressing the gaps, risks.
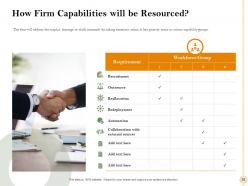
Slide 28: This slide presents How Firm Capabilities will be Resourced? The firm will address the surplus, shortage, or skills mismatch by taking necessary action at key priority areas in various capability groups.
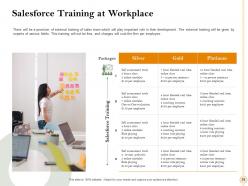
Slide 29: This slide presents the Salesforce Training at Workplace. There will be a provision of external training of sales team which will play important role in their development.
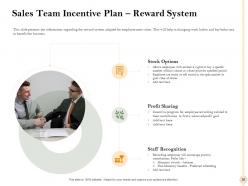
Slide 30: This slide presents the Sales Team Incentive Plan – Reward System. It presents the information regarding the reward system adapted for employee motivation.
Slide 31: This is a table of content slide showing Handling Customers. It includes - Ideal Prospect Profile, Handling Customer Churn by Improving Customer Experience, etc.
Slide 32: This slide presents the Ideal Prospect Profile. It provides a glimpse about customer profile that will help the firm in better understanding of customer which includes customer demographics, background, etc
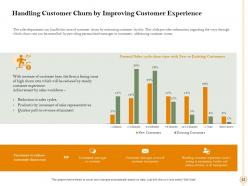
Slide 33: This slide presents the Handling Customer Churn by Improving Customer Experience. It provides information regarding the ways through which churn rate can be controlled by providing personalized messages to customers, addressing customer issues.
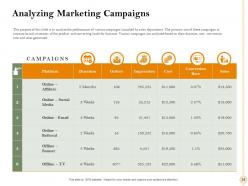
Slide 34: This slide presents the Analyzing Marketing Campaigns. It analyzes the performance of various campaigns launched by sales department.
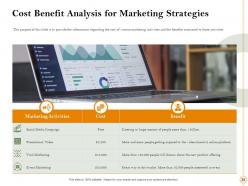
Slide 35: This slide presents the Cost-Benefit Analysis for Marketing Strategies. It provides information regarding the cost of various marketing activities and the benefits associated with these activities.
Slide 36: This is a table of content slide showing the Sales Effectiveness Initiatives. It includes - Sales Plan and Techniques to Drive Revenues, Cost Associated to Sales Department, etc.
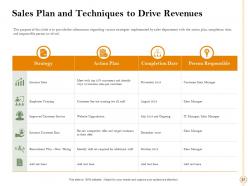
Slide 37: This slide presents the Sales Plan and Techniques to Drive Revenues. It provides information regarding various strategies implemented by the sales department with the action plan, completion date, and responsible person involved.
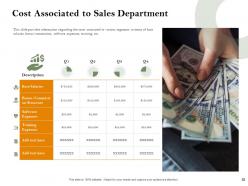
Slide 38: This slide presents the Cost Associated to Sales Department. It provides information regarding the costs associated with various segments in terms of base salaries, bonus/commission, software expenses, training, etc.
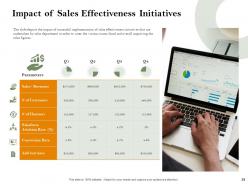
Slide 39: This slide presents the Impact of Sales Effectiveness Initiatives. It depicts the impact of successful implementation of sales effectiveness initiatives that are undertaken by the sales department in order to cater to the various issues faced and overall improving the sales figures.
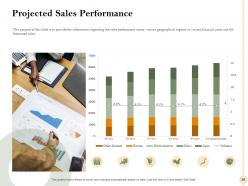
Slide 40: This slide presents the Projected Sales Performance. It provides information regarding the sales performance across various geographical regions in various financial years and the forecasted sales.
Slide 41: This is a table of content slide showing the Sales KPI Dashboard.
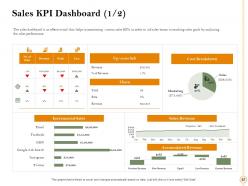
Slide 42: This slide presents the Sales KPI Dashboard (1/2). The sales dashboard is an effective tool that helps in monitoring various sales KPIs in order to aid sales teams in reaching sales goals by analyzing the sales performance.
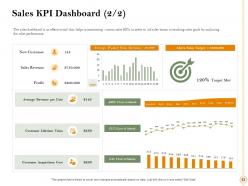
Slide 43: This slide presents the Sales KPI Dashboard (2/2).
Slide 44: This is the How to Optimize Sales Performance - Icons Slide.
Slide 45: This slide introduces the Additional Slides.
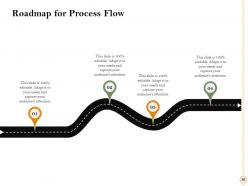
Slide 46: This slide is a Roadmap for Process Flow template to showcase the stages of a project, for example.
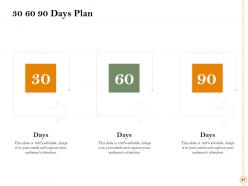
Slide 47: This is a slide with a 30 60 90 Days Plan to set goals for these important intervals.
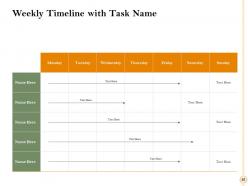
Slide 48: This is the Weekly Timeline with Task Name slide.
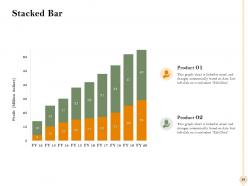
Slide 49: This slide shows a Stacked Bar that compares 2 products’ profits over a timeline of financial years.
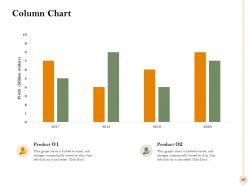
Slide 50: This slide shows a Column Chart that compares 2 products’ sales over a timeline of financial years.
Slide 51: This slide provides the Mission for the entire company. This includes the vision, the mission, and the goal.
Slide 52: This slide presents Our Awesome Team.
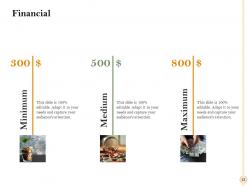
Slide 53: This slide presents the Financial with a data’s numbers at minimum, medium, and maximum percentage.
Slide 54: This slide contains the information about the company aka the ‘About Us’ section. This includes Creative, Talented, and Professional.
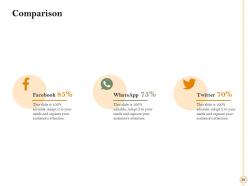
Slide 55: This slide presents the Comparison between the percentage of users of Facebook, WhatsApp, and Twitter.
Slide 56: This slide contains Post It Notes that can be used to express any brief thoughts or ideas.
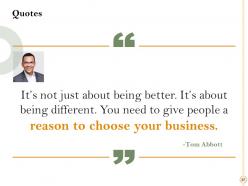
Slide 57: This is the Quotes slide.
Slide 58: This is a Thank You slide where details such as the address, contact number, email address are added.
How to optimize sales performance powerpoint presentation slides with all 58 slides:
Use our How To Optimize Sales Performance Powerpoint Presentation Slides to effectively help you save your valuable time. They are readymade to fit into any presentation structure.



FAQs for How to optimize sales performance
Honestly, focus on conversion rates, average deal size, and how long your sales cycles are taking. Those three will tell you way more than just staring at revenue numbers all day. Pipeline velocity is huge too - it shows you exactly where deals are getting stuck. Activity stuff like calls and meetings? Yeah, track those since they predict what's coming. But here's the thing - don't go crazy trying to measure everything. Pick maybe 3-4 metrics that actually relate to whatever's broken in your process right now. I've seen teams drown in dashboards when they could've just fixed their lead-to-close ratio and called it a day.
Honestly, dig into your CRM data first - it'll show you which lead sources actually convert and when deals usually hit roadblocks. I get that you're already buried, but this stuff is worth it. Pick one metric this week, maybe conversion rates by channel or how fast deals close. Your sales cycles probably have patterns you're missing. Track what's driving real conversions vs what you assume is working. Customer lifetime value is huge too, though that one's more of a long game. The insights always surprise me - like finding out your "best" lead source actually sucks at closing.
Training is seriously everything for sales teams. Your reps need to know the product cold and handle objections without breaking a sweat. Confident salespeople just sell better - it's that simple. Market changes happen so fast these days, so ongoing training keeps everyone current on new features and competitor moves. Here's what works: figure out where your team's actually struggling first. Then build specific training around those weak spots instead of doing some boring generic workshop that nobody remembers. Skip the one-size-fits-all approach - it's usually a waste of time.
Dude, personalized sales stuff actually works - we're talking 20-30% better engagement and conversions up 15%. You're basically having real conversations instead of blasting generic garbage at people. Customers can smell a form letter from a mile away, but when you nail their specific problems? They actually respond. Here's what I'd do: segment your prospects by industry or company size first. Then write different messages for each group. Sounds obvious but most people skip this step completely. Even tiny changes to your outreach make a massive difference. It's wild how much better results get when you just... pay attention to what each person actually needs.
Honestly, the best thing I learned was making reviews super data-focused. Pull their real numbers - conversion rates, deal sizes, all that stuff - and compare to goals. But don't just lecture them about it, you know? Ask what's actually blocking them and what help they need. I do monthly check-ins so there's never any surprises (learned that one the hard way). Focus on the behaviors that actually move the needle, not just quota hitting. Oh, and always end with 2-3 action items you both agree on with actual deadlines. Otherwise you'll just have the same conversation next month.
Look, competitive analysis and market research are basically your cheat codes for not failing. You get to see what your competitors are doing wrong (and right, unfortunately) - their pricing, messaging, all that stuff. Market research shows you what customers actually want instead of what you're assuming they want. We're all terrible at guessing that part, honestly. Dig into your top 3 competitors this week. See how they pitch and where they're screwing up. Those gaps? That's where you win. Also helps you price smarter and hit pain points that actually matter to people.
CRM software seriously changed everything for us. All your customer info lives in one place, so you can finally see what's actually working. I used to lose prospects constantly - total nightmare. The pipeline visibility is huge though, you'll spot bottlenecks you didn't even know existed. Plus it handles the boring stuff automatically, like follow-ups and scoring leads. Here's the thing - the analytics part is where it gets really good. You stop guessing and start making decisions based on real data instead of just wing-it vibes. Track your conversion rates first, that's honestly the best starting point.
Honestly, sales forecasting is like having a roadmap for your business decisions. You'll know how much inventory to order, when to hire people, how much to spend on ads - all that stuff. Board meetings become way less painful too because you actually have data to back up your plans (trust me on this one). The trick is pulling info from different places and updating your forecasts regularly. I'd start by comparing what you predicted last quarter to what actually happened. That gap will show you exactly where you're missing the mark and help you get better at predicting revenue.
Celebrate the wins first - big or small, people need to feel seen. Money matters too, so fix your commission structure if it sucks. One-on-ones are clutch for figuring out what's actually blocking them. Friendly competition works great - leaderboards, team challenges, whatever gets them fired up. Show clear paths for advancement beyond just monthly quotas. Give them decent training and tools, then honestly? Step back and let them work. Oh, and actually solve the problems they bring up in meetings instead of just nodding along. That's probably the biggest thing.
Dude, you absolutely need sales and marketing talking to each other. I've watched companies where they're basically in different universes - it's so frustrating. Your conversion rates go up when everyone's on the same page about messaging and who you're actually targeting. Marketing gets way better at sending over leads that don't suck when they know what sales is dealing with day-to-day. And sales can tell them what's actually working in conversations. Honestly, just start with weekly check-ins between the team leads. Super simple but it makes a massive difference.
So your sales team is basically sitting on a goldmine of product insights. Every customer conversation reveals what people actually want, what's broken, or what gets them hyped. Way better than expensive market research, honestly. I've watched companies totally reshape features just from patterns that kept showing up in sales calls - like, the same complaint five times in a week? That's your roadmap right there. Customers are practically handing you the blueprint for improvements through normal conversations. You just need to catch it. Try setting up quick weekly sessions where sales dumps all the good customer intel to your product folks.
Honestly, start by being way pickier about leads upfront - only chase people who actually have money and can make decisions. Time-sensitive deals work great for creating urgency, or just really hammer home why their problem can't wait. Get your quotes out faster too. Seriously, waiting weeks for pricing is so outdated. I'd set up templates for the usual pushback you get and have your numbers ready immediately. Track where your best leads come from - some sources are just tire-kickers. Move lightning fast on the good ones, ditch the rest without guilt.
Look, cultural stuff will absolutely tank your sales if you ignore it. What crushes it in New York? Total disaster in Tokyo. Some cultures want you to get straight to business. Others - you'll spend months just building relationships before anyone talks money. I learned this the hard way honestly. Hierarchy matters way more in certain places than you'd expect. Even your presentation colors can mess things up. Research their business customs first, then find local reps who actually get the cultural thing. Don't wing it.
Track the obvious stuff first - conversion rates, deal sizes, how long sales cycles take. Revenue per rep matters most (leadership only cares about dollars, let's be real). But also watch activity metrics like calls and emails, plus win rates at different stages. Don't measure right after training though - wait 30, 60, 90 days to see real changes. I'd set up a basic dashboard with maybe 3-4 key numbers you can actually show when they ask for ROI. Oh, and throw in some confidence surveys too. Reps feeling better about their skills usually translates to better performance down the line.
Stories beat feature lists every time - people actually remember them. When you tell a prospect about another customer who had the same problem, they can see themselves there. We're just wired that way, you know? Here's what works: paint the picture of a similar customer's mess, walk through how you fixed it, then share the actual results. Don't make it too polished though - keep some real details so it doesn't sound fake. Oh, and collect like 3-4 solid customer stories now. Trust me, you'll want different ones for different situations.
-
Thanks for all your great templates they have saved me lots of time and accelerate my presentations. Great product, keep them up!
-
Design layout is very impressive.
-
Use of different colors is good. It's simple and attractive.
-
Informative design.
-
Unique research projects to present in meeting.