


Human Resource Budget Vs Actual KPI Dashboard Snapshot




Try Before you Buy Download Free Sample Product
 Impress Your
 Audience
 100%
100% Editable
 Save Hours
 of Time


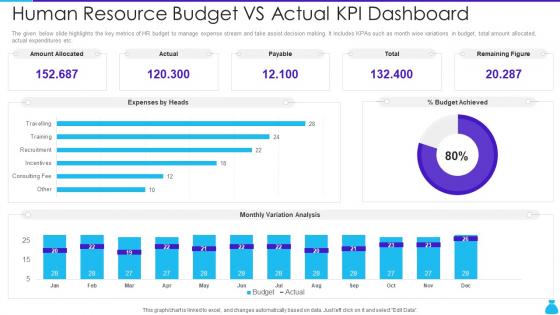
The given below slide highlights the key metrics of HR budget to manage expense stream and take assist decision making. It includes KPAs such as month wise variations in budget, total amount allocated, actual expenditures etc.
People who downloaded this PowerPoint presentation also viewed the following :
Human Resource Budget Vs Actual KPI Dashboard Snapshot with all 7 slides:
Use our Human Resource Budget Vs Actual KPI Dashboard to effectively help you save your valuable time. They are readymade to fit into any presentation structure.





FAQs for Human Resource Budget Vs Actual
Key components include workforce cost analysis, recruitment metrics, training expenditures, employee turnover rates, and productivity measurements. These elements enable HR leaders to track budget allocation efficiency, monitor recruitment ROI, and assess training investments, with many organizations finding that comprehensive dashboards streamline resource planning while delivering enhanced workforce management and strategic cost optimization.
An HR Budget KPI Dashboard informs strategic decision-making by providing real-time visibility into workforce costs, headcount trends, compensation benchmarks, and ROI metrics across departments and locations. Through predictive analytics and variance reporting, organizations can optimize resource allocation, identify cost-saving opportunities, and align talent investments with business objectives, ultimately enabling data-driven workforce planning and competitive advantage.
HR Budget KPI dashboards should prioritize cost-per-hire, employee turnover rates, training ROI, headcount variance against budget, and compensation ratio metrics. These indicators enable organizations to streamline resource allocation by identifying recruitment inefficiencies, predicting retention costs, and optimizing talent investments, with many companies finding that strategic HR budget tracking ultimately delivers enhanced workforce planning and significant operational cost reductions.
Employee turnover rates directly impact HR budgets through recruitment costs, training expenses, productivity losses, and overtime payments for remaining staff. A dashboard can visualize this through turnover cost calculators, department-specific turnover trends, recruitment spending tracking, and training investment metrics, with many organizations finding that real-time visibility enables proactive retention strategies, ultimately reducing replacement costs and enhancing workforce stability.
A Human Resource Budget KPI Dashboard facilitates workforce planning by providing real-time visibility into headcount costs, turnover rates, compensation trends, recruitment expenses, and training investments. These integrated metrics enable HR leaders to optimize staffing levels, predict future hiring needs, and allocate resources strategically across departments, ultimately delivering more efficient workforce management and improved organizational performance.
Organizations ensure HR Budget Dashboard accuracy through automated data integration, regular validation protocols, standardized reporting procedures, and real-time synchronization with HRIS systems. Through centralized data governance and cross-functional verification processes, companies like manufacturing firms and financial services institutions minimize errors while enhancing transparency, ultimately delivering reliable insights for strategic workforce planning and budget optimization decisions.
Technology serves as the foundation for HR Budget KPI Dashboards by enabling real-time data integration, automated reporting, advanced analytics, and predictive modeling capabilities. Through cloud-based platforms and AI-driven insights, organizations streamline budget tracking, enhance forecasting accuracy, and deliver comprehensive workforce cost analysis, with many companies finding that automated dashboards reduce reporting time while improving strategic decision-making.
Visualization techniques enhance HR Budget KPI Dashboard effectiveness by transforming complex financial data into intuitive charts, graphs, and heat maps that enable quick pattern recognition and trend analysis. Through interactive dashboards, color-coded metrics, and drill-down capabilities, HR leaders can identify budget variances, track spending patterns, and make data-driven decisions faster, ultimately delivering improved resource allocation and strategic workforce planning.
Common pitfalls include overloading dashboards with excessive metrics, using unclear visualizations, failing to align KPIs with strategic objectives, neglecting real-time data integration, and ignoring user experience design. These challenges can undermine dashboard effectiveness by creating confusion, reducing adoption rates, and limiting actionable insights, with many HR departments finding that streamlined, strategically-focused dashboards deliver better decision-making outcomes and enhanced budget management capabilities.
HR Budget KPI Dashboards should be updated monthly for comprehensive budget tracking, with critical metrics like headcount costs and recruitment spending refreshed weekly or bi-weekly during peak hiring periods. Many organizations find that real-time integration with payroll and HRIS systems enables continuous monitoring while monthly executive reporting provides strategic oversight, ultimately delivering better resource allocation decisions and enhanced budget accuracy across departments.
Benchmarking against industry standards enhances HR Budget Dashboard insights by providing external context for compensation ratios, training investments, turnover costs, and resource allocation patterns. This comparative analysis enables organizations to identify competitive gaps, optimize spending efficiency, and make data-driven decisions, with many companies finding that industry benchmarks reveal opportunities for strategic cost reallocation and improved talent retention.
Integrating qualitative data alongside quantitative metrics on HR dashboards delivers comprehensive workforce insights by combining measurable outcomes with contextual understanding, employee sentiment analysis, and behavioral patterns. This strategic combination enables organizations to identify root causes behind turnover trends, enhance employee engagement strategies, and make informed decisions that balance operational efficiency with workforce satisfaction, ultimately delivering improved retention and competitive advantage.
Incorporating HR stakeholder feedback involves conducting structured interviews with department heads, managers, and HR teams to identify critical metrics, preferred visualization formats, and reporting frequencies. Through iterative design sessions and prototype testing, organizations can ensure the dashboard addresses specific pain points like talent retention tracking, recruitment efficiency monitoring, and budget variance analysis, ultimately delivering a user-centric tool that enhances decision-making across all HR functions.
**INPUT**: What are the best practices for presenting HR budget data to non-HR stakeholders? **OUTPUT**: Best practices include using visual dashboards with clear metrics, translating HR costs into business impact terms, focusing on ROI and productivity ratios, and providing executive summaries with key insights. These approaches streamline communication by presenting data through revenue-per-employee metrics, cost-benefit analyses, and performance correlations, with many organizations finding that simplified visualizations and business-focused narratives enhance stakeholder engagement and strategic decision-making.
A well-designed HR Budget KPI Dashboard helps identify training and development needs by tracking performance gaps, skill deficiencies, productivity metrics, and employee engagement scores across departments. Through real-time analytics, organizations can pinpoint underperforming teams, monitor training ROI, and allocate development budgets strategically, with many companies finding that data-driven training decisions enhance employee retention and operational efficiency.
-
Stunning collection! With a wide variety of options available, I was able to find a perfect slide for my presentation. Thank you, SlideTeam!
-
Loved the fact that SlideTeam provides clean, high-definition, and professional PowerPoint products.