


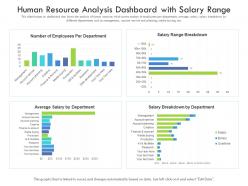
Human resource analysis dashboard with salary range


Try Before you Buy Download Free Sample Product
 Impress Your
 Audience
Editable
of Time


Our Human Resource Analysis Dashboard With Salary Range are topically designed to provide an attractive backdrop to any subject. Use them to look like a presentation pro.
People who downloaded this PowerPoint presentation also viewed the following :
Human resource analysis dashboard with salary range with all 2 slides:
Use our Human Resource Analysis Dashboard With Salary Range to effectively help you save your valuable time. They are readymade to fit into any presentation structure.
FAQs for Human resource analysis dashboard
Start with the obvious stuff - turnover rates, how long it takes to hire someone, and engagement scores. Those three alone will tell you a ton. Then add cost-per-hire and training ROI because nobody wants to get roasted in budget meetings about crazy recruiting expenses. Performance ratings matter too, plus absenteeism and internal mobility. Honestly, pick maybe 5-7 things max that actually connect to what your company cares about. Don't go nuts tracking every possible metric - you'll just overwhelm yourself. Stick with your chosen ones for like 6 months before getting fancy with it.
Okay so predictive analytics is pretty cool for hiring - basically you analyze your top performers to figure out what makes them tick, then use that to screen new candidates. The flight risk detection thing? Honestly blew my mind when I first saw it work. You can also track which job boards or sources actually bring in good people (spoiler: it's usually not the expensive ones). I'd start simple though - just track time-to-hire and see which sources work best. Then build up from there once you get the hang of it.
Honestly, engagement data is like having a heads up on who's about to quit. Look at your survey results next to last year's turnover - bet you'll see some patterns. High performers with low engagement? Those are the ones you really don't want walking out the door. It shows you which teams are struggling before things get messy too. I'd start by checking if certain departments keep losing people - usually means they need better managers or more support. Pretty wild how much you can predict just from asking people if they actually like their jobs.
Honestly, HR analytics is a game-changer for D&I stuff. Instead of just assuming your processes are fair, you'll actually see what's happening with the numbers. Track who you're hiring, where pay gaps exist, and why certain people aren't getting promoted. My old company thought they were doing great until the data showed their interview process was totally biased - whoops. You can finally tell if those expensive D&I programs are working or just for show. Start with a workforce audit and compensation review. Way better than flying blind.
Honestly, start with a decent HRIS like Workday or BambooHR - that's your foundation. Then grab Tableau or Power BI for the pretty charts. Don't sleep on Excel though, it's still clutch for quick stuff. If you get into predictive modeling later, you'll probably need R or Python (ugh, I know). Culture Amp's solid for engagement surveys, and your ATS like Greenhouse already has recruiting data just sitting there. The biggest headache? Making sure everything connects - data silos will drive you nuts. My advice: start basic with what you've got, then add tools as you actually need them.
Break down your turnover by department, role level, and tenure - you'll spot patterns quickly. Exit interviews plus performance data show if you're losing your best people or dead weight. Honestly, voluntary vs involuntary departures tell completely different stories about what's actually broken. Watch engagement scores and promotion rates too since they predict who's about to bolt. I'd track seasonality patterns - some teams always hemorrhage people in January or after bonus season. Build models to forecast headcount needs quarterly so you're recruiting ahead of time instead of panicking when someone quits.
So sentiment analysis is basically like having a constant read on how your team's actually feeling - which is huge for changing culture. You can dig into feedback patterns and catch toxic stuff early, plus see what's already working well. Honestly, most companies just collect this data and then do nothing with it, which is such a waste. The real magic happens when you actually act on it. Figure out your biggest pain points first (usually comes down to bad managers or people being overwhelmed), then build specific plans around fixing those areas.
Honestly, the worst mistake is building pretty dashboards when you don't even know what you're trying to figure out. Companies love collecting data just because they can - total waste. Don't jump into fancy predictive stuff if you can't even do basic reporting right. Your managers will hate you if they think you're trying to replace their gut instincts (which, let's be real, sometimes you are). Oh, and messy data makes everything pointless no matter how smart your models are. Pick one actual business problem first. Clean your data. Get people on board early or you're screwed.
Look, HR analytics basically shows you where people are actually struggling instead of just throwing random training at everyone. Pull your performance review data first - the patterns might shock you. You can spot who's ready to move up and which programs are worth the money. Those expensive leadership retreats? Half are probably just overpriced team bonding with fancy lunches. The best part is creating personalized development plans using real performance data and what people actually want to do with their careers. Way better than guessing what'll help someone grow. Start digging into your existing data and see what jumps out.
Honestly, just be upfront with your team about what data you're collecting and why. Don't collect random stuff you don't actually need - that's where companies get themselves in trouble. The tricky part is watching for bias in your analysis because this stuff affects real people's careers, you know? I'd also make sure everyone's actually cool with being analyzed this way. Quick test: flip it around and ask yourself if you'd be comfortable having your own work data dissected the same way. If that makes you squirm a bit, probably rethink your approach.
Honestly, turning those awful HR spreadsheets into visuals is a game changer. Dashboards and heat maps make turnover patterns actually pop - way better than staring at endless rows of numbers. When I showed my boss diversity metrics in a chart instead of a table, he finally understood what I'd been trying to explain for weeks. People just process visual stuff faster, you know? Even simple Excel charts work if you're just starting out. Though Tableau's pretty sweet if your company has the budget. Trust me, once executives can literally see the trends, they'll stop asking you to "circle back" on everything and actually make decisions.
Honestly, HR analytics is a game changer for retention stuff. Instead of just wondering why people quit, you actually get real data on what's happening. The crazy part? You can spot who's about to leave before they even know it themselves. Track your exit interviews systematically - that's where the gold is. Once you see the patterns, you'll know if it's bad managers, too much work, or lack of growth that's driving people away. Then you can fix the actual problems instead of just adding more free snacks to the break room (though I do love free snacks).
Benchmarking is honestly your best bet for getting a reality check on your HR metrics. Compare stuff like turnover rates, time-to-hire, and engagement scores to industry standards or similar companies. I learned this the hard way when I thought our numbers were solid, but turns out our "decent" turnover was actually pretty awful for our sector! You can also benchmark internally - like comparing this year to last year or different departments against each other. Just make sure you're picking the right comparison groups. Focus on metrics that actually tie back to what your company cares about, not just vanity numbers.
So basically, HR analytics is like having a heads-up system for compliance stuff. Data helps you catch pay gaps and diversity issues before they blow up into lawsuits. You can track overtime violations, spot FLSA problems, all that fun regulatory stuff. Honestly, it's way better than scrambling to fix things after someone complains. Set up some dashboards that automatically ping you when something looks off - saves you from those nightmare scenarios where you're getting hit with penalties. Way less stressful than playing catch-up later.
Look, you don't need fancy expensive software for this stuff. Start with what you've got - your HRIS or honestly, even Excel works fine. Track the basics: turnover, how long hiring takes, maybe some employee satisfaction surveys. Most small companies already have tons of useful data just sitting there unused (kinda wild when you think about it). Google Analytics is free for your careers page. Pick like 2-3 metrics that actually affect your money and go from there. Check in monthly, see what the numbers tell you. Way better than just guessing all the time.
-
Great designs, really helpful.
-
Excellent design and quick turnaround.
-
Content of slide is easy to understand and edit.
-
Helpful product design for delivering presentation.
-
Topic best represented with attractive design.
-
Use of different colors is good. It's simple and attractive.