


Industrial waste management tracking dashboard industrial waste management




Try Before you Buy Download Free Sample Product
 Impress Your
 Audience
 100%
100% Editable
 Save Hours
 of Time


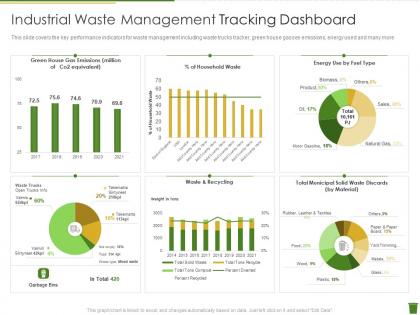
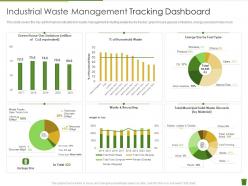
This slide covers the key performance indicators for waste management including waste trucks tracker, green house gasses emissions, energy used and many more.
People who downloaded this PowerPoint presentation also viewed the following :
Industrial waste management tracking dashboard industrial waste management with all 2 slides:
Use our Industrial Waste Management Tracking Dashboard Industrial Waste Management to effectively help you save your valuable time. They are readymade to fit into any presentation structure.
FAQs for Industrial waste management tracking dashboard
Honestly, start with tracking waste volume in real-time and categorizing disposal methods - that's your foundation. Cost monitoring too, obviously. You definitely don't want to get hit with regulatory fines, so compliance tracking is huge. Your dashboard should show which departments create the most waste (always interesting to see who the worst offenders are). Trend analysis helps spot patterns over time. Environmental impact metrics are pretty much required now for reporting. Oh, and set up alerts before you hit disposal limits or permit thresholds - saves you from scrambling last minute. Build these basics first, then add fancier stuff based on what your team actually needs.
Dude, this stuff catches problems way before they blow up your budget - contamination spikes, backed-up waste streams, all that nightmare stuff. Instead of waiting around for weekly reports, you'll see bottlenecks happening live and fix routing on the spot. The predictive alerts are honestly clutch - they warn you before hitting capacity or compliance limits. Oh and finally you get real numbers for budget meetings instead of just "trust me, we need this." I'd say start with alerts for whatever's driving you crazy right now, then add more later.
Start with mapping out your specific regs - that's honestly the only way to do this right. Your waste tracking system has to capture EPA codes, manifests, disposal methods, all that chain of custody stuff because auditors will come for you (trust me on this one). You'll want alerts when you're hitting permit limits or when hazardous waste sits too long. Don't try building a cool dashboard first then cramming compliance in later - that's backwards. The regulations dictate what data fields you need and how long everything gets stored. Way easier to design around requirements upfront.
So basically, line charts are your best friend here - they'll show waste patterns way better than those messy spreadsheets we all hate. Track your top 3 waste streams first by department or production cycle over months. You'll start noticing weird seasonal spikes or which processes are total waste monsters. Set up some alerts when numbers jump above your usual averages so you catch problems early. Oh, and add filters for different facilities - trust me, you'll want to dig into specifics later. The visual patterns honestly make everything click.
Honestly, focus on cost per ton first - that's your bread and butter. Processing time comes next, then compliance rates because those regulatory fines will destroy your budget if you're not careful. Don't sleep on disposal speed either, I've seen entire operations get backed up from slow disposal. Track your landfill diversion rates and energy recovery percentages too. Oh, and environmental impact scores are becoming a big deal with stakeholders lately. Set up automated alerts for when these metrics go sideways, especially compliance stuff. Weekly reviews should catch problems before they get expensive.
Hey! So for feedback, definitely throw a "suggest improvement" button right in your dashboard - that's honestly the easiest thing you can do. I'd also set up quarterly sessions with your power users, especially plant managers since they know where the real problems are. Usage analytics help too, shows you where people actually get stuck versus what they say bugs them. The big thing though? Actually show users what you changed based on their ideas. Start small with UI fixes, then work the bigger stuff into your roadmap. Oh and built-in widgets work great for quick complaints.
So IoT sensors and RFID tags are pretty much the standard now for tracking waste - you get live data on how full containers are, where they're located, all that stuff. Most people go with cloud dashboards like Tableau or Power BI, though some build custom ones with React if they're fancy. The ML prediction stuff actually works way better than I expected, honestly. Just make sure whatever sensors you pick can survive getting beat up in industrial settings. Oh and your dashboard needs to make sense to whoever's actually using it every day - sounds obvious but you'd be surprised. I'd start small with one type of waste first.
So basically, you can feed your waste data into ML models to predict when bins'll be full and optimize pickup routes. The algorithms learn from everything - seasonal patterns, your production schedule, even weather affecting waste levels. Honestly, it's pretty neat how they catch patterns you'd never spot manually. Start simple with a basic forecasting model using your dashboard's historical data. Then throw in production metrics and maintenance schedules to make it more accurate. The system gets smarter over time too, which helps prevent those annoying overflow situations and cuts costs.
Honestly, the data thing is gonna be your biggest nightmare - every department tracks stuff differently and those old systems hate talking to each other. People will push back on new workflows because learning software sucks when you're already swamped. Compliance gets messy too since rules change depending on what you're disposing and where. Oh, and the costs upfront? Not cheap. I'd say pick one waste type to start with, maybe something simple. Get a few people on your side first - makes rolling it out way easier. And yeah, give IT a heads up about integration issues.
First things first - figure out your waste categories, then build everything else around that. Color-code each type in your dashboard so it's actually readable (trust me, staring at boring spreadsheets sucks). Set up barcode scanning or weight sensors at collection points to automatically sort stuff into hazardous, recyclable, and organic buckets. You'll definitely want alerts for hazardous waste limits and compliance deadlines - nobody wants surprise violations. Track volumes and costs separately for each category. Manual input works too if you're just starting out, though it's obviously more work.
Honestly, the collaboration stuff is a game changer for breaking down those departmental walls. You can tag people from ops, procurement, facilities right on waste incidents instead of playing email ping-pong forever. Real-time dashboards keep everyone on the same page with reduction goals and data. The comment threads are clutch for tracking why decisions got made - way better than digging through old emails later. Set up automated alerts so teams know immediately when waste hits certain thresholds. I'd start by getting your key people into the workspace first, then figure out some basic tagging rules so nobody gets left out.
Honestly, don't try tracking everything right away - that's the fastest way to drown in useless data. Pick like 3-4 basics: waste volume, disposal costs, compliance deadlines. Most people build these gorgeous dashboards that nobody actually uses because they don't match what the compliance folks need day-to-day. Also nobody thinks about data quality upfront (learned that one the hard way). Your team won't bother entering stuff if it's complicated, so keep the input dead simple. You can always add the fancy metrics later once you've got the foundation solid.
The dashboard tracks all your waste metrics in one spot, which is honestly a game-changer for sustainability reporting. You'll see exactly where everything goes - recycling, landfill, whatever - and can quickly identify ways to divert more from dumps. Real-time data means you can actually set meaningful targets like "cut landfill waste by 20%" and track if you're hitting them. Board presentations become way easier with concrete numbers. Oh, and CSR reports? Those used to take forever but now all your environmental data's already sitting there ready to go.
Honestly, skip the PowerPoint death march and let people actually play around with real data - they'll pick it up way faster. Different teams need different stuff, so don't lump your operators in with compliance folks. Quick reference cards are clutch for those "wait, how do I..." moments. Pick a dashboard champion from each department (usually whoever's already the unofficial tech person anyway). Here's the thing though - schedule a follow-up in two weeks because that's when people actually start breaking things and have real questions. Oh, and let them make mistakes during training! Better to mess up when it doesn't matter.
Okay so visual clarity is huge - don't make people hunt for what they need. Each user type wants different stuff though. Operations folks need those real-time alerts popping up, executives just want the big picture trends and compliance stuff. Interactive features help too, like being able to click deeper into data instead of staring at boring static charts. Honestly the biggest thing? Don't make it look ancient - I've seen way too many dashboards that scream 2005. Map out who's actually using this thing first, figure out what annoys them, then build around that.
-
Best way of representation of the topic.
-
The Designed Graphic are very professional and classic.