

 0 Comment
 Customer Reviews

We are in an era when sustainability and environmental responsibility are becoming critical to business success. Effective waste management is no longer optional in this timeline—it's the only way forward.
Technology is now entwined in the modern fabric, so whether you are a government worker or part of an NGO, you need professional assistance supported by data-driven tools. Thus, waste management software and tracking dashboards have become an innovative business’s toolkit.
This article covers the top 10 waste management dashboard templates with samples and real-world examples. These templates are specifically designed for waste tracking and collection management and to monitor reduction strategies easily. With their help, you can upgrade your system, reduce costs, improve compliance, and, most importantly, make a positive environmental impact.
These waste management templates come with a practical use case to clearly understand which suits your business model or sector best. While some owners continue to view waste as disposable, these dashboards have the potential to alter your viewpoint. Today, waste is a resource; when tracked and managed smartly, it becomes a lever for environmental change and business growth.
Let’s dive in!
Template 1: Waste Management Tracking Dashboard Template
This PPT dashboard highlights several key points on how waste is handled and how it affects the environment. It shows the amount of greenhouse gas emissions over the years. A section also tracks the percentage of household waste produced and how energy is used based on different fuel sources.
The waste analytics tool in the PPT also illuminates energy use depending on fuel type, such as natural gas, biomass, oil, etc. It also highlights the total percentage of solid waste discarded by the municipality. Grab this editable PPT Dashboard to show how well the waste system works and where it can improve to be more eco-friendly.

Template 2: Solid Waste Management KPI Dashboard Template
Use this dashboard template to understand how waste gets managed over time. The slide provides data regarding the amount of waste collected and how much has been successfully recycled. It also highlights recycled materials like cardboard, metal, plastic, and paper. Additionally, this PPT can be used to understand efficiency regarding the amount of waste collected and how much gets recycled. The recycling management system can also track how recycling efforts have helped save money and reduce environmental impact. Lastly, there’s a chart showing how pollution from waste has decreased over recent years.

Template 3: Weekly KPI Dashboard to Manage Waste Bins and Vehicles
Use this template to manage your weekly waste operations more smartly and visually. It brings everything together: driver status, bin fill levels, truck fuel consumption, and distance covered in one view. For people interested in optimizing daily waste operations—whether it is a municipality or facility team—this template makes it easy to spot inefficiencies and take quick action, simplifies data tracking, and improves planning by providing real-time insights into waste collection and resource utilization. Download it now!

Template 4: Industrial Waste Management and Recycle Dashboard
This template shows a complete overview of how industries manage and recycle waste. The left side shows the total recyclable waste. At the bottom, it smartly divides the waste types—cardboard, paper, metal, plastic, and oil & grease—into waste disposal solutions, showing exact figures for each. Also, it compares recycled vs. collected waste in percentages. It highlights the positive environmental impact through a graph covering CO₂ emissions yearly. Overall, this dashboard helps teams and individuals monitor, analyze, and improve recycling performance and helps build successful businesses.

Template 5: Efficient Solid Waste Management by Software Dashboard
Use this template for a streamlined overview of key operational metrics for waste management. This template displays live data on total sites, drivers, vehicles, and users, enabling organizations to monitor daily operations. The upper section mentions high-level numbers, such as total sites, drivers, vehicles, and active users. It clearly shows how large and active the entire environmental dashboard system is. Then, the lower section includes a detailed table capturing daily vehicle-wise data, vehicle information like numbers, tags, dry and wet waste quantities in tons, and the total waste collected, along with timestamps.

Template 6: Industrial Waste Management Dashboard
This template provides a comprehensive snapshot of waste recycling and disposal performance over the year. Use this template to keep track of recycled materials like cardboard, paper, metal, plastic, and oil & grease, providing details for better planning. In short, this tool helps to track, optimize, and report their waste management operations efficiently.

Template 7: Tracking Waste Administration KPI Dashboard
This dashboard is ideal for any organization that monitors its waste operations holistically. In this, driver status, bin status, and truck usage can be seen clearly. These weekly charts provide an overview of bin cleaning, distance traveled, and a visual breakdown of fuel usage, which shows the exact idea of performance in the market. Also, the pie chart shows the number of clean bins and the number of missing ones. Important KPIs are visible in one place—simple, powerful, and made for smart waste tracking.

Template 8: Industrial Waste Management Dashboard Using Smart Technology
This dashboard is designed to give a smart and clear view of industrial waste management operations. It shows the exact recycled waste data. All the numbers are visible on paper, cardboard, metal, plastic, oil, or grease. We have broken down each category differently. The best part is that CO₂ emissions are also trackable year by year to indicate how effective your system is. Simple, powerful, innovative waste solutions and bright—this dashboard is all about control, sustainability reporting, and results.

Template 9: KPI Dashboard to Manage Waste Bins and Vehicles on Weekly Basis
Use this template to track the status, whether it's vehicles or waste bins, on a weekly basis. It shows everything in real-time—from driver attendance to bin fill levels, low battery alerts, and truck fuel consumption. These graphs define the efficiency of bin cleaning, how much waste has been cleaned timely, and how much was delayed. It also tracks distance covered and weekly fuel usage in a very visual way, making it easy for the team to make smart decisions. Overall, this dashboard acts like a weekly report card for the entire waste collection management and waste management operation.

Template 10: Industrial Analysis Dashboard for Solid Waste Management
This industrial analysis dashboard provides a clear visual breakdown of waste types and disposal methods between two years. Plastic waste, e-waste, municipal waste, and industrial waste have been shown in different categories, and each percentage has been mentioned. Additionally, the dashboard compares the numbers of various disposal methods, including collection, landfill, recycling, and incineration. The dashboard effectively combines donut charts and bar graphs to highlight trends and financial implications (in USD million), offering insights into where efforts and investments should be focused.

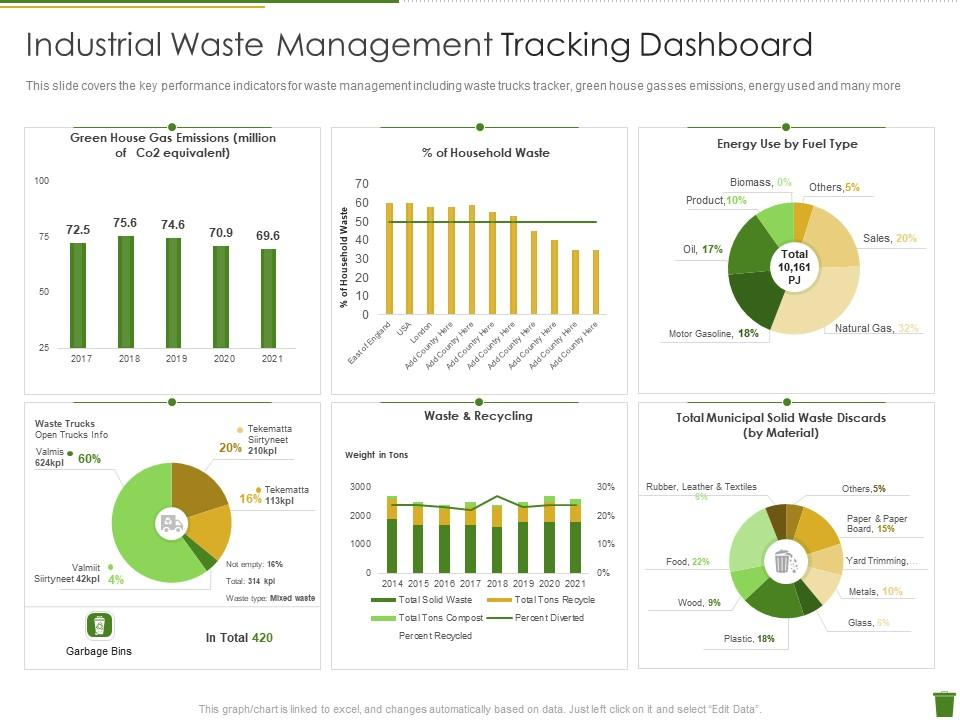
Template 11: Industrial Waste Management Tracking Dashboard
With this powerful tool, you can track all the important areas of waste management. This includes greenhouse gas emissions, household waste percentage, energy use by fuel type, and waste and recycling trends over time. The bottom sections cover the data on garbage truck types, total garbage bin counts, and the involvement of paper in municipal waste (such as plastic, food, and paper). Whether you are a company or an authority, this dashboard provides a roadmap for better planning and informed decision-making to enhance environmental sustainability.
Template 12: Dashboard for Auditing Industrial Waste Management Practices
This smart and data-driven template helps industries audit their waste accordingly and improve their waste management systems. It presents precise data on how much waste has been recycled year to date and how much was recyclable and not manageable. In this way, this PPT Slide also highlights how much money has been saved through recycling. It targets multiple categories like cardboard, paper, metal, plastic, oil & grease, and their breakdown covers which type of waste has been recycled more than others in the market.

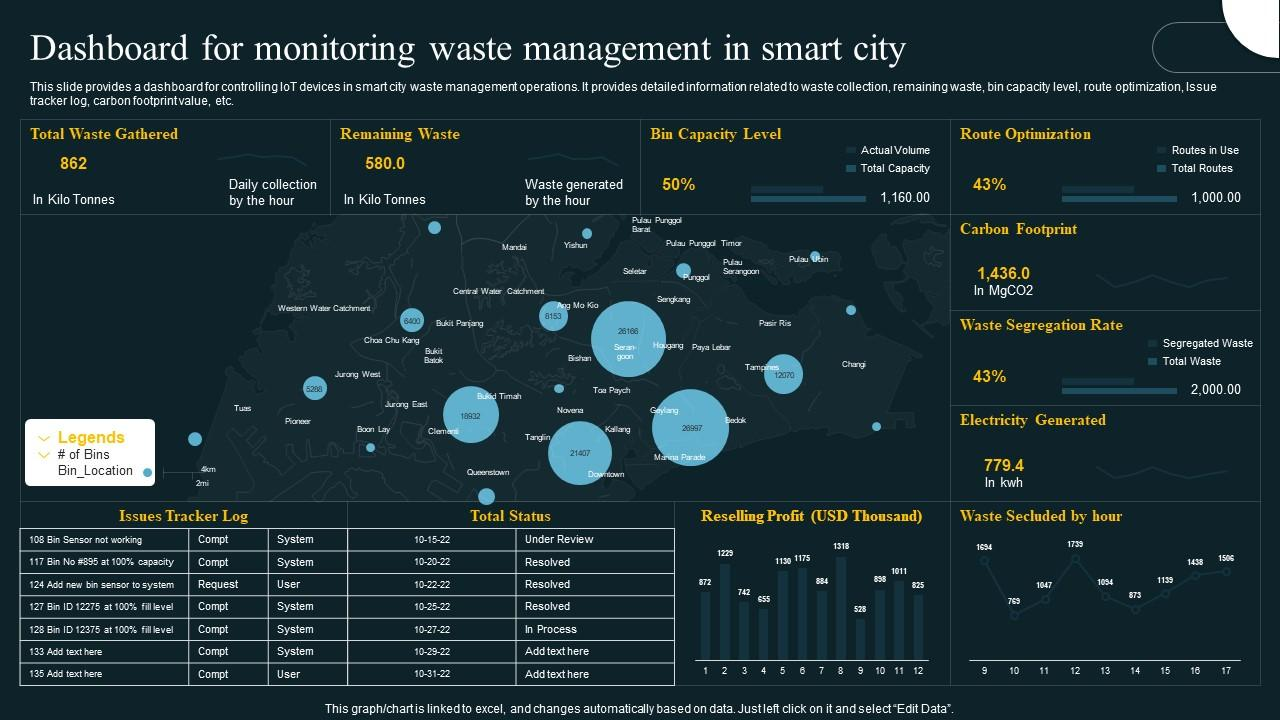
Template 13: Dashboard for Monitoring Waste Management in Smart City
This template is designed to help cities manage waste efficiently and sustainably. The dashboard displays the collected and remaining waste, the capacity of the bins, the carbon footprint, and the profits from recycling. Additionally, the Given smart map that targets bin locations and their capacity made it easy to identify zones that need immediate attention. Also, this dashboard tracks waste scheduled by hour, allowing for better planning and route optimization.
In short, use this template for improving cleanliness, reducing emissions, and boosting recycling efficiency.
Wrapping Up
Waste management dashboard templates are powerful tools for organizations aiming to streamline waste tracking, enhance sustainability reporting, and achieve environmental goals. Our team has designed the top 10 PPT Presets for waste management dashboards, which will help people in their field manage waste tracking and dispose of it efficiently.
Whether it is a recycling system or sustainable reporting, each template saves time and improves decision-making by presenting actionable insights through clean and intuitive designs. From small businesses to managing large-scale operations, these dashboard examples offer a practical foundation to build smarter, greener waste management systems.
PS: Do you want to manage logistics, too? Don't miss this helpful link for ready-to-use logistics dashboard templates.
FAQs on Waste Management
What Types of Waste Are Tracked on the Dashboard?
Types of Waste Tracked:
- Plastic Waste
- Industrial Waste
- Municipal Solid Waste
- Bio-Medical Waste
- E-Waste
What KPIs are Used to Assess Waste Reduction Efforts?
Key KPIs to track waste reduction:
- Total waste generated
- Waste diverted from landfill (%)
- Recycling rate
- Reduction in waste volume/weight
- Cost per ton of garbage managed
- CO₂ emissions reduced
- Percentage of hazardous waste properly to be disposed
- Waste per employee
- Frequency of waste collection
- Savings from waste reduction
What Trends Highlight Efficiency in Collection and Processing?
Trends that highlight efficiency in waste collection and processing:
- Increased recycling rate
- Higher collection coverage & frequency
- Reduced collection time per route
- Decrease in missed pickups or overflow incidents
- Reduction in total waste generated per capita
- Lower operational costs
- Reduced CO₂ emissions from waste operations