


Investor update newsletter powerpoint presentation slides





Try Before you Buy Download Free Sample Product
 Impress Your
 Audience
 100%
100% Editable
 Save Hours
 of Time


Our content-ready investment update newsletter PowerPoint presentation has predesigned templates that can provide quick information about current accounting and financial reporting topics. It can be presented by the management to investors. This investor application PPT presentation contains 60 slides including company update, product team , growth team, business model canvas, annual run rate, revenue model, monthly run revenue, monthly recurring revenue churn, production costs, competitive analysis, market dynamics, marketing budget, platform build on value chain, operating excellence, financial highlights and report, financial strength, sales performance dashboard, finance, revenue and marketing dashboard, customer traction, capital allocation and spending, project spending and reasons for delay, distribution growth, midstream organic growth, adjusted return in capital employed, global demand, diversified global portfolio, etc. The investor Report PowerPoint templates are intended to showcase investor report, investor update, angel investor letter, CEO monthly report, financial investment, growth investing, investing chart, stock advice, deal forecast, investor financing, stakeholder’s information and summary. Download our investment update newsletter PPT slides to present your business progress.Be assured of having the correct facts and figures with our Investor Update Newsletter Powerpoint Presentation Slides. Get all calculations bang on.
People who downloaded this PowerPoint presentation also viewed the following :
Content of this Powerpoint Presentation
Slide 1: Thi slide presents Investor Update Newsletter. State your Company name and get started.
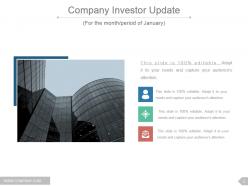
Slide 2: This slide presents Company Investor Update (For the month/period of January).
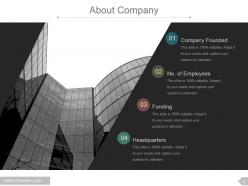
Slide 3: This is an About Company slide presenting information about the following- Company Founded, No. of Employees, Funding, Headquarters.
Slide 4: This slide showcases Our Team with Name and Designation to fill.
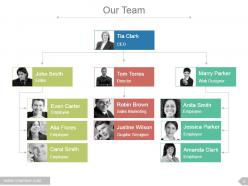
Slide 5: This slide also shows Our Team presented in a hierarchy form.
Slide 6: This slide shows the Product Team with imagery and text boxes.
Slide 7: This slide shows Growth Team slide with name, designation, image and text boxes.
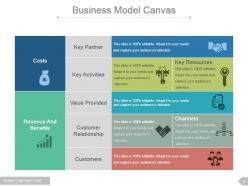
Slide 8: This is Business Model Canvas slide showing- Key Partner, Key Activities, Value Provided, Customer Relationship, Customers, Costs, Revenue And Benefits, Channels.
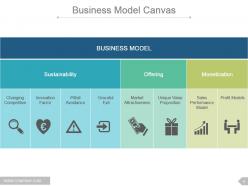
Slide 9: This is another slide showing Business Model Canvas with the following three parameters- Sustainability, Offering, Monetization.
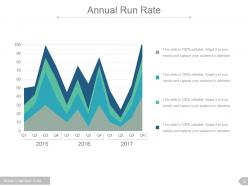
Slide 10: This slide displays Annual Run Rate graphically.
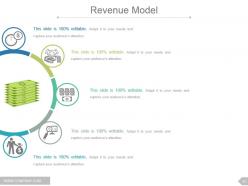
Slide 11: This slide shows Revenue Model with tex boxes and icon imagery.
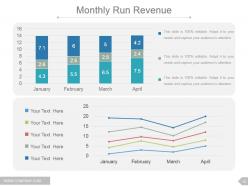
Slide 12: This slide shows Monthly Run Revenue in charts and graphs.
Slide 13: This slide shows Monthly Recurring Revenue Churn graph.
Slide 14: This slide also shows Monthly Recurring Revenue Churn graph.
Slide 15: This slide presents Investment Deals in a tabular form.
Slide 16: This slide presents Production Costs in a graphical form.
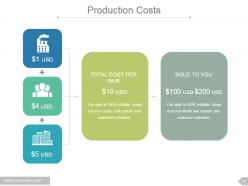
Slide 17: This slide also shows Production Costs further showing- TOTAL COST PER PAIR, SOLD TO YOU.
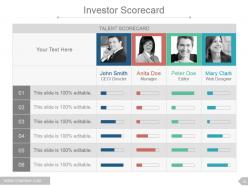
Slide 18: This slide displays Investor Scorecard with name, designation etc. to fill.
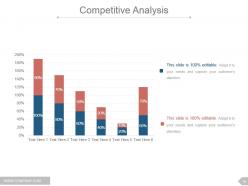
Slide 19: This slide presents Competitive Analysis in a bar graph/ chart form.
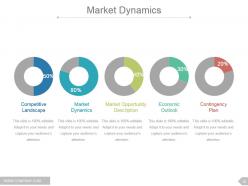
Slide 20: This slide shows Market Dynamics consisting of- Competitive Landscape, Market Dynamics, Market Opportunity Description, Economic Outlook, Contingency Plan.
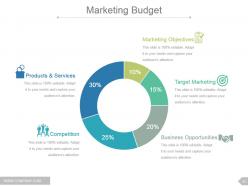
Slide 21: This slide presents Marketing Budget with- Target Marketing, Business Opportunities, Marketing Objectives, Products & Services, Competition.
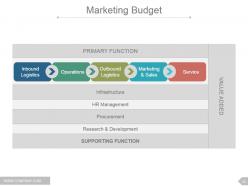
Slide 22: This slide also shows Marketing Budget with- Inbound Logistics, Operations, Outbound Logistics, Marketing & Sales, Service.
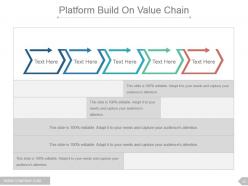
Slide 23: This slide shows the Platform Build On Value Chain with text boxes.
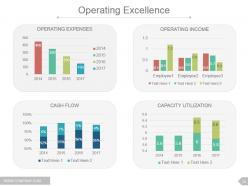
Slide 24: This is Operating Excellence slide showing- CASH FLOW, OPERATING EXPENSES, CAPACITY UTILIZATION, OPERATING INCOME.
Slide 25: This slide presents Financial Highlights graphically.
Slide 26: This slide also shows Financial Highlights with- RETURN ON EQUITY, DIVIDEND PER SHARE, EARNINGS PER SHARE.
Slide 27: This slide presents Financial Report in a bar graph/ chart form. Showcase your own financial report here.
Slide 28: This slide presents Financial Strength in charts and graphs.
Slide 29: This slide displays Sales Performance Dashboard showing- Opportunities By Total Sales Amount, Total Sales By Month, Lead Source Revenue Share, Win\Loss Ratio, Opportunities Total Sales By Probability.
Slide 30: This slide shows Finance Dashboard which further shows- Sales, Operating Expenses, Operating Income, Net Income, Profit & Loss.
Slide 31: This slide shows Revenue Dashboard.
Slide 32: This slide presents Marketing Dashboard.
Slide 33: This slide shows Investment Timeline. You can add investment related aspects in this timeline and make use of it.
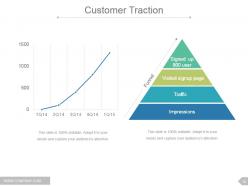
Slide 34: This is a Customer Traction slide presented in a graph and a funnel form.
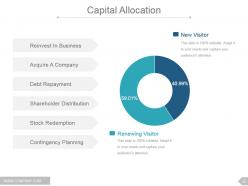
Slide 35: This is Capital Allocation slide presented in a pie char/ graph form showing- Renewing Visitor, New Visitor.
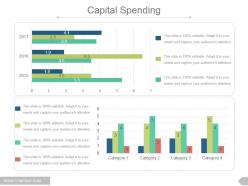
Slide 36: This slide presents Capital Spending in bar chart/ graph form. Showcase the capital you want to spend here.
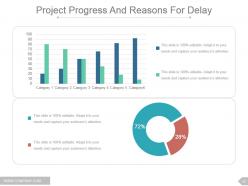
Slide 37: This slide shows Project Progress And Reasons For Delay in charts and graphs.
Slide 38: This slide shows Distribution Growth graph. Use it as per your business need.
Slide 39: This slide shows Midstream Organic Growth chart with several categories. Add these categories with icon imagery here.
Slide 40: This slide shows Adjusted ROCE (Return On Capital Employed) graph.
Slide 41: This slide also shows Adjusted ROCE (Return On Capital Employed) graph which further shows- ROCE, Cost Of Capital.
Slide 42: This slide shows Global Demand on a world map image.
Slide 43: This is Diversified Global Portfolio slide presented on a world map. Mark the number of users in this map and use it accordingly.
Slide 44: This slide is titled Additional slides to proceed forward. Alter the content as per need.
Slide 45: This is an Agenda slide. State your agendas with their respective icons here.
Slide 46: This is Our Mission slide to state your mission, vision and goals.
Slide 47: This is a Dashboard slide to show information in percentages etc.
Slide 48: This is a Location slide to show global growth, presence etc. on a world map image.
Slide 49: This is a Timeline slide to show milestones, growth highlights etc.
Slide 50: This is a Target and a dart image slide. State your targets here.
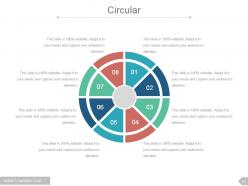
Slide 51: This is a Circular image slide. State specifications, information here.
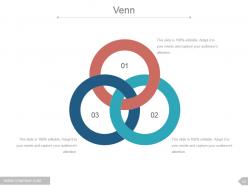
Slide 52: This is a Venn diagram image slide to show information, specifications etc.
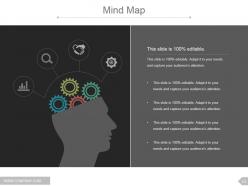
Slide 53: This is a Mind map image slide to show information, specifications etc.
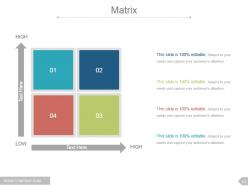
Slide 54: This is a Matrix slide to show information, specifications etc.
Slide 55: This is a Hierarchy image slide to show information, organization/ team structure, specifications etc.
Slide 56: This is a Bulb or Idea slide to state a new idea or highlight specifications/ information etc.
Slide 57: This is a Magnifying Glass image slide to show information, specifications etc.
Slide 58: This is a Bar graph slide to show product/ entity information, specifications, comparison etc.
Slide 59: This is a Funnel image slide. State information, specifications, funneling aspect/ nuances here.
Slide 60: This is a Thank You slide with Address # street number, city, state, Contact Numbers, Email Address.
Investor update newsletter powerpoint presentation slides with all 60 slides:
Don't allow the heat to bother you with our Investor Update Newsletter Powerpoint Presentation Slides. You will never feel flustered.
-

Investor Update Newsletter
-
Company Investor Update For the month period of January
-
About Company
-

Our Team
-
Our Team
-

Product Team
-

Growth Team
-
Business Model Canvas
-
Business Model Canvas
-
Annual Run Rate
-
Revenue Model
-
Monthly Run Revenue
-
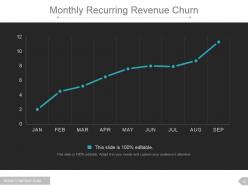
Monthly Recurring Revenue Churn
-
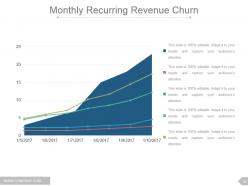
Monthly Recurring Revenue Churn
-
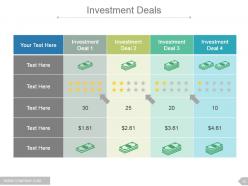
Investment Deals
-
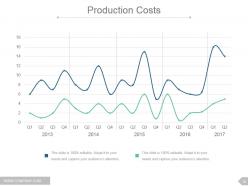
Production Costs
-
Production Costs
-
Investor Scorecard
-
Competitive Analysis
-
Market Dynamics
-
Marketing Budget
-
Marketing Budget
-
Platform Build On Value Chain
-
Operating Excellence
-
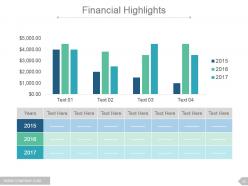
Financial Highlights
-
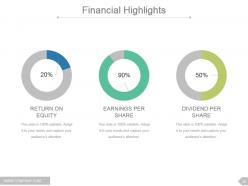
Financial Highlights
-
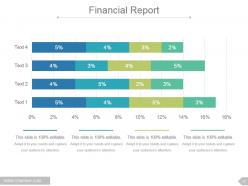
Financial Report
-
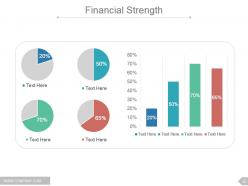
Financial Strength
-

Sales Performance Dashboard
-
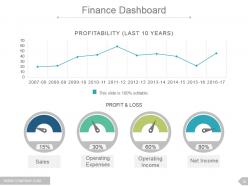
Finance Dashboard
-
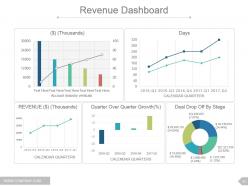
Revenue Dashboard
-
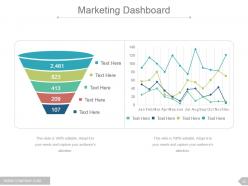
Marketing Dashboard
-
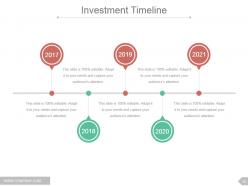
Investment Timeline
-
Customer Traction
-
Capital Allocation
-
Capital Spending
-
Project Progress And Reasons For Delay
-
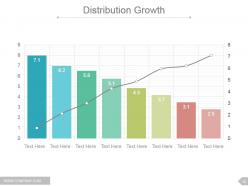
Distribution Growth
-
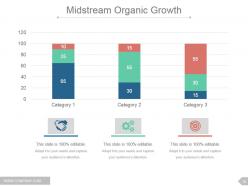
Midstream Organic Growth
-
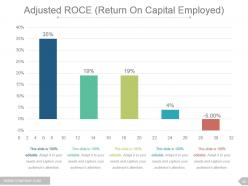
Adjusted ROCE Return On Capital Employed
-
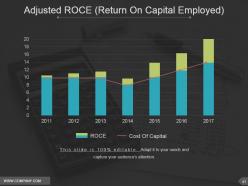
Adjusted ROCE Return On Capital Employed
-
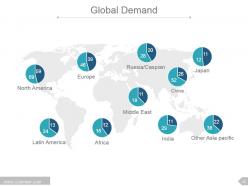
Global Demand
-
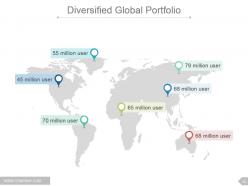
Diversified Global Portfolio
-

Additional Slides
-
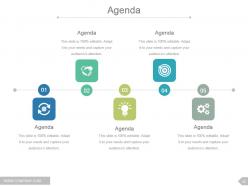
Agenda
-
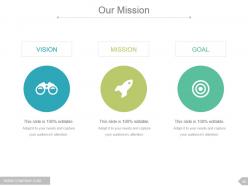
Our Mission
-
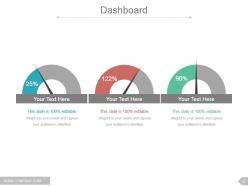
Dashboard
-
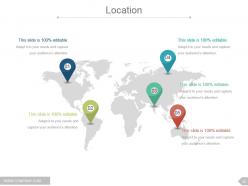
Location
-
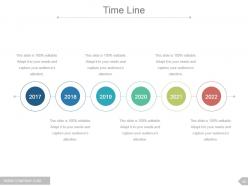
Time Line
-
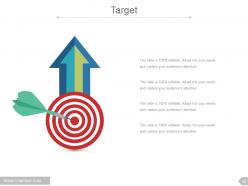
Target
-
Circular
-
Venn
-
Mind Map
-
Matrix
-
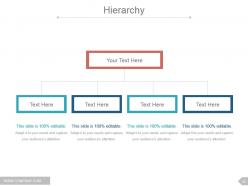
Hierarchy
-
Bulb Or Idea
-
Magnify
-
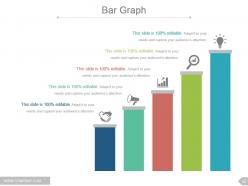
Bar Graph
-
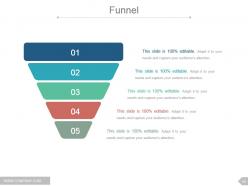
Funnel
-

Thank You
FAQs for Investor update newsletter
Recent trends in investor sentiment toward tech startups include increased focus on profitability over growth, heightened scrutiny of AI and sustainability ventures, preference for proven revenue models, and emphasis on operational efficiency. While funding has become more selective, investors are increasingly drawn to startups demonstrating clear paths to profitability, with many finding that companies prioritizing sustainable growth and measurable ROI attract stronger investment interest.
Macroeconomic factors are significantly reshaping investor strategies through inflation concerns, interest rate volatility, geopolitical tensions, and supply chain disruptions affecting portfolio allocations. Many institutional investors are increasingly diversifying across sectors like healthcare, technology, and renewable energy, while emphasizing defensive positions and ESG criteria, ultimately seeking resilience and long-term value creation despite market uncertainties.
ESG factors increasingly drive investment decisions by helping investors assess long-term risks, identify sustainable growth opportunities, and meet stakeholder expectations for responsible investing. Through ESG integration, financial institutions streamline portfolio management, enhance risk assessment capabilities, and attract environmentally conscious capital, with many investment firms finding that ESG-focused strategies deliver competitive returns while building stronger client relationships.
Companies effectively communicate growth prospects through comprehensive financial projections, detailed market analysis, competitive positioning data, strategic roadmaps, and clear milestone timelines. These presentations enable investors to evaluate scalability potential, revenue trajectories, and risk factors, with many venture capital firms and institutional investors finding that transparent, data-driven narratives ultimately deliver stronger investor confidence and more favorable funding outcomes.
Investors prioritize revenue growth rate, customer acquisition cost, lifetime value, monthly recurring revenue, gross margins, burn rate, and runway metrics when evaluating startups. These financial indicators demonstrate market traction, operational efficiency, and scalability potential, with many venture capitalists finding that consistent growth in these areas, combined with strong unit economics, ultimately signals sustainable business models and competitive advantage in target markets.
Investors assess risk versus reward in volatile markets by analyzing portfolio diversification, market timing strategies, fundamental company analysis, and historical volatility patterns. Through quantitative models and stress testing, financial institutions and fund managers evaluate potential downside exposure while identifying growth opportunities, ultimately balancing conservative positions with strategic investments to optimize returns despite market uncertainty.
Venture capital significantly accelerates innovation by providing funding, expertise, and networks to emerging startups across industries like fintech, healthcare, and clean energy. This strategic investment enables breakthrough technologies, from AI-driven medical diagnostics to renewable energy solutions, while fostering competitive ecosystems that ultimately deliver faster market adoption and transformative industry solutions.
Companies leverage data analytics to attract and retain investors through predictive financial modeling, real-time performance dashboards, risk assessment algorithms, market trend analysis, and competitive benchmarking tools. These capabilities enable organizations to demonstrate transparency, forecast accuracy, and strategic decision-making, with many investors finding that data-driven companies present lower risk profiles and stronger growth potential, ultimately delivering enhanced investor confidence.
Successful post-funding investor relations require regular communication through quarterly reports, strategic milestone updates, and proactive transparency about challenges and opportunities. These approaches enhance trust by maintaining consistent dialogue, providing detailed financial performance data, and involving investors in key strategic decisions, with many growing companies finding that structured communication schedules ultimately strengthen long-term partnerships and future funding potential.
Geographical factors influence emerging market investments through resource availability, infrastructure development, proximity to major trade routes, climate stability, and regulatory environments. Countries with strategic locations, abundant natural resources, and developing transportation networks often attract greater investment, while those facing geographical challenges like landlocked positions or climate vulnerabilities require more targeted approaches, ultimately affecting risk-return profiles and sectoral opportunities.
**INPUT**: What emerging sectors are attracting the most investor interest this year? **OUTPUT**: Emerging sectors attracting significant investor interest include artificial intelligence and machine learning, renewable energy technologies, biotechnology and healthtech, fintech solutions, and sustainable agriculture innovations. These sectors deliver compelling growth opportunities by addressing global challenges, enabling digital transformation, and meeting increasing consumer demand for sustainability, with many institutional investors finding that these areas offer both strong returns and strategic positioning in an increasingly competitive market landscape. **Word count: 60 words**
Businesses can effectively pivot by conducting thorough market analysis, reassessing core competencies, adjusting financial projections, and implementing agile operational frameworks that demonstrate adaptability. Through transparent communication with stakeholders, companies streamline decision-making processes, enhance resource allocation, and ultimately deliver measurable performance improvements, with many organizations finding that proactive strategic pivots strengthen investor confidence.
Investors typically prefer email newsletters, dedicated investor portals, quarterly conference calls, annual meetings, and direct phone communications for receiving updates. These channels enable companies to deliver timely financial reports, strategic announcements, and performance metrics while maintaining transparency, with many institutional investors finding that multi-channel approaches enhance engagement and trust.
Macroeconomic policies significantly influence investor confidence by shaping interest rates, inflation expectations, regulatory frameworks, and fiscal spending priorities across different sectors. Monetary tightening typically benefits financial services while challenging real estate and growth sectors, whereas expansionary fiscal policies often boost infrastructure, healthcare, and technology investments, with many institutional investors finding that policy predictability ultimately delivers more stable returns than favorable but uncertain conditions.
Companies should avoid overwhelming slides with excessive data, failing to clearly articulate their value proposition, neglecting to address potential risks honestly, and lacking a compelling narrative structure. Many organizations find that presentations without specific financial projections, unrealistic timelines, or clear competitive differentiation fail to build investor confidence, ultimately undermining funding opportunities and strategic partnerships.
-
Colors used are bright and distinctive.
-
Attractive design and informative presentation.