


KPI Metrics To Measure Business Leadership Effectiveness




Try Before you Buy Download Free Sample Product
 Impress Your
 Audience
 100%
100% Editable
 Save Hours
 of Time


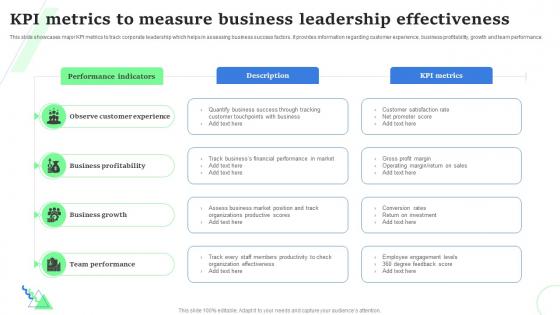
This slide showcases major KPI metrics to track corporate leadership which helps in assessing business success factors. It provides information regarding customer experience, business profitability, growth and team performance.
People who downloaded this PowerPoint presentation also viewed the following :
KPI Metrics To Measure Business Leadership Effectiveness with all 6 slides:
Use our KPI Metrics To Measure Business Leadership Effectiveness to effectively help you save your valuable time. They are readymade to fit into any presentation structure.





FAQs for KPI Metrics To Measure
Leading KPI metrics predict future performance through early indicators like employee training hours, customer acquisition rates, and process improvements, while lagging metrics measure past results such as revenue, customer satisfaction scores, and market share. Leading indicators enable proactive decision-making and course corrections, whereas lagging metrics confirm whether strategic initiatives delivered expected outcomes, with many organizations finding that balancing both types creates comprehensive performance visibility and competitive advantage.
Businesses can determine relevant KPIs by analyzing industry benchmarks, regulatory requirements, customer expectations, and competitive landscapes within their specific sector. Financial services prioritize risk metrics and compliance ratios, while manufacturing focuses on operational efficiency and quality measures, with many organizations finding that strategic alignment between departmental goals and industry standards ultimately delivers measurable competitive advantage.
Data accuracy forms the foundation of reliable KPI evaluation, ensuring metrics reflect true business performance through validated data sources, consistent collection methods, and regular quality audits. Without accurate data, organizations risk making strategic decisions based on flawed insights, with many companies finding that investing in data validation processes ultimately delivers more precise performance tracking and competitive advantage.
Companies should review KPI metrics quarterly for strategic alignment and monthly for operational performance, with critical metrics monitored weekly or daily depending on business velocity. This tiered approach enables organizations to maintain agility while ensuring long-term strategic focus, with many finding that regular reviews enhance decision-making speed and competitive responsiveness.
Best practices for visualizing KPI data include using clear charts with consistent color coding, displaying trend lines over time, incorporating variance indicators, and limiting each slide to 3-5 key metrics. These approaches streamline executive decision-making by highlighting performance gaps, progress toward targets, and actionable insights, with many organizations finding that simplified dashboards enhance stakeholder engagement and accelerate strategic responses.
Organizations align KPI metrics with strategic goals by conducting comprehensive strategic assessments, mapping specific objectives to measurable outcomes, establishing clear performance hierarchies, and implementing regular review cycles. Through cascading frameworks, companies ensure department-level metrics directly support enterprise objectives, with retail chains tracking conversion rates for growth goals and manufacturing firms monitoring efficiency metrics for operational excellence, ultimately delivering strategic clarity and accountability.
Common KPI mistakes include setting too many metrics, choosing vanity metrics over actionable ones, lacking clear ownership, setting unrealistic targets, and failing to align KPIs with strategic objectives. Organizations often find that focusing on 3-5 meaningful metrics, establishing regular review cycles, and ensuring each KPI directly connects to business outcomes delivers better performance tracking and ultimately drives more effective decision-making across teams.
Companies should approach KPI selection by aligning departmental metrics with overall business objectives, considering each department's unique functions, and ensuring measurable outcomes that drive strategic value. Sales teams might focus on conversion rates and revenue growth, while HR departments track employee retention and satisfaction scores, with many organizations finding that cross-departmental collaboration on KPI selection ultimately delivers better organizational alignment and performance visibility.
Cultural factors significantly influence KPI performance through employee engagement levels, communication styles, decision-making processes, and change acceptance rates. Organizations with collaborative cultures often see improved team-based KPIs, while hierarchical structures may excel in compliance metrics, with many companies finding that aligning cultural values with strategic objectives ultimately delivers enhanced performance outcomes and sustainable competitive advantage.
Automation tools enhance KPI tracking by eliminating manual data collection, providing real-time dashboards, and generating automated reports with advanced analytics capabilities. These technologies streamline performance monitoring across departments like sales, marketing, and operations, while reducing human error and delivering faster insights, ultimately enabling organizations to make data-driven decisions more efficiently.
Setting unrealistic KPI targets creates employee frustration, decreased motivation, and potential data manipulation as teams struggle to meet unattainable goals. While ambitious targets can drive performance, unrealistic expectations often lead to reduced productivity, higher turnover rates, and strategic misalignment, with many organizations finding that balanced, challenging yet achievable targets deliver better long-term results.
Small businesses can effectively implement KPI metrics by focusing on free analytics tools like Google Analytics, leveraging existing software dashboards, and starting with 3-5 essential metrics tied to revenue goals. This streamlined approach enables resource-conscious organizations to track customer acquisition costs, conversion rates, and cash flow indicators, ultimately delivering measurable insights for strategic decision-making without overwhelming operational capacity.
Effective methods include visual dashboards, executive summary reports, interactive presentations, automated alerts, and regular review meetings. These approaches enhance stakeholder engagement by presenting complex data through intuitive charts, real-time updates, and contextual insights, while many organizations find that combining multiple communication channels ensures broader understanding and faster decision-making across different audience preferences.
Qualitative KPIs measure subjective aspects like customer satisfaction, employee engagement, brand perception, and service quality through surveys and feedback, while quantitative KPIs track measurable numerical data such as revenue, conversion rates, and productivity metrics. Organizations use qualitative KPIs to understand underlying drivers of performance and customer experiences, with many companies finding that combining both approaches delivers comprehensive insights, enabling strategic decision-making and ultimately enhancing operational effectiveness.
Over-reliance on KPI metrics can create tunnel vision, discourage innovation, and foster short-term thinking at the expense of long-term strategy. While metrics provide valuable insights, organizations increasingly find that excessive focus can lead to gaming behaviors, reduced collaboration between departments, and missed opportunities for creative problem-solving that drives sustainable competitive advantage.
-
World-class PowerPoint designs that are fully customizable!
-
Informative presentations that are easily editable.