


Kpi table for hr manager with key result




Try Before you Buy Download Free Sample Product
 Impress Your
 Audience
 100%
100% Editable
 Save Hours
 of Time


Measure the success of the HR department with the help of the KPI Table For HR Manager With Key Result slideshow. Describe the basic formula for calculating key performance indicators with the help of the KPI matrix PPT theme. This HR key performance matrix PPT template will help in tracking the pre-defined organizational goals of human resource management. Take the assistance of project portfolio PPT infographics to meet your strategic goals by showcasing the report that includes a detailed listing of projects with their status, alignment, risk, budget cost, planned cost, and variance with this project portfolio PPT graphic. You can easily represent how well the company is able to reach business goals with the help of KPI in HR PowerPoint slide design. Describe high-level and low-level KPIs and showcase how they affect the overall performance of the business. Optimize recruiting processes, employee engagement, turnover rates, training costs, etc. by utilizing this KPI dashboard PPT template. Track the organizational goals to the human resource department by easily downloading the portfolio management PPT slide.
People who downloaded this PowerPoint presentation also viewed the following :
Content of this Powerpoint Presentation
Human Resources is a critical department in all businesses that helps it stay organized and ensures relevant laws related to recruitment and compensation are passed. Its major function, however, is to ensure that the productivity and morale (also referred to as engagement) of employees are high, and there is always a positive correlation between work employees, their liking for it, and the company.
An HR KPI dashboard on customer engagement showcases all that is right or wrong with the business. Get it here.
An HR manager oversees all major tasks involved in ensuring that the recruitment, learning development, and training needs of all employees are optimally always met. A team under the manager carries out these tasks, but the manager is responsible for supervision and overall responsibility.
To ensure there are verifiable, achievable, and transparent mechanisms linked to each of these tasks, a Key Performance Indicator (KPI) system is available in all organizations.
Here’s a complete deck on HR KPIs Template Bundles.
This blog and the template below go deep into the KPI table for HR managers with key results in this blog.
The idea is to ensure HR managers’ KPIs get recognition and can easily take steps to correct them if needed.
Businesses usually struggle to create a well-defined table that captures all major functional areas with critical KPIs. Hence, SlideTeam has provided this clutter-free template and many others to ensure businesses can implement KPIs with the minimum effort, just by downloading our expert-curated slide.
Each of the templates is 100% editable and customizable, providing you with structure, a starting point, and the capability to customize according to the audience profile.
Let’s explore.
Template 1 KPI Table for HR Manager with Key Results PPTs
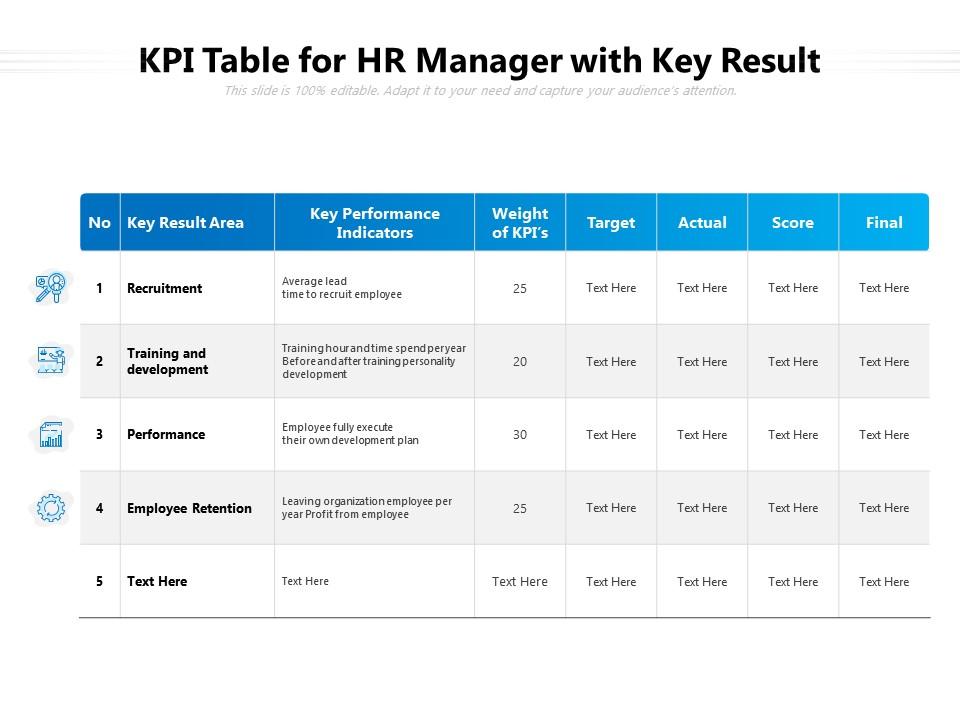
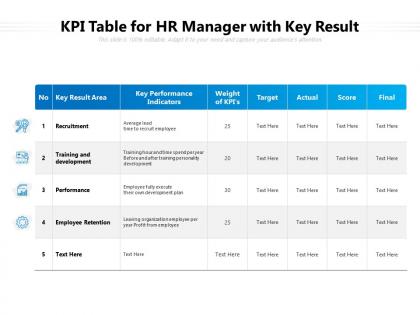
This is a top-notch PowerPoint Template for an HR manager to set and evaluate their Key Performance Indicators (KPIs). The idea is to ensure that each of the KPIs in their functional areas of recruitment, training and development, performance and employee retention are assigned appropriate weights. The target and actual are entered into the clutter-free table that the slide provides. The actual score on the variable is also filled in, with space provided for final comments as well. This content-ready PowerPoint Slide showcases all functional areas of human resource management to ensure the evaluation of KPIs arrived at is fair, transparent, and well-accepted. HR managers can use this PowerPoint Template to outline tasks involved in a particular vertical as well. For instance, the average lead time to recruit employees is an important KPI for people in HR who are concerned with recruitment. Download this PPT Graphic now and understand how HR processes can also be linked to verifiable, transparent results and create value for all. The icons chosen to represent each of the verticals have been given much thought. The slide is a perfect match for your business’s need to assess HR functioning. Get it now!
HR Manager KPIs Mean a lot
Without adequate and timely information on HR manager KPIs, businesses can be rendered blind to imminent crises related to their people. If, for instance, recruitment time stays low for years, there is a near-certainty of an acute staff shortage at any time, and so on. Download this PPT from SlideTeam and ensure you are always one step ahead in terms of your people requirements.
PS Understand and apply HR Performance Management Metrics here
Kpi table for hr manager with key result with all 2 slides:
Give your audience a fulfilling experience. They will find our KPI Table For HR Manager With Key Result elevating.
FAQs for Kpi table for hr manager
Honestly, start with employee Net Promoter Score and retention rates - those two will tell you everything you need to know right off the bat. Track which departments are bleeding people and look at internal mobility too. Bad managers are engagement killers, so definitely get those 360 reviews going. I'd also watch training completion rates, how many people actually show up to company events, and absenteeism patterns. Oh, and exit interview feedback is gold if you can spot the trends. Some of this stuff overlaps but retention and eNPS are your main indicators. If those look good, you're probably doing something right.
Track both immediate and long-term stuff to get the whole story. Reaction scores and knowledge tests right after training are your starting point. Then wait a few months and check behavior changes through 360 feedback or manager reviews. The money metrics? Compare performance improvements and retention rates between trained vs untrained employees. Honestly, quarterly dashboards make this way easier than I expected. Yeah, it's a bunch of data but the patterns jump out pretty fast when you see everything together. That's your ROI proof right there.
Turnover rate is basically your company's pulse check - I've seen it catch so many issues early. High numbers? Usually means crappy managers, bad pay, toxic culture, or you're hiring the wrong people to begin with. Low turnover sounds great but weirdly low might mean people feel trapped (which isn't ideal either). You'll want to track it monthly and compare to industry standards. That's really the only way to know if your HR stuff is actually working. Oh, and don't panic over one bad month - look for patterns instead.
KPIs will show you exactly where your hiring process is falling apart. I'd track time-to-hire, cost-per-hire, and which job boards actually bring in decent candidates. Most HR teams just spray money everywhere and cross their fingers - it's wild how common that is. You'll quickly see if people bail after phone screens or if certain roles are impossible to fill. Maybe your hiring managers are being unrealistic? Pick like 3-5 metrics and check them monthly. Way better than guessing what's broken.
Start with representation numbers across departments and levels - that's your baseline. Track where diverse candidates drop out during hiring because that's usually eye-opening. Employee engagement scores by demographic group matter way more than overall numbers tbh. Retention and promotion rates tell you if people actually stick around and advance. Pay equity analysis is non-negotiable. Pulse surveys catch sentiment issues early, and exit interview patterns show what's really going wrong. Pick 3-4 metrics tied to your biggest goals first. Don't try measuring everything at once or you'll drown in data.
So I'd focus on the big ones first - turnover rates, eNPS scores, and those engagement surveys. Monthly or quarterly works fine. Exit interviews are honestly where the real tea is, but most companies just stick them in a folder somewhere which is such a waste. Also track how many people you're promoting internally since that stuff matters way more than people think. Absenteeism rates help too. Don't go crazy with like 15 different metrics right off the bat. Pick maybe 3-4 and throw them on a simple dashboard so you can actually see what's happening. Then when something looks off, you can dig deeper.
Honestly, start with the basics - are people actually completing their reviews? Then check if engagement scores improve and whether employees hit goals post-review. Manager feedback quality matters too (some just go through the motions, you know?). Retention of your best people is huge. Internal promotions tell you if you're developing talent or just doing paperwork. But here's what really matters - survey employees about whether the whole thing actually helps them grow. Most companies skip this part. Track those metrics first and you'll spot the problems fast.
Dude, this is huge - probably the single most important thing with KPIs tbh. You want your HR stuff directly tied to what the business actually cares about. Like if they're gunning for 20% revenue growth, focus on how fast you're hiring talent or keeping your top performers around. Those numbers actually matter to leadership. I learned this the hard way - spent months tracking metrics that looked impressive but nobody upstairs gave a damn about them. Now I always ask myself: "Does hitting this number actually help us win?" That question changes everything. Makes you a real partner instead of just... I dunno, the person who does exit interviews.
Honestly, start with turnover rate - it's the obvious baseline. But here's what really matters: break it down by department and how long people have been there. That's where you'll see the real problems. eNPS is clutch because it shows whether employees would actually tell their friends to work there (brutal honesty right there). Time-to-fill for replacements gets overlooked but it's huge - when turnover's bad, recruiting becomes this expensive nightmare. Exit interview patterns are gold too. Internal promotion rates? Critical. Shows if people think they have a future there or they're just marking time until something better comes along.
Honestly, just start with the basics - output per employee and how long tasks actually take to finish. Revenue per person is solid too. Don't go crazy with like 15 different metrics right off the bat, you'll just confuse yourself. Maybe 3-4 max that actually matter for your business. Oh and definitely track sick days/absences since people not showing up obviously kills productivity. I'd set up some kind of monthly tracker so you can catch problems early. Compare stuff month to month and between teams - that's where you'll see the real patterns.
Start with industry standards for your sector - turnover rates, time-to-hire, employee satisfaction stuff like that. But honestly, your own historical data matters just as much for spotting trends. I've found quarterly comparisons way more helpful than yearly ones since everything moves so fast now. Company size and location make a huge difference too - what works for a startup in Austin won't match a big corp in NYC. Pick maybe 3-4 benchmarks that actually align with your biggest headaches and go from there. Don't overcomplicate it at first.
Honestly, tracking the right metrics beats those awful annual surveys everyone ignores. Look at your employee Net Promoter Score and internal mobility rates - they'll show you what's really happening. Exit interview patterns are gold mines too. Department turnover rates? That's how you spot which managers are tanking morale. I'd set up a monthly dashboard (sounds fancy but it's worth it) so you catch problems before half your team bails. Engagement scores tell you if your culture fixes actually work. Don't obsess over single numbers though - it's all about watching trends develop over time.
KPIs are like dashboard warning lights for compliance stuff - when something's flashing, you know where to look. Track things like training completion rates, incident reports, and turnover in risky positions. Audit findings too, obviously. Honestly, the best part is showing leadership you're actually on top of problems instead of scrambling when things go sideways. Set up automated alerts for the critical metrics so you're not stuck checking endless spreadsheets all day. Way better than playing catch-up after something blows up.
Look, data analytics shows you which KPIs actually move the needle vs. just looking pretty on dashboards. You'll spot correlation patterns between your metrics and real business outcomes - like retention or productivity stuff that matters. Plus it catches weird data glitches early. I've seen turnover rates go crazy because someone fat-fingered the termination codes. Super embarrassing in exec meetings. The cool part? Predictive analytics makes your KPIs forward-looking instead of just telling you what already happened. My advice: don't try to boil the ocean. Pick one or two metrics first and really nail those.
Honestly, the biggest pain points are usually data quality and team pushback. Nobody wants to feel like Big Brother is watching, so people either resist or start gaming the numbers. I've seen teams completely BS their metrics just to look good. Choosing what to track is tricky too - you'll want to measure everything but that just creates a mess. Don't even get me started on pulling data from different systems; it's always inconsistent and annoying. Start with maybe 3-4 KPIs that actually move the needle. Be upfront about why you're doing this and let your team help pick what matters.
No Reviews