


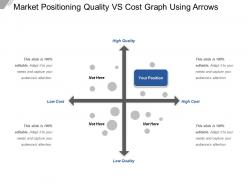
Market positioning quality vs cost graph using arrows


Try Before you Buy Download Free Sample Product
 Impress Your
 Audience
Editable
of Time


Be gentle in your conduct with our Market Positioning Quality Vs Cost Graph Using Arrows. Avoid following a heavy handed approach.
People who downloaded this PowerPoint presentation also viewed the following :
Market positioning quality vs cost graph using arrows with all 5 slides:
Create good conditions with our Market Positioning Quality Vs Cost Graph Using Arrows. They are quite conducive to that.
FAQs for Market positioning quality vs cost
Figure out exactly who you're talking to first - like, get super specific about their actual problems. Most people think they know but they're way off. Your unique thing needs to be crystal clear too. What do you do that literally nobody else does? And yeah, definitely check out your competition because everyone says they don't have any (spoiler: they do). Keep it stupid simple. If you can't explain what you do in one sentence without industry buzzwords, you're overthinking it. I'd write that one-liner and test it with a few real people before you go all-in on it.
Customer segmentation is a game changer - it stops you from trying to be everything to everyone. You figure out who your different groups are, what bugs them, what they care about. Then you can actually speak to them directly instead of some bland generic message. Netflix does this perfectly, right? They hit families with kid-friendly stuff but show singles all the binge-worthy series. Same product, completely different angle. Honestly, most companies mess this up by staying too vague. Map out what each segment needs, see how competitors are talking to them, and you'll find gaps where you can own the conversation.
Think of competitor analysis as your cheat sheet for positioning. Map out your top 3-5 competitors first - check their websites, messaging, pricing, who they're targeting. You'll spot gaps you can jump into. I swear, so many companies skip this and accidentally copy their biggest rival's exact positioning (yikes). Once you see where everyone sits, you can pick a spot that makes you stand out but still connects with your audience. It's like finding the perfect parking space - you need to see what's already taken before you know where to squeeze in.
Focus on feelings over features - that's where the magic happens. Nike doesn't sell shoes, they sell motivation. Apple makes you feel like a creative genius, not just someone buying tech. Map out what emotions your customers actually experience, then build everything around that. Your messaging, your visuals, even how customer service talks to people. I mean, price matters sure, but emotional connection is what keeps people coming back. Find the feeling that matches both your brand and what your audience really wants deep down. Weave it through everything consistently.
Think of your unique value proposition as your secret weapon - it's what makes people pick you instead of scrolling past to your competitors. Without one, you're basically invisible in the marketplace (which sucks). A solid UVP tells customers exactly what problem you solve and why you're the best at it. This drives everything else - your messaging, who you go after, where you focus your energy. Don't just throw together some generic "we provide quality solutions" garbage though. Make it specific and actually different from what everyone else is saying.
Honestly, visuals beat walls of text every single time. You'll want charts that instantly show your competitive edge - way better than rambling for 10 minutes about why you're different. Brand colors help people remember you, and infographics make complicated stuff click faster. I've watched simple comparison charts completely steal the show in presentations. Different people learn differently too, so photos and icons help everyone get it. Just don't throw in random graphics that look pretty but don't actually support your story. Map out your main points first, then figure out which visuals work best for each one.
Start with brand awareness surveys - do people actually know who you are? Net Promoter Score is huge for seeing if your positioning hits emotionally. Market share data shows competitive performance, but honestly that's sometimes hard to get reliable numbers on. Conversion rates and customer acquisition costs tell you if messaging drives real action. Brand recall matters too - when someone needs your category, do they think of you? I'd probably focus on awareness and sentiment surveys first since they directly show whether you're connecting with your target audience or not.
Honestly, digital transformation flips brand positioning on its head. Your customers aren't just seeing ads anymore - they're hitting you up on social, your website, apps, maybe even chatbots. That old approach where you'd set your positioning once and call it a day? Totally doesn't work now. You've got to be way more agile about it. What clicks with one group might completely miss the mark with another. I'd start by figuring out everywhere customers actually touch your brand digitally, then make sure your message feels consistent but can bend when it needs to. Real-time data is your friend here.
Honestly, the worst thing you can do is go crazy with changes overnight. Your current customers will be like "wtf happened to this company?" Classic mistake I see everywhere - people get jealous of competitors killing it in some other space and think repositioning will magically fix everything. But here's the thing: you better actually be able to deliver whatever you're promising with this new direction. Don't just throw fresh marketing copy on your same crappy product. Oh, and test it with real people first! What sounds genius in meetings usually bombs hard in the real world.
Quarterly surveys are your best bet for tracking how people actually see your brand vs. how you want them to. Also keep an eye on social media mentions and what your support team's hearing - they're honestly goldmines for real customer sentiment since they get all the complaints first. You'll want to measure stuff like brand recall and how customers describe you compared to competitors. Here's the thing though: don't just collect this data and let it sit there. Test small messaging changes in one channel first (email works great) before going all-in everywhere. Makes the whole process way less risky.
So positioning and brand equity? They totally go hand in hand. Get your positioning right first - that's what builds everything else. Look at Apple - their whole "premium tech" thing is why people will pay $1200 for a phone and actually feel good about it. Weird but true. Your positioning basically tells customers what makes you different and valuable compared to everyone else out there. The more distinct your position, the stronger your brand becomes over time. It's like... positioning is the foundation, brand equity is what you build on top. Focus on nailing that positioning strategy because it drives everything else.
Oh man, this is such a big deal and honestly most companies mess it up badly. Colors, messaging, even basic benefits get read totally differently across cultures. McDonald's figured this out - they're premium coffee in France but fast convenience here. You can't just translate your positioning and call it a day. Research stuff like whether your target market values individualism or group thinking first. What works at home might bomb elsewhere. I've watched brands waste crazy money assuming their US messaging would fly in Asia or Europe. Each market needs its own approach based on what actually matters to those specific people.
Honestly, it's like trying to keep everyone singing from the same songbook when half the choir can't read music. Your social team wants punchy one-liners while the website needs those long-form explanations, and don't even get me started on sales going rogue with messaging. Different teams run different channels without talking to each other much. Customers notice everything though - they're seeing your Instagram, then hitting your website, maybe chatting with sales all in one day. Any mixed messages stick out like crazy. Regular check-ins help, plus simple guidelines that actually translate across platforms without sounding forced.
Dude, stories are honestly a game-changer for positioning. People forget features but they remember narratives - especially ones about solving real problems or how your company started. Way more memorable than competitors just rattling off specs, you know? Plus it creates this emotional hook that makes your brand actually stick. I was skeptical at first but it really works. Maybe start with one solid customer transformation story? Then just work that into your messaging everywhere. Short answer: humans connect with stories, not bullet points.
Look, innovation is what keeps you from becoming irrelevant. Customer expectations change constantly - what they loved last year might bore them now. Your competitors are watching too, waiting for you to get comfortable so they can swoop in with something fresher. Honestly, I've seen so many brands just coast on past success until suddenly nobody cares anymore. You need to keep evolving your products, experience, messaging - whatever sets you apart. Make it part of your regular routine instead of scrambling when sales start dropping. Otherwise you'll look outdated while everyone else seems cutting-edge.
-
Out of the box and creative design.
-
Great experience, I would definitely use your services further.