


Net working capital analysis powerpoint presentation slides





Try Before you Buy Download Free Sample Product
 Impress Your
 Audience
 100%
100% Editable
 Save Hours
 of Time


Select our content ready Net Working Capital Analysis PowerPoint Presentation Slides to analyze the impact of working capital management on the firm’s performance. This readymade working capital management PPT slides can help you to provide an insight into the operating efficiency of the company. The easy to understand working capital computation PowerPoint complete deck covers visually appealing slides such as kinds of working capital, components, importance, elements, sources, importance, optimization, description, management, yearly net-working capital table, monthly calculation table, modeling chart, computation steps chart, etc. Furthermore, operating capital assessment can also be used for related topics like financial ratio analysis, cash conversion cycle, overtrading, quick ratio analysis, sustainable growth rate, financial performance analysis and many more. Showcase the relationship between short-term assets and short-term liabilities using the professionally designed gross working capital analysis PPT visuals. Download ready to use working capital modeling presentation deck to measure a company’s operating liquidity. Analyze every challenge with our Net Working Capital Analysis Powerpoint Presentation Slides. Be able to figure it all out in detail.
People who downloaded this PowerPoint presentation also viewed the following :
Content of this Powerpoint Presentation
Slide 1: This slide introduces Net Working Capital Analysis. State Your Company Name and begin.
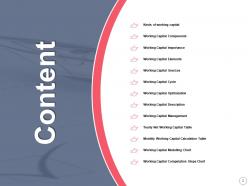
Slide 2: This slide shows Content of the presentation.
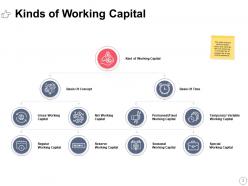
Slide 3: This slide presents Kinds of Working Capital which the user can select to manage day to day trading operations.
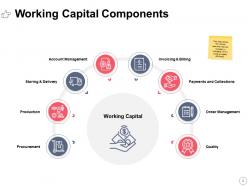
Slide 4: This slide displays Working Capital Components describing the various elements that are included in managing firm’s working capital efficiently.
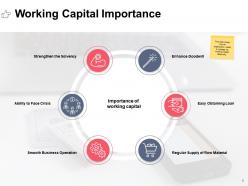
Slide 5: This slide represents Working Capital Importance describing why an organization needs to manage its working capital effectively.
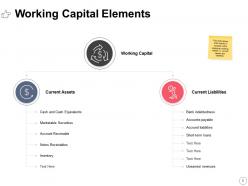
Slide 6: This slide showcases Working Capital Elements describing what exactly is included while analyzing working capital i.e. current assets and liabilities.
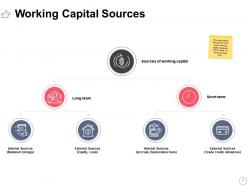
Slide 7: This slide shows Working Capital Sources from where working capital expenses can be made i.e. short and long term.
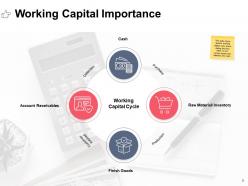
Slide 8: This slide presents Working Capital Importance describing general working capital cycle which stating the time taken to turn current assets and liabilities into cash.
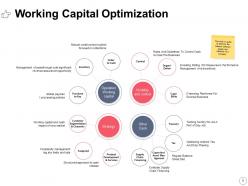
Slide 9: This slide displays Working Capital Optimization useful to optimize the balance between assets and liabilities of a company.
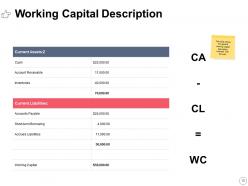
Slide 10: This slide represents Working Capital Description with example and formula.
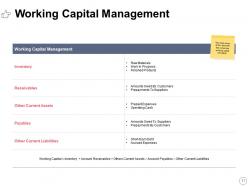
Slide 11: This slide showcases Working Capital Management with elements that comprises working capital calculation.
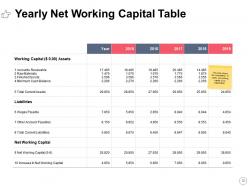
Slide 12: This slide presents Yearly Net Working Capital Table showing the computation of yearly net working capital of an organization.
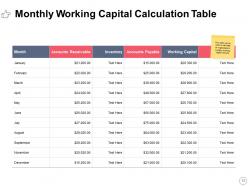
Slide 13: This slide shows Monthly Working Capital Calculation Table.
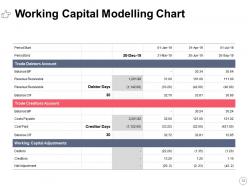
Slide 14: This slide presents Working Capital Modelling Chart.
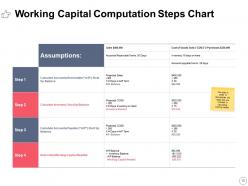
Slide 15: This slide displays Working Capital Computation Steps Chart to demonstrate the steps that are included in calculating working capital.
Slide 16: This slide displays Working Capital Analysis Icons.
Slide 17: This slide reminds about a 15 minutes coffee break.
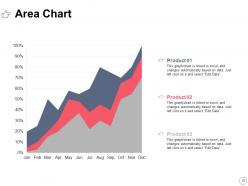
Slide 18: This slide displays Area chart with three products comparison.
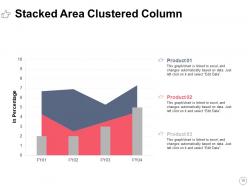
Slide 19: This slide represents Stacked Area Clustered Column chart with three products comparison.
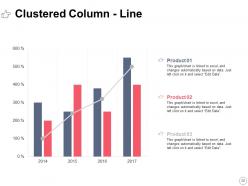
Slide 20: This slide showcases Clustered Column - Line chart with three products comparison.
Slide 21: This is Our Mission slide with related imagery and text.
Slide 22: This is Meet Our Team slide with names and designation.
Slide 23: This is About Us slide to show company specifications etc.
Slide 24: This slide shows Swot Analysis describing- Strengths, Weaknesses, Opportunities and Threats.
Slide 25: This is a Financial slide. Show your finance related stuff here.
Slide 26: This is a Target slide. State your targets here.
Slide 27: This is a Venn slide with text boxes.
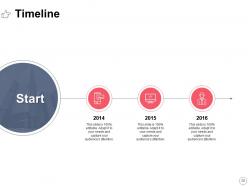
Slide 28: This is a Timeline slide to show information related with time period.
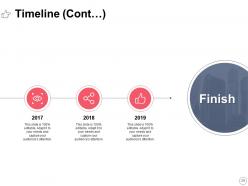
Slide 29: This is another slide continuing Timeline.
Slide 30: This is a Thank You slide with address, contact numbers and email address.
Net working capital analysis powerpoint presentation slides with all 30 slides:
You have belief amd faith in your futuristic plans. Chalk them out for your team with our Net Working Capital Analysis Powerpoint Presentation Slides.











FAQs for Net working capital analysis
So working capital is just current assets minus current liabilities - basically shows your cash cushion for daily operations. You want this positive so you can actually pay suppliers and staff without panicking (trust me on this one). When it goes negative, you're screwed because vendors get pissed and your credit takes a hit. I check mine monthly because honestly, most cash flow problems sneak up on you. If the number's dropping, figure out why fast. Short sentences help clarity here. It's literally your business's breathing room between "we're good" and "oh shit we can't make payroll."
So you just take current assets (cash, inventory, accounts receivable) minus current liabilities (accounts payable, short-term debt, that kind of stuff). Basic subtraction really. Just make sure all your numbers are from the same date or you'll get a wonky snapshot. I track mine monthly because trends matter more than one-off calculations. Declining NWC usually means cash flow problems are coming down the pipeline. Oh, and definitely set up a spreadsheet template now - way better than frantically calculating it when your boss asks for it tomorrow. Trust me on that one.
Working capital boils down to current assets (cash, A/R, inventory) minus current liabilities (payables, short-term debt, accrued stuff). Pretty straightforward math. A/R, inventory, and A/P are where the action happens - they're what actually move your numbers quarter to quarter. Cash matters but it's more like the end result, you know? For tracking trends, look at days sales outstanding, inventory turns, and how you're managing supplier payment terms. DSO can be tricky though since it varies so much by industry. These metrics show you what's really driving your working capital changes instead of just looking at the raw numbers.
Okay so net working capital is just current assets minus current liabilities - basically tells you how much cash you've got for daily stuff. Positive NWC means you can cover your bills no problem. If it goes negative though, you're probably gonna have trouble paying things on time. Think of it like your checking account vs monthly expenses, you know? I'd check this every month because honestly, cash flow issues sneak up on you way faster than you think. Short-term liquidity matters more than most people realize.
So positive net working capital usually means your inventory's growing, customers owe you more money from increased sales, and you've got decent terms with suppliers. Current assets are just outpacing what you owe short-term. Flip side - negative working capital hits when you're paying suppliers too fast compared to collecting from customers, or you've got major debt due soon. Honestly though, retail companies actually want this since they get customer cash before paying vendors! Don't just look at one quarter's numbers. Pull like 3-4 quarters to see if the trend's heading up or down.
Alright, so there's basically three things you wanna focus on. Get your customers to pay you faster - maybe throw in some early payment discounts or be more annoying about following up on late payments. Inventory's honestly the hardest part because nobody wants to run out of stuff, but try to get better at predicting what you'll actually need. Oh, and flip the script with suppliers - ask for longer payment terms but don't be a jerk about it. The whole point is collecting cash before you have to pay it out. I'd track your cash conversion cycle monthly to see if you're actually getting better at this.
Oh man, seasonal swings can totally mess with your working capital if you're not ready for them. Cash needs go crazy - inventory piles up before busy seasons, receivables jump when everyone's buying, then payment timing gets all wonky. Retail's the obvious example, but honestly most businesses have some version of this. Their working capital can literally triple during holidays. You've got to look at multiple years of data to figure out what's normal seasonal stuff versus actual problems. The trick is seeing these patterns coming so you can line up financing before you're scrambling for cash.
So inventory directly hits your working capital because it ties up cash that you could use elsewhere. Build up too much stock? You're converting liquid cash into stuff sitting on shelves. It's honestly like having money trapped in limbo. When inventory drops through sales or write-offs, your working capital bounces back since that cash gets freed up again. I'd watch your inventory turnover ratio though - slow-moving products are sneaky working capital killers. The whole thing is basically a balancing act between having enough stock and not drowning your cash flow.
Look, there are basically three ways to fix your cash flow cycle. Speed up collections by tightening credit policies and offering early payment discounts - trust me, those discounts pay for themselves. Then flip it around with suppliers and negotiate longer payment terms without pissing anyone off. Inventory's trickier though. Just-in-time ordering helps, plus better forecasting so you're not sitting on dead stock. I'd honestly start by figuring out your current cycle days first, then tackle whatever's bleeding the most cash. It's all about balance - you don't want to optimize one thing and accidentally break something else.
Honestly, tracking your net working capital is like having a crystal ball for cash flow. You'll see how much money gets stuck in daily operations - receivables, inventory, payables. The patterns are pretty predictable once you start watching. Say your inventory always jumps before busy season - boom, you know cash will be tight then. I always tell people to play around with different scenarios too. What if customers pay slower? What if suppliers want faster payment? Once you factor these swings into your projections, you won't get blindsided by cash crunches.
So basically, if your net working capital ratio is always low, you're gonna have trouble paying bills when stuff comes up unexpectedly. But here's the weird part - super high ratios can actually bite you too. You're either sitting on too much cash doing nothing or your customers are taking forever to pay you back (which honestly drives me crazy). Industry matters a lot here. You want enough breathing room without parking money where it's not working for you. I'd check what your competitors are doing and watch your trends over a few quarters to see if you're in a good spot.
Think of benchmarks as your sanity check for working capital stuff. Your numbers might look decent until you see competitors collecting receivables in 30 days while you're sitting at 60. That's a problem. Pull industry medians quarterly and compare your cash cycle, inventory turns, all that. Honestly, I've seen companies think they're crushing it when they're actually way behind their sector. Flag anything drifting 10-15% from industry norms - those gaps add up fast. You can't evaluate this stuff in a vacuum or you'll miss obvious red flags.
Dude, insufficient working capital is basically a slow-motion disaster. You can't pay suppliers on time, which pisses them off and kills any early payment discounts. Growth opportunities? Forget it - you're too broke to stock up or handle bigger orders. It's honestly like running a business with one lung. Emergency loans become your only option, but those come with brutal interest rates. Oh, and the stress will probably give you gray hair (speaking from experience lol). Try to keep 3-6 months of expenses saved up as a cushion.
Honestly, just get yourself some kind of system that tracks this stuff automatically - QuickBooks or NetSuite work great. Excel with Power BI is solid too if you're on a budget. The real game-changer is setting up alerts when things go sideways, like when customers take forever to pay (over 45 days) or inventory just sits there. I'd focus on cash conversion cycle and receivables aging first - those'll tell you the most. Way better than waiting around for monthly reports that are already outdated. Figure out what metrics actually matter for your business, then let the software do the heavy lifting.
Look, AR aging is your heads-up for cash flow disasters waiting to happen. Shows you exactly which customers are being slowpokes with payments and how much money you've got stuck in overdue bills. The longer those invoices sit there, the worse your chances of actually collecting - which kills your working capital since that cash just... isn't coming. Honestly reminds me of watching money drain from a leaky bucket. Use the report to chase down payments, make stricter terms for the problem customers, and get a real picture of your cash situation.
No Reviews