


New product analysis powerpoint presentation slides





Try Before you Buy Download Free Sample Product
 Impress Your
 Audience
 100%
100% Editable
 Save Hours
 of Time


Presenting new product analysis PowerPoint presentation slides to entice more customers. These PPT designs will help you to execute a business analysis, guiding you to determine the costs involved in your proposed new product development, and determine the profits you may make from the product in future economic years. These slides include topics, product analysis example, new product portfolio management, strategic opportunity matrix, detailed analysis, product performance which included size, cost, aesthetics, safety manufacture function, client-focused approach. Various flat designs, circular designs, one stage processes are included here and further elaboration on Porter's five forces model can be demonstrated. We have conceptualized bar graphs and charts in the presentation slides for a detailed study. The costs of expanding a product are substantial and we have kept a comprehensive approach to cover up the most. Decisive step left here is to download these alluring new product PPT templates and taking your experience to a new level. Download to get started now. Companies introduce new products and services to attract more and more customers. To survive the competition, it becomes necessary to fulfil the customers requirements. Hence comes the new product development and its analysis. We bring you the professionally designed new product analysis PowerPoint presentation to help you navigate the path to introduce the new product in the market. This readymade new product analysis PPT templates will help you conduct a product analysis, detailed analysis, category analysis and more. It covers various areas of product development analysis such as product performance, product portfolio management, strategic opportunity matrix and so on. These professional PPT slides will make sure that the newly developed product is safe and works effectively. Conduct a market testing using new product analysis presentation slides. It will help you evaluate consumer’s reaction on the product before making a large investment in the market. To conclude, we must say that this new product analysis complete deck is a useful presentation to completely analyse the newly developed product. Get your hands on this professionally designed PPT to make sure you attract the customers with your new product. Encourage folks to express inner joy with our New Product Analysis Powerpoint Presentation Slides. It helps begin the jubilation.
People who downloaded this PowerPoint presentation also viewed the following :
Content of this Powerpoint Presentation
Slide 1: This slide introduces New Product Analysis. State Your Company Name and get started.
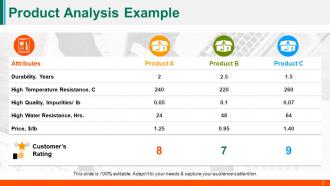
Slide 2: This slide showcases Product Analysis Example in tabular form for Customer’s Ratings and attributes.
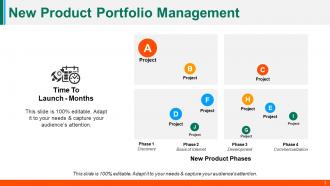
Slide 3: This slide presents New Product Portfolio Management matrix diagram with the following points- Discovery, Basis of Internet, Development, Commercialization, Launch - Months.
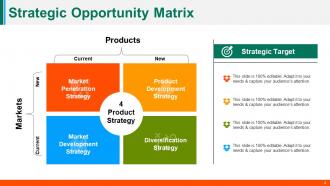
Slide 4: This slide displays a Strategic Opportunity Matrix with the following points- Market Penetration Strategy, Product Development Strategy, Market Development Strategy, Diversification Strategy, Product Strategy, Strategic Target.
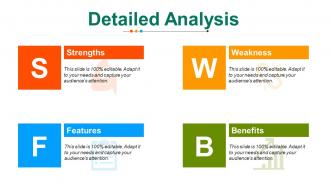
Slide 5: This slide presents a Detailed Analysis featuring- Strengths, Features, Benefits, Weakness.
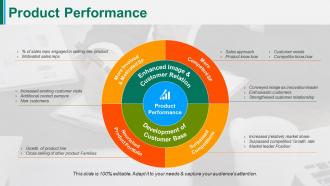
Slide 6: This slide showcases Product Performance with the following points- % of sales reps engaged in selling new product, Motivated sales reps, Conveyed image as innovation leader, Enthusiastic customers, Strengthened customer relationship, Sales approach, Product know-how, Customer needs, Competitor know-how, Growth of product line, Cross selling of other product Families, Increased (relative) market share, Surpassed competitors' Growth rate, Market leader Position, Increased existing customer visits, Additional contact persons, New customers, Product Performance, Enhanced Image & Customer Relation, More Involved & Motivated SF, Surpassed Competitions, More Competent SF, Nourished Product Portfolio, Development of Customer Base.
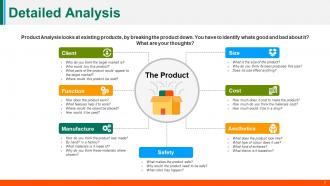
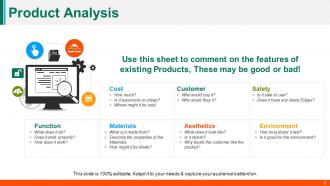
Slide 7: This slide presents a Detailed Analysis with the following subheadings- Product Analysis looks at existing products, by breaking the product down. Safety (What makes the product safe? Why would the product need to be safe? What risks may happen?) Client (Who do you think the target market is? Who would buy this product? What parts of the product would appeal to the target market? Where would this product be sold?) Cost (How much does it cost to make the product? How much do you think the materials cost? How much would it be in a shop?) Manufacture (How do you think the product was made? By hand? In a factory? What materials is it made of? Why do you think these materials where chosen?) Aesthetics (What does the product look like? What type of colour does it use? What kind of surfaces? What theme is it based on?) Function (How does the product work? What features help it to work? Where would the object be placed?)
Slide 8: This slide also shows Product Analysis. Use this sheet slide to comment on the features of existing Products.
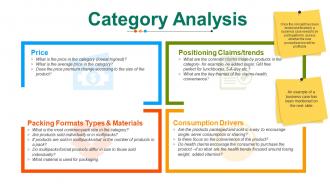
Slide 9: This slide showcases Category Analysis for- Consumption Drivers (Are the products packaged and sold in a way to encourage single- serve consumption or sharing? Is there focus on the convenience of the product? Do health claims encourage the consumer to purchase the product –if so what are the health trends focused around losing weight, added vitamins?) Price (What is the price in the category (lowest-highest)? What is the average price in the category? Does the price premium change according to the size of the product?) Positioning Claims/trends (What are the common claims made by products in the category- for example, no added sugar, GM free perfect for lunchboxes, 5-A-day etc.? What are the key themes of the claims-health, convenience? Once the concept has been tested and finalized, a business case needs to be put together to assess whether the new product/service will be profitable An example of a business case has been mentioned on the next slide). Packing Formats Types & Materials (What is the most common pack size in the category? Are products sold individually or in multipacks? If products are sold in multipacks what is the number of products in a pack? Do multipacks format products differ in size to those sold individually? What material is used for packaging).
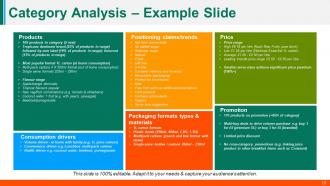
Slide 10: This slide presents Category Analysis – Example Slide for- Products, Consumption drivers, Positioning claims/trends, Price, Promotion, Packaging fomat types & materials.
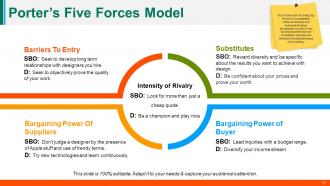
Slide 11: This slide presents Porter’s Five Forces Model with the following subheading- Barriers To Entry, Substitutes, Bargaining Power Of Suppliers, Bargaining Power of Buyer, Intensity of Rivalry. Its a framework for analyzing the level of competition within an industry and business strategy development to derive five forces that determine the competitive intensity and therefore the attractiveness of an industry.
Slide 12: This is a New Product Analysis Icon Slide. Use the icons as per need.
Slide 13: This is a Coffee Break image slide to halt. You can change the slide content as per need.
Slide 14: This slide is titled Chats & Graphs to move forward. You can change the slide content as per need.
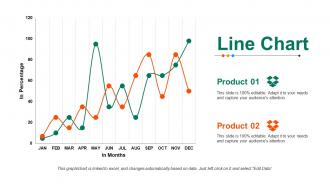
Slide 15: This is a Line Chart to show product/entity comparison, information etc.
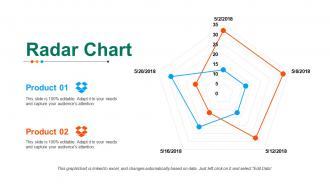
Slide 16: This is a Radar Chart to show product/entity comparison, information etc.
Slide 17: This slide is titled Additional Slides to proceed forward. You can change the slide content as per need.
Slide 18: This is Our Mission slide with Vision, Mission, and Goals. State them here.
Slide 19: This is Our Team slide to present team specifications with name, deisgnation with image boxes.
Slide 20: This is an About us slide to show company/team specifications.
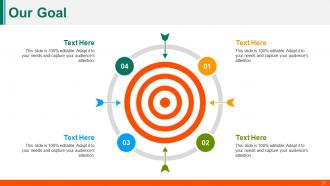
Slide 21: This is Our Goal slide. State company/team/project etc. goals here.
Slide 22: This is a Bulb Or Idea image slide. State ideas, innovative aspects etc. here.
Slide 23: This is a Thank You slide with Address# street number, city, state, Contact Numbers, Email Address.
New product analysis powerpoint presentation slides with all 23 slides:
Get your audience up-to-date. Apprise them with our New Product Analysis Powerpoint Presentation Slides.






FAQs for New product analysis
Honestly? Just figure out what your customers hate about current options and fix that better than everyone else. Could be functionality, user experience, or price - sometimes crushing one area is enough. Skip the fancy features that look good on paper but don't actually matter. Speed and reliability beat flashy stuff almost every time. Map out your top 3 competitors first. See what they're good at. Then find gaps where you can actually beat them in ways people will notice (and pay for). Don't overthink it.
Honestly, just throw all your feedback into one big spreadsheet first - surveys, reviews, support tickets, social media stuff. I know it sounds messy but trust me on this. Group everything by themes like usability issues or feature requests. The trick is counting how often people mention the same problems. Don't get distracted by the one person screaming on Twitter though. Sometimes the quiet patterns matter way more. Oh, and check different user types separately - new users complain about different stuff than power users. Set up monthly reviews so you're not drowning in data, then pick what to fix based on what keeps coming up.
Okay so here's the thing - market segmentation basically gives you x-ray vision into your data. Like instead of just seeing "sales dropped 10%" you'll actually know that millennials are obsessed with your product but Gen X bailed completely. Totally different problems, right? You can catch trends early and figure out which user groups are actually worth your time. Honestly I'd start simple - just break your main metrics into 2-3 segments first. Don't overthink it. Once you see those patterns (and trust me, you will), then you can dig deeper and decide where to double down vs. where to cut your losses.
So basically, people use price as a quick way to judge if something's good or not. Weird psychology thing - expensive usually means quality in their heads. Too cheap though? Makes them think it's sketchy. You gotta make sure your pricing actually matches what you're selling. That anchoring trick works pretty well - show the "was $50, now $30" thing. Oh, and don't confuse people by having fancy branding with bargain prices (or vice versa). They'll just get weirded out and leave. The whole thing needs to make sense together, you know?
Honestly? Start with defect rates and customer satisfaction scores - those are your bread and butter. Mean time to failure matters too, plus keep an eye on return rates and warranty claims since customers voting with their wallets tells you everything. First-pass yield during manufacturing is clutch for catching issues early. For resolution stuff, track how long it takes to fix problems when they come up. Customer reviews are weirdly just as valuable as the hard numbers sometimes - people don't hold back online. Mix your testing data with real user feedback and you'll get the full picture. Pick maybe 3-4 metrics that actually match what you're trying to achieve and stick with tracking them consistently.
Look, consumer trends are basically your crystal ball for what features to build. People's shopping habits change, and you've got to catch those shifts early since product development takes forever. Right now everyone's going crazy for sustainable stuff - honestly, if your product isn't eco-friendly, good luck selling it. I'd set up feedback systems like surveys and social listening to track what's actually happening. Sales data helps too, obviously. The whole point is building what customers will want next year, not what they loved back in 2022. You don't want to be that company launching outdated products.
So for a product SWOT, I'd start by interviewing people on your team - different perspectives will show you blind spots. Customer surveys are honestly where the magic happens though. Competitive analysis is pretty crucial too for spotting what's coming down the pipeline. Just make a basic 2x2 grid and fill it out with everyone together. Sales data and support tickets will give you the real story (way better than guessing). Oh, and don't skip user feedback - that stuff's invaluable. The whole thing only works if you're brutally honest about where you actually stand right now.
Dude, the stage your product's in totally changes what numbers you should even care about. Early on? Don't stress if you're bleeding money - just watch adoption rates and what users are saying. Growth phase is when you're obsessing over market share and scaling without breaking everything. Maturity hits different though - suddenly it's all about keeping customers happy and squeezing better margins since growth slows down naturally. Decline stage is honestly just damage control and deciding if it's time to kill it or try something new. Compare yourself to companies in the same phase, not some unicorn that's three stages ahead.
Look, competitor analysis saves you from building in a bubble. Pick 3-5 direct competitors and check what they're actually doing each month. You'll spot the features they're focusing on, their pricing moves, and - this is the gold - gaps they're totally missing that you could jump on. Honestly, most founders think they know where they stand but have no clue. It's like having answers to the test beforehand (still gotta execute though). The real question is whether you're making something different or just another copy. Trust me, that distinction matters way more than people realize.
Charts and graphs are seriously game-changers for product analysis. Most execs won't even touch spreadsheets anymore - they want the story at a glance. Heat maps work great for user behavior stuff. Comparison charts make competitive positioning super clear. You can also turn boring feature lists into decent infographics, though honestly some people go overboard with those. The trick is figuring out your key insights first, then picking visuals that actually support them. Don't just chart everything because you can. Match your style to who you're presenting to and you'll be golden.
Honestly, emotional appeals are what usually seal the deal. People don't buy stuff just based on specs - they buy how it makes them feel. Confident, excited, part of something cool, whatever. Even boring B2B stuff comes down to trust and whether the buyer feels good about their choice. I mean, look at Apple - half their success is making people feel like they're getting something special. Most winning products nail that emotional connection first, then throw in the logical reasons after. When you're checking out competitors, don't just look at their feature lists. Figure out what feelings they're selling.
Dude, culture totally changes how people react to your product. What crushes it in Silicon Valley? Might flop hard in Tokyo or São Paulo. Look at things like whether cultures value individual success vs group harmony, how they handle risk, power dynamics - all that stuff affects user behavior. Oh and random tip - colors matter way more than you'd think. Red screams "danger" to Americans but means good luck in China. Pretty wild, right? Break down your user data by regions and compare adoption patterns. I bet you'll find some crazy differences you never expected.
So for quantitative stuff, Google Analytics and Mixpanel are solid for tracking user behavior. Amplitude's really good for cohort analysis too. Tableau is amazing for visualization but heads up - the learning curve kinda sucks at first. Power BI's easier to pick up. A/B testing wise, Optimizely and VWO work well. Honestly if budget's tight, just start with GA4 and throw some basic SQL at your database. My advice? Pick one analytics tool and one viz platform first. Don't try learning five things at once or you'll go crazy.
So qualitative insights are basically the "why" behind what users do - stuff your numbers can't tell you. People will complain about weird workarounds or use features in totally unexpected ways. That's honestly the best feedback you can get. Like when someone loves a feature but uses it completely wrong? Perfect - now you know what to fix next. User interviews are great for this, but don't sleep on support tickets either. Even random conversations work. The whole point is understanding the emotions and context behind the data. Map those stories to actual product decisions and you're golden.
Lead with your big insights right away - nobody wants to dig through spreadsheets to find the point. Focus on business impact instead of just rattling off metrics. Visuals are your friend here since people's eyes glaze over with data dumps (learned this the hard way). Connect each finding to actual steps they can take. Oh, and definitely prep for those "but what if" questions they always throw at you - have your methodology ready. The whole point is driving decisions, not just showing off numbers, so wrap up with concrete next steps they can act on.
-
Very unique, user-friendly presentation interface.
-
Innovative and Colorful designs.