

Artificial intelligence and machine learning customer kpi dashboard snapshot




Try Before you Buy Download Free Sample Product
 Impress Your
 Audience
 100%
100% Editable
 Save Hours
 of Time


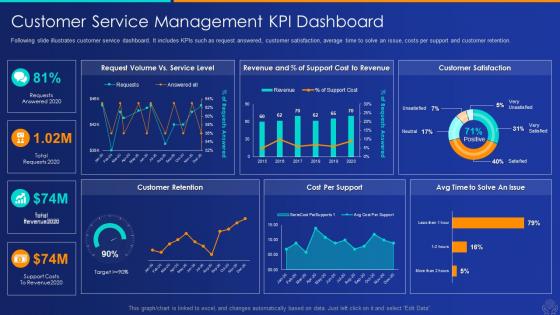
Following slide illustrates customer service dashboard. It includes KPIs such as request answered, customer satisfaction, average time to solve an issue, costs per support and customer retention.
People who downloaded this PowerPoint presentation also viewed the following :
Artificial intelligence and machine learning customer kpi dashboard snapshot with all 7 slides:
Use our Artificial Intelligence And Machine Learning Customer KPI Dashboard snapshot to effectively help you save your valuable time. They are readymade to fit into any presentation structure.





FAQs for Artificial intelligence and machine learning customer
Start with model accuracy, precision, recall, and F1-score - those are your bread and butter. Data drift detection is huge too, plus prediction latency and throughput since slow models piss off users. Honestly though? Business folks care way more about conversion rates and cost savings than your fancy confusion matrices. Track training time and resource usage as well. Monitor how different model versions perform over time - that's saved my ass more than once. I'd say pick 5-6 metrics that actually matter for your specific case, then add more later.
First thing - figure out which KPIs actually matter in your field. Finance cares about fraud detection rates, healthcare wants diagnostic accuracy, that sort of thing. Map your AI outputs to business results that executives give a damn about. So many dashboards look slick but nobody uses them! Retail should track customer lifetime value predictions, manufacturing needs predictive maintenance alerts. Healthcare obviously wants patient risk scores. Then adjust your visuals and alerts to match how your industry actually works. Honestly, I'd start small - maybe 3-5 metrics that directly impact revenue or risk. You can always add more later.
Ugh, the biggest pain is when stakeholders want everything dumbed down to basic bar charts, but your ML metrics are way more complex than that. Precision/recall curves and confusion matrices need special visualizations that most dashboard tools just can't handle well. You're stuck translating technical stuff for data scientists while also making executive summaries that actually make sense. Real-time pipelines break constantly too, so your dashboards end up showing old data. Honestly? Figure out what decisions your audience needs to make first, then work backwards to the KPIs that matter. Saves so much headache later.
Real-time data makes the difference between a useful dashboard and eye candy. Your models are constantly changing - performance shifts, data drifts, accuracy fluctuates. Without live feeds, you're reacting to yesterday's problems while new ones pile up. It's like checking last week's weather forecast, honestly pretty useless. But with real-time integration? You'll spot issues as they happen and actually fix them before they mess up your results. I'd start with your most important model outputs first, then add the other metrics later. Way more manageable that way.
UX is huge for ML dashboards - if people can't understand what they're looking at, they just won't use it. I've literally watched executives ignore dashboards because they were too cluttered or confusing. Clean visuals are key, plus navigation that actually makes sense. You want users to easily go from big-picture metrics down to specific model stuff. Oh, and tailor the detail level for different audiences - data scientists need way more info than C-suite folks. Honestly though? Test it with real users super early. What seems obvious to you will probably confuse the hell out of them.
So basically, dashboards help you catch bias by showing how your model performs across different groups - like if it's tanking for certain demographics. Track fairness stuff like demographic parity alongside your normal accuracy metrics. Honestly, most teams I know wish they'd started this earlier instead of dealing with it later when things got messy. The cool part? You can set alerts when bias gets too high and actually A/B test fixes in real-time. Oh, and definitely automate the monitoring - manually checking this stuff gets old fast.
Start with the obvious ones - accuracy, precision, recall, F1-score. But honestly? Which metrics actually matter depends totally on what you're building. Like if false positives are expensive, precision becomes your best friend. Watch prediction confidence scores too, and definitely track feature drift - models love to quietly break over time. Oh, and don't get so obsessed with model performance that you forget the business side. I've seen "perfect" models that didn't move the needle at all. Begin with these basics, then add whatever's specific to your situation.
So basically you want KPIs that actually connect to real business stuff - revenue bumps, cutting costs, making things run smoother, happier customers. Track the early signals like model accuracy and how fast you're deploying, plus the bigger picture financial stuff later. ROI is honestly a pain to figure out at first, but whatever. Just grab your baseline numbers before you launch anything, then measure the same things after. Set up some dashboards that update automatically so you're not frantically pulling data when your boss asks. Oh and don't go crazy - pick like 3-5 key metrics instead of tracking every little thing.
Honestly, if your team's already comfortable with Tableau or Power BI, just stick with those. But specialized tools are way better for ML stuff - MLflow's perfect for tracking experiments, and Weights & Biases is clutch for monitoring models. Grafana + Prometheus works amazingly well if you're dealing with infrastructure metrics (though it's a bit more technical). Oh, and Streamlit or Plotly Dash are super quick for custom dashboards. The main thing is picking something that doesn't force your data scientists to learn a whole new system from scratch.
So basically you'd add forecasting models to your dashboards that predict stuff based on what happened before. Like instead of just seeing last quarter's sales, you'd see where sales are probably heading next quarter. The ML models spot patterns and spit out predictions - sales forecasts, who might churn, inventory needs, whatever. Honestly it's pretty sweet for planning ahead. Just make sure you show confidence intervals with the predictions so people know it's not gospel truth. Oh and don't go crazy - pick one or two metrics you actually need forecasted regularly to start with.
Your ML metrics are worthless if the data's garbage - I learned this the hard way watching a team throw a party over fake improvements that were just messy data artifacts. Incomplete or biased datasets will totally mislead you about how your models are actually doing. You'll miss real problems like drift or chase phantom issues that don't even exist. Before calculating any KPIs, set up validation checks for data completeness and consistency. Also monitor freshness - stale data kills everything. Trust me, stakeholders aren't happy when they find out your "wins" were just data problems.
Start with modular components and flexible data pipelines - seriously, you'll thank me later. Containerized services are your friend here, along with cloud-native tools for easy scaling. Store your KPI definitions as config files instead of hardcoding them (I learned this the hard way). Automated testing for dashboard components is non-negotiable. Oh, and that whole "build everything at once" mentality? Don't. Begin with your core metrics, then expand based on what people actually click on. I've watched too many teams get stuck with rigid setups that become impossible to change.
Put your biggest metrics right up top where people can't miss them. Group related stuff together and use the same scales on similar charts - makes comparing way easier. Progressive disclosure works great here, so people can dive deeper if they want without getting hit with everything at once. Color coding helps but honestly, I've seen people go overboard and it just looks messy. Don't forget context though - baselines, targets, time ranges. Numbers by themselves don't tell you much. Oh, and definitely test it with real users first. You'll catch things you never thought of.
So connecting your AI dashboard to project management tools is a game changer - it stops being just another static report and becomes like mission control for your projects. You'll see how your ML models are actually performing against real timelines and budgets without juggling a million browser tabs (which honestly saves my sanity). The dashboard pulls in task completion rates, resource allocation, deadline data - then matches it up with your model accuracy and training costs. Pretty much gives you the full picture of whether your AI projects are worth the investment and staying on track. Just hook it up to whatever PM tool you're already using.
Don't just build a dashboard and hope they'll love it - that's a recipe for disaster. Get your stakeholders in a room first to figure out what actually matters to them. Run workshops where they define success for their specific goals. I can't tell you how many gorgeous dashboards I've seen collecting dust because they measured the wrong stuff. Connect your KPIs to things they already obsess over - revenue, costs, customer happiness, whatever's driving them crazy. Oh, and check in regularly since priorities change faster than you'd think.
-
Enough space for editing and adding your own content.
-
Very unique and reliable designs.