


Par powerpoint presentation slides





Try Before you Buy Download Free Sample Product
 Impress Your
 Audience
 100%
100% Editable
 Save Hours
 of Time


Introducing PAR PowerPoint Presentation Slides. The agenda of this presentation is to provide key business highlights to stakeholders and provide an overview of the organization. Analyze what projects the company will undertake in the future with the help of performance and accountability reporting PPT slideshow. Showcase vision, mission, goal, future projects, and past performance of the company with the help of our readily available PPT visuals. The presentation also shows key performance indicators that help to measure the performance of the company. It also presents major strategic goals for the year 2019-2020. It also shows the challenges that organizations faced while implementing various strategies. Evaluate the financial performance of the company with the help of the score PPT graphics. Display income statements and balance sheets with these ready-to-use PowerPoint layouts. After that, it depicts customer acquisition costs. Give an overview of various channels utilized by organizations to spread awareness among customers. Showcase communication channels, corporate social responsibility, etc by incorporating this professionally designed business and finance PPT presentation.
People who downloaded this PowerPoint presentation also viewed the following :
Content of this Powerpoint Presentation
Slide 1: This slide introduces PAR. State Your Company Name and get started.
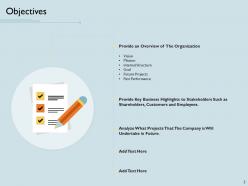
Slide 2: This slide displays Objectives and provides an overview of the organization, key business highlights, and analyzes the company's future undertakes.
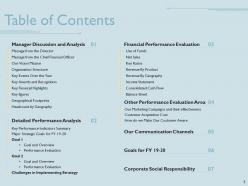
Slide 3: This slide displays Table of Contents, i.e., manager discussion analysis, detailed performance analysis, financial performance evaluation, communication channels, goals for FY, and corporate social responsibility.
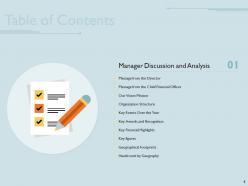
Slide 4: This slide displays Table of Content with emphasis on manager discussion and analysis.
Slide 5: The following slide provides an overview of the directors' message that briefly introduces the clients of the annual performance and accountability report and an annual timeline that highlights key events that have taken place in the year.
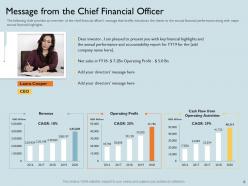
Slide 6: The following slide provides an overview of the chief financial officer's message that briefly introduces the clients to the annual financial performance along with major annual financial highlights.
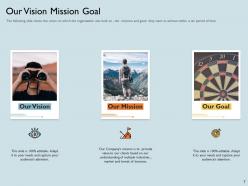
Slide 7: The following slide shows the organization's vision, its missions, goals, and what they want to achieve within a set period of time.
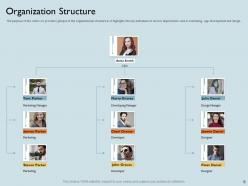
Slide 8: The purpose of this slide is to provide a glimpse of the organizational structure, and it highlights the key individuals of various departments such as marketing, app development, and design.
Slide 9: The following slide displays a monthly timeline from January to December and highlights the key events over the following year.
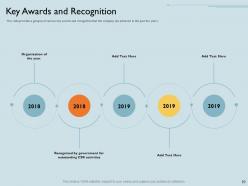
Slide 10: This slide displays Key Awards and Recognition.
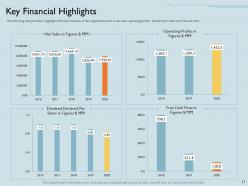
Slide 11: The following slide highlights the organization's key financials, such as net sales, operating profits, dividend per share, and free cash flow.
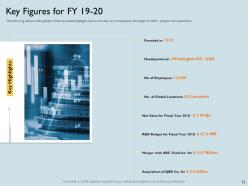
Slide 12: The following slide provides a glimpse of the key annual highlights such as net sales, no employees, the budget for R&D, mergers, and acquisitions.
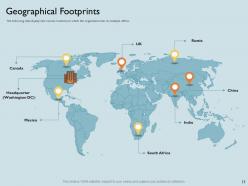
Slide 13: The following slide displays the various locations in which the organization has multiple offices that are the 'geographical footprints.'
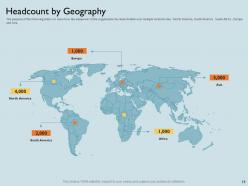
Slide 14: The purpose of the following slide titled headcount by geography is to show how the organization's human resources have been divided over multiple locations like - North America, South America , South Africa, Europe, and Asia.
Slide 15: This slide displays Table of Content with a focus on detailed performance analysis.
Slide 16: The purpose of this slide is to provide an overview of various KPIs for multiple strategic goals that the organization was willing to achieve in FY18-19. The provided table shows the company's goal, the target, and the actual figures that the organization was able to achieve.
Slide 17: The purpose of this slide is to provide an overview of the major goals that the company is willing to achieve in an FY.
Slide 18: The following slide highlights the goal and objectives of the organization that they wanted to achieve in the past year, such as Building Capacity, training the recruits, and increase productivity.
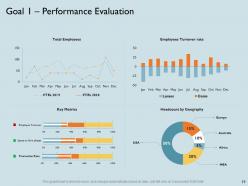
Slide 19: This slide displays Goal 1: Performance Evaluation of the organization.
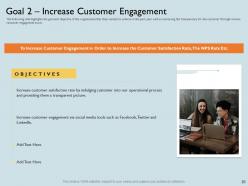
Slide 20: The following slide highlights the goal and objective of the organization that they wanted to achieve in the past year, such as increasing the transparency for the customer through various customer engagement tools.
Slide 21: This slide introduces Goal 2 of the company, i.e., Performance Evaluation.
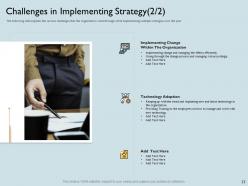
Slide 22: The following slide explains the various challenges that the organization went through while implementing multiple strategies over the year.
Slide 23: The following slide explains the various challenges that the organization went through while implementing multiple strategies over the year.
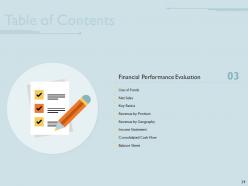
Slide 24: This slide displays Table of Content with emphasis on financial performance evaluation.
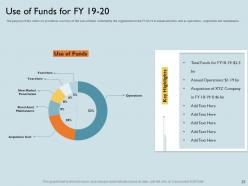
Slide 25: The purpose of this slide is to provide an overview of the uses of funds collected by the organization in the FY for annual activities such as operations, acquisition, and maintenance.
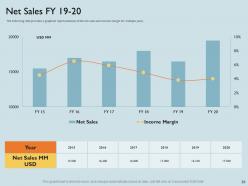
Slide 26: The following slide provides a graphical representation of the net sales and income margin for multiple years.
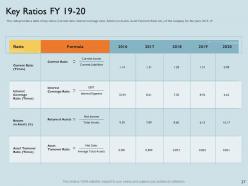
Slide 27: This slide provides a table of key ratios that includes the Current ratio, interest coverage ratio, Return on Assets, Asset Turnover Ratio, etc., of the company for targetted years.
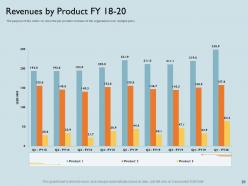
Slide 28: The purpose of this slide is to show the per-product revenues of the organization over multiple years.
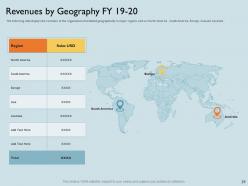
Slide 29: The following slide displays the revenues of the organization distributed geographically in major regions such as North America, South America, Europe, Asia, and Australia.
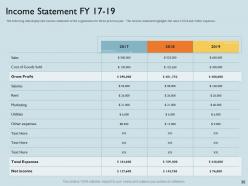
Slide 30: The following slide displays the income statement of the organization for the previous years. The Income statement highlights the sales COGS and Other expenses.
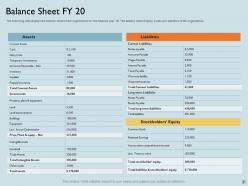
Slide 31: The following slide displays the balance sheet of the organization for the financial years. In addition, the balance sheet displays the assets and liabilities of the organization.
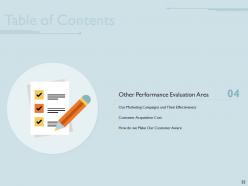
Slide 32: This slide displays Table of Content with emphasis on other performance evaluation areas.
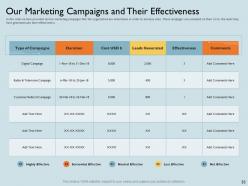
Slide 33: In this slide, we have provided various marketing campaigns that the organization has undertaken to increase sales. These campaigns are evaluated on their costs, the leads they have generated, and their effectiveness.
Slide 34: The following slide provides the breakdown of the Customer Acquisition cost and various variables that contribute to it.
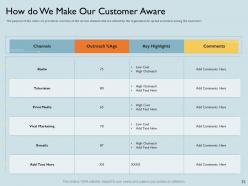
Slide 35: This slide aims to provide an overview of the various channels that the organization utilizes to spread awareness among the customers.
Slide 36: This slide displays the Table of Contents, focusing on communication channels, goals for the financial year, and corporate social responsibility.
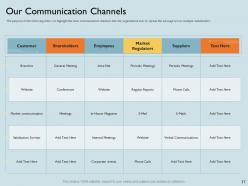
Slide 37: The following slide aims to highlight the main communication channels that the organization uses to spread the message across multiple stakeholders.
Slide 38: The purpose of this slide is to provide an overview of the goals that the organization wants to achieve in the financial year. The provided table highlights the description, date of execution, and name of the individual accountable for achieving them.
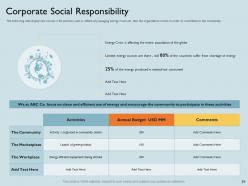
Slide 39: The following slide displays the various CSR activities, such as effectively managing energy crises, which the organization will contribute to the community.
Slide 40: This slide displays the Icons Slide for PAR.
Slide 41: This slide is titled as Additional Slides.
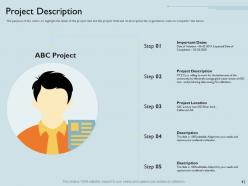
Slide 42: This slide aims to highlight the detail of the project that, like the project title and its description, the organization wants to complete in the future.
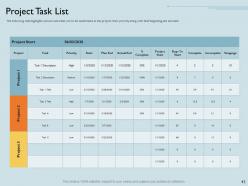
Slide 43: The following slide highlights various tasks that are to be undertaken in the project, their priority, and thief beginning and end date.
Slide 44: The following slide highlights the type of risk, its description, the expectation of its occurrence, and its impact on the organization.
Slide 45: The purpose of this slide is to display a monthly project timeline along with key milestones that will be achieved in the process.
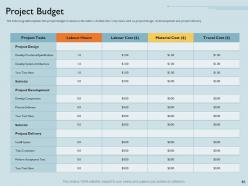
Slide 46: The following table explains the project budget in detail as the table is divided into 3 key tasks: project design, development, and project delivery.
Slide 47: This is the About us slide to provide Company's specifications.
Slide 48: This slide is titled Post It to attach the key information in an attractive yet informative manner.
Slide 49: This slide displays the various locations where the company operates from.
Slide 50: This slide introduces the company team in an organized manner.
Slide 51: This is the Thank you slide with Contact details.
Par powerpoint presentation slides with all 51 slides:
Use our PAR Powerpoint Presentation Slides to effectively help you save your valuable time. They are readymade to fit into any presentation structure.
















FAQs for Par
Captivating PowerPoint presentations include clear messaging, compelling visuals, consistent design themes, strategic data visualization, and engaging storytelling structures. These elements work together by maintaining audience attention, reinforcing key messages, and facilitating better information retention, with many organizations finding that well-designed presentations significantly enhance client engagement and decision-making outcomes.
**INPUT**: How can you effectively use visuals to enhance your PowerPoint slides? **OUTPUT**: Effective PowerPoint visuals enhance presentations through high-quality images, relevant charts, consistent color schemes, strategic white space, and professional icons that support your narrative. These visual elements streamline complex information delivery by increasing audience engagement, improving message retention, and creating memorable experiences, with many organizations finding that well-designed slides ultimately deliver stronger business outcomes and competitive presentation advantage. **Word count: 58 words**
PowerPoint offers deeper Microsoft Office integration, extensive template libraries, advanced animation capabilities, and robust collaboration features compared to alternatives like Google Slides or Keynote. While Google Slides excels in real-time collaboration and Keynote delivers superior visual aesthetics, PowerPoint's comprehensive feature set, widespread compatibility, and seamless workflow integration make it the preferred choice for most business environments seeking scalable presentation solutions.
Storytelling transforms PowerPoint presentations by incorporating narrative arcs, emotional connections, character development, conflict resolution, and visual metaphors throughout slides. These elements engage audiences through relatable scenarios, compelling case studies, and progressive disclosure techniques, with many organizations finding that story-driven presentations increase retention rates, enhance audience engagement, and ultimately deliver more persuasive business outcomes.
Engagement techniques include interactive polls, storytelling elements, strategic pauses, visual variety, and audience participation opportunities. These methods enhance presentations by maintaining attention spans, encouraging active listening, and creating memorable experiences, with many presenters finding that combining multimedia elements, asking thoughtful questions, and incorporating real-world examples ultimately delivers stronger audience connection and improved message retention.
Template designs significantly influence audience perception by establishing credibility, professionalism, and visual hierarchy that guides attention and comprehension. Well-designed templates enhance content absorption through consistent formatting, strategic color usage, and clear typography, while poor designs can distract from key messages, ultimately determining whether audiences view presentations as authoritative and trustworthy or unprofessional.
Common PowerPoint mistakes include overloading slides with text, using inconsistent fonts and colors, relying on distracting animations, poor image quality, and lack of clear structure. These presentation pitfalls undermine audience engagement and message clarity, with many organizations finding that streamlined design, consistent branding, and focused content ultimately deliver stronger communication outcomes and more persuasive business presentations.
Animations and transitions enhance PowerPoint presentations by directing audience attention, emphasizing key points, creating visual flow between ideas, and maintaining engagement through dynamic content delivery. However, excessive or inappropriate animations can distract from the message, appear unprofessional, and overwhelm viewers, with many presenters finding that subtle, purposeful animations ultimately deliver greater impact than elaborate effects.
Color theory guides PowerPoint template selection by considering psychological impact, brand alignment, audience demographics, readability requirements, and cultural associations. These principles help presenters choose templates that enhance message comprehension, maintain visual hierarchy, and create emotional connections with viewers, with many organizations finding that strategic color choices significantly improve audience engagement and presentation effectiveness.
PowerPoint accessibility involves using high-contrast colors, adding alt text to images, implementing proper heading structures, ensuring readable fonts, and including captions for multimedia content. These design principles streamline content consumption for diverse audiences, with many organizations finding that accessible presentations ultimately deliver broader engagement, improved compliance with accessibility standards, and enhanced professional credibility across all stakeholder interactions.
Best practices for citing sources in PowerPoint include using consistent citation styles, placing references on relevant slides, creating a dedicated references slide, using footnotes for multiple sources, and ensuring readability with appropriate font sizes. These approaches enhance credibility by maintaining academic standards, supporting claims with authoritative sources, and enabling audiences to verify information, with many organizations finding that proper attribution ultimately strengthens presentation impact and professional reputation.
Adapting PowerPoint templates involves modifying color schemes, fonts, and layouts to match audience preferences, adjusting content complexity and tone for expertise levels, and incorporating relevant industry examples or case studies. Organizations streamline this process by creating template variants for different stakeholders, with many finding that audience-specific customization significantly enhances engagement and message effectiveness across diverse business contexts.
PowerPoint's design-streamlining features include Designer AI suggestions, Slide Master templates, Quick Styles formatting, Smart Guides alignment tools, and Format Painter consistency options. These capabilities enhance workflow efficiency by automating layout decisions, standardizing brand elements, and reducing manual formatting time, with many organizations finding that strategic template development ultimately delivers faster presentation creation and improved visual consistency across teams.
Peer feedback improves PowerPoint presentations by identifying unclear content, suggesting design enhancements, and highlighting audience engagement opportunities through fresh perspectives. Through collaborative review processes, presenters can refine messaging clarity, optimize visual flow, and strengthen persuasive elements, with many organizations finding that peer input significantly enhances presentation impact and professional credibility.
Current trends shaping PowerPoint's future include AI-powered design automation, interactive multimedia integration, real-time collaborative editing, data visualization enhancements, and mobile-optimized formats. These developments streamline presentation creation while enabling dynamic storytelling through embedded videos, live polls, and animated infographics, with organizations finding that interactive presentations significantly boost audience engagement and retention rates.
-
Informative presentations that are easily editable.
-
Great designs, Easily Editable.
-
Excellent products for quick understanding.
-
Best way of representation of the topic.
-
Top Quality presentations that are easily editable.
-
Unique design & color.
-
Editable templates with innovative design and color combination.
-
Easily Understandable slides.