


Portfolio Analysis Powerpoint Presentation Slides


Try Before you Buy Download Free Sample Product
 Impress Your
 Audience
Editable
of Time


Examine the components of investment management with our content ready Portfolio Analysis Powerpoint Presentation Slides. The topic-specific investment strategies PowerPoint complete deck has various content ready PPT slides such as introduction to investments, objectives of portfolio management, types of investment, market scenario overview investment instruments, securities portfolio, analysis and valuation of equity securities, industry analysis PESTEL, SWOT analysis, discounted cash flow method, financial statement analysis, company cash flow statement, investment in special situations, fixed income and leveraged securities, bond valuation system, reinvestment risk table, type of convertible securities, options analysis, warrants summarization overview, derivative products, put and call options, stock index futures and options, stock indexes comparison table, broaden the investment perspective, international security market highlights, global market trends, mutual funds investment criteria overview, investment in real estate, diversified real estate classification, KPIs and dashboards, etc. Download this visually appealing easy to use financial management PPT slide to showcase factors of investing. Bedeck your ideas with our Portfolio Analysis Powerpoint Presentation Slides. Your audience will get glued onto them.
People who downloaded this PowerPoint presentation also viewed the following :
Content of this Powerpoint Presentation
Slide 1: This slide introduces Portfolio Analysis. State Your Company Name and begin.
Slide 2: This is an Agenda slide. State your agendas here.
Slide 3: This slide shows Table of Content for the presentation.
Slide 4: This slide presents Introduction to Investments describing- Objectives of Portfolio Management, Investment Instruments, Types of Investment, Market Scenario Overview.
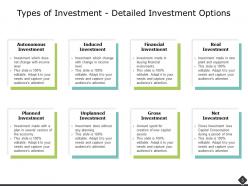
Slide 5: This slide represents Types of Investment - Detailed Investment Options describing- Autonomous Investment, Induced Investment, Financial Investment, Real Investment, Planned Investment, Unplanned Investment, Gross Investment, Net Investment.
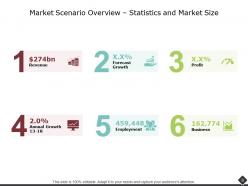
Slide 6: This slide showcases Market Scenario Overview - Statistics and Market Size describing- Revenue, Annual Growth 13-18, Forecast Growth, Profit, Employment, Business.
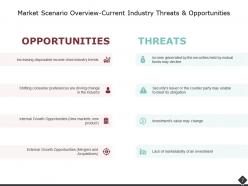
Slide 7: This slide shows Market Scenario Overview - Current Industry Threats & Opportunities with related text to elaborate.
Slide 8: This slide presents Investment Instruments which includes- Stock, Annuities, Bond, Cash, Real Estate, Mutual Funds, Domestic, Hedge Funds, ETF’s, Emerging Markets, Foreign Options.
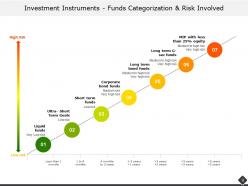
Slide 9: This slide displays Investment Instruments - Funds Categorization and Risk Involved as- Liquid funds, Ultra - short term funds, Short term funds, Corporate bond funds, Long term bond funds, Long term G-sec funds, MIP with less than 25% equity.
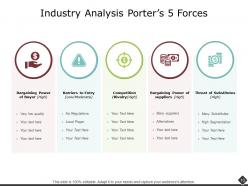
Slide 10: This slide shows Industry Analysis - Porter’s 5 Forces as- Competition/Rivalry, Bargaining Power -Suppliers, Barriers To Entry, Threat of Substitutes, Bargaining Power Buyers.
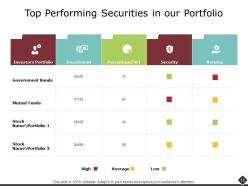
Slide 11: This slide represents Top Performing Securities in Our Portfolio with categories as- Investor’s Portfolio, Investment, Percentage, Security, Returns.
Slide 12: This slide showcases Analysis and Valuation of Equity Securities describing- Industry Analysis, Financial Statement Analysis, Valuation of Equity Securities.
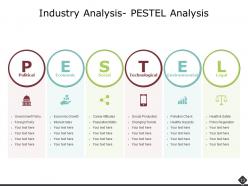
Slide 13: This slide presents Industry Analysis - PESTEL Analysis which include Political, Economic, Social, Technological, Environment and Legal analysis.
Slide 14: This slide displays Industry Analysis - SWOT Analysis as- Strengths, Weaknesses, Opportunities and Threats analysis.
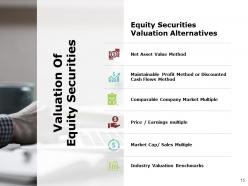
Slide 15: This slide represents Valuation of Equity Securities describing- Net Asset Value Method, Maintainable Profit Method or Discounted Cash Flows Method, Comparable Company Market Multiple, Price / Earnings multiple, Market Cap/ Sales Multiple, Industry Valuation Benchmarks.
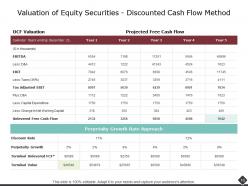
Slide 16: This slide showcases Valuation of Equity Securities - Discounted Cash Flow Method describing- DCF Valuation, Projected Free Cash Flow, Perpetuity Growth Rate Approach.
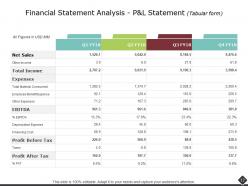
Slide 17: This slide shows Financial Statement Analysis - P&I Statement in Tabular form with net sales, total income, total expenses, profit before and after tax etc.
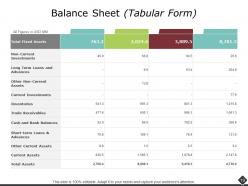
Slide 18: This slide presents Balance Sheet in Tabular form with total liabilities.
Slide 19: This slide presents Balance Sheet in Tabular form with total assets.
Slide 20: This slide displays Company Cash Flow Statement in Tabular form describing- Cash flow from operations, cash flow from investing activities, cash flow from financing activities, change in cash and cash equivalents etc.
Slide 21: This slide represents Issues in Efficient Markets describing- Major Efficient Market Issues, Investments in Special Situation, Basic View of Technical Analysis.
Slide 22: This slide showcases Major Efficient Market Issues as- Transactions Cost related to exchange of goods and services overcome market imperfections, Regulatory Restrictions that are subject to control and guidelines for efficient market etc.
Slide 23: This slide shows Technical Analysis Types with chart patterns, technical indicators and key result areas.
Slide 24: This slide presents Investments in Special Situations with icons and text boxes to show information.
Slide 25: This slide displays Fixed-Income and Leveraged Securities describing- Bond and Fixed-Income Securities, Convertible Securities & Warrants, Duration & Reinvestment, Bond Valuation.
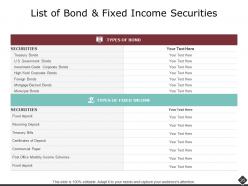
Slide 26: This slide represents List of Bond & Fixed Income Securities in a tabular form with related text.
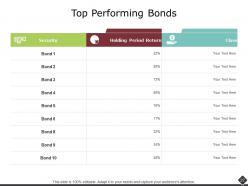
Slide 27: This slide showcases Top Performing Bonds with categories as- Security, Holding Period Returns, Class.
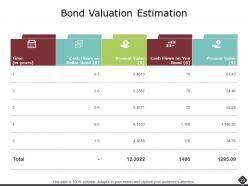
Slide 28: This slide shows Bond Valuation Estimation with categories as- Time, Cash Flows on Dollar Bond, Present Value, Cash Flows on Yen Bond, Present Value.
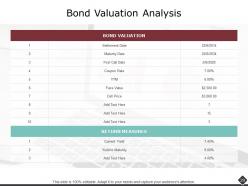
Slide 29: This slide presents Bond Valuation Analysis describing- Bond Valuation and Return Measures.
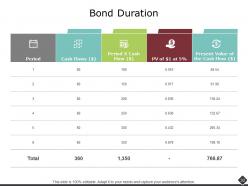
Slide 30: This slide displays Bond Duration with categories as- Period, Cash Flows, Period X Cash Flow, PV of $1 at 5%, Present Value of the Cash Flow.
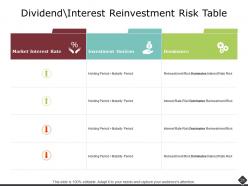
Slide 31: This slide represents Dividend \ Interest Reinvestment Risk Table with categories as- Market Interest Rate, Investment Horizon, Dominance.
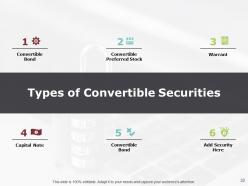
Slide 32: This slide showcases Types of Convertible Securities describing- Convertible Bond, Convertible Preferred Stock, Warrant, Capital Note, Right Issue.
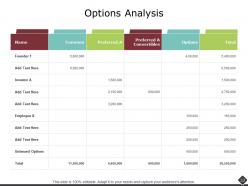
Slide 33: This slide shows Options Analysis in tabular form with related text.
Slide 34: This slide presents Different Warrant Categories as- Detachable Warrant, Wedded Warrant, Naked Warrant, Covered Warrant, Equity Warrant etc.
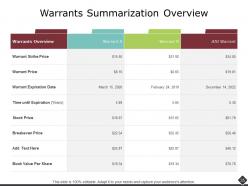
Slide 35: This slide displays Warrants Summarization Overview with warrant price, warrant expiration date, stock price etc.
Slide 36: This slide represents Derivative Products such as- Put and Call Options and Stock Index Futures and Options.
Slide 37: This slide showcases Put and Call Options with categories as Bullish, Neutral, Bearish.
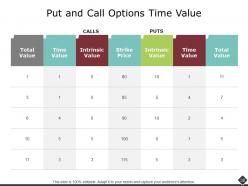
Slide 38: This slide shows Put and Call Options Time Value in tabular form with categories as- Total Value, Time Value, Intrinsic Value, Strike Price, Intrinsic Value, Time Value, Total Value.
Slide 39: This slide presents Stock Index Futures and Options with categories as- Contract, Ticker Symbol, Futures, Options, Globex.
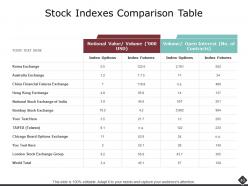
Slide 40: This slide displays Stock Indexes Comparison Table comparing exchanges such as- Korea exchange, Australia exchange, Hong kong stock exchange, bombay stock exchange etc.
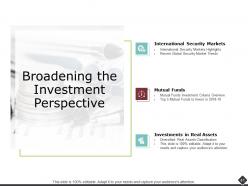
Slide 41: This slide represents Broadening the Investment Perspective describing- International Security Markets, Investments in Real Assets, Mutual Funds.
Slide 42: This slide showcases International Security Market Highlights describing- Market Growth, Market Trend, Market Driver.
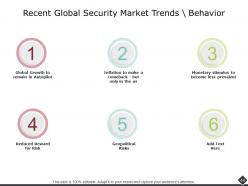
Slide 43: This slide shows Recent Global Security Market Trends\Behavior describing- Inflation to Make a Comeback - But Only in the Us, Global Growth to Remain in Autopilot, Monetary Stimulus To Become Less Prevalent, Reduced Reward for Risk, Geopolitical Risks etc.
Slide 44: This is an optional slide for Recent Global Security Market Trends\Behavior.
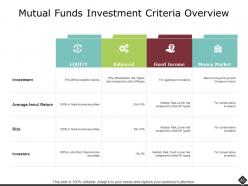
Slide 45: This slide presents Mutual Funds Investment Criteria Overview with parameters as- Equity, Balanced, Fixed Income, Money Market.
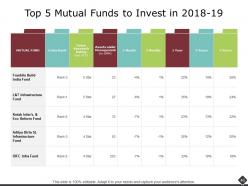
Slide 46: This slide displays Top 5 Mutual Funds to Invest in 2018-19 witch categories as- MUTUAL FUND, Crisil rank, Value research rating, Assets under management etc.
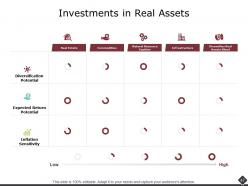
Slide 47: This slide represents Investments in Real Assets such as- Real Estate, Commodities, Natural Resource Equities, Infrastructure, Diversifies Real Assets Blend.
Slide 48: This slide showcases Diversified Real Assets Classification describing- annual returns, Volatility, Shape ratio etc.
Slide 49: This slide shows Risk & Return Analysis in a tabular form with text boxes to show information.
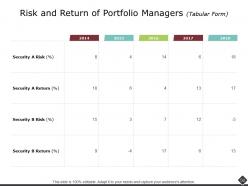
Slide 50: This slide presents Risk and Return of Portfolio Managers in Tabular form with years, security risk, security return etc.
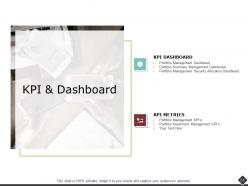
Slide 51: This slide displays KPI & Dashboard describing- KPI Dashboard and KPI Metrics.
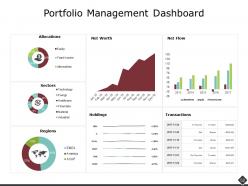
Slide 52: This slide represents Portfolio Management Dashboard with- Allocations, Sectors, Regions, Net Worth, Holdings, Net Flow, Transactions.
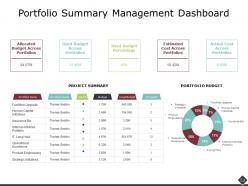
Slide 53: This slide showcases Portfolio Summary Management Dashboard with- Portfolio Name, Portfolio Owner, Health, Budget, Used Budget, Projects.
Slide 54: This slide shows Portfolio Management Securities Allocation Dashboard with Portfolio, Criterias, Profile etc.
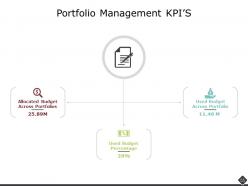
Slide 55: This slide presents Portfolio Management KPI’s describing- Allocated Budget Across Portfolios, Used Budget Percentage, Used Budget Across Portfolios.
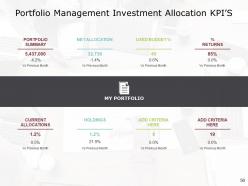
Slide 56: This slide displays Portfolio Management Investment Allocation KPI’s Portfolio Summary Net Allocation Used Budget percentage, Current allocations etc.
Slide 57: This slide displays Portfolio Analysis icons.
Slide 58: This slide is titled as Additional Slides for moving forward.
Slide 59: This slide reminds about a 30 minutes Coffee Break.
Slide 60: This is About Us slide to show company specifications etc.
Slide 61: This is Meet Our Team slide with names and designation.
Slide 62: This is a timeline slide to show information related with time period.
Slide 63: This is Our Mission slide with related imagery and text.
Slide 64: This slide displays Pie Chart with data in percentage.
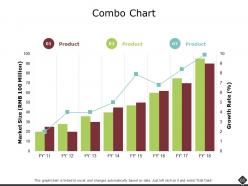
Slide 65: This slide shows Combo Chart with three products comparison.
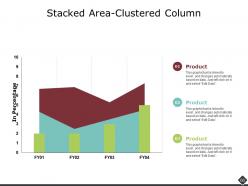
Slide 66: This slide presents Stacked Area-Clustered Column with three products comparison.
Slide 67: This is a Puzzle slide with text boxes.
Slide 68: This is a Silhouettes slide to show people specific information etc.
Slide 69: This is a timeline slide to show information related with time period.
Slide 70: This is a Thank you slide for acknowledgement.
Portfolio Analysis Powerpoint Presentation Slides with all 70 slides:
Use our Portfolio Analysis Powerpoint Presentation Slides to effectively help you save your valuable time. They are readymade to fit into any presentation structure.


FAQs for Portfolio Analysis
Look at your asset allocation first - break down holdings by sector and geography to catch any sketchy concentrations. Performance stuff comes next: returns, volatility, how you're doing vs benchmarks. Risk assessment is where people usually slack off, but check correlation between your holdings and overall portfolio beta. Don't forget costs either - expense ratios and fees add up faster than you think. I run mine quarterly and always compare back to my original goals. Oh, and drawdowns matter too if you're trying to sleep at night.
Check total returns and volatility for each thing you own. Make sure they're actually moving differently - otherwise you're not really diversified, just owning similar stuff. Compare your REIT to other REITs, not the S&P 500 (that's apples to oranges honestly). Same goes for bonds vs bond indices. Fees and taxes will kill your returns if you ignore them. I'd pull this data monthly so you can see what's working and what isn't. Short sentences hit different sometimes. The laggards become pretty obvious once you start tracking this stuff regularly.
Look, Sharpe ratio is probably your best starting point - tells you how much extra return you're getting for the risk you're taking. Sortino's pretty cool too since it only cares about downside volatility (why should you get punished for gains, right?). You've also got Treynor ratio for systematic risk and Jensen's alpha to see if you're actually beating the market. Honestly, I'd track all of them instead of picking just one. Each one shows you something different about how your portfolio's doing, and... yeah, more data points usually = better picture.
Look, diversification is honestly the smartest move you can make without overthinking it. Spread your money across different stuff - stocks, bonds, maybe some international markets. Different investments don't tank at the same time usually. Tech might crash while bonds do fine, or vice versa. You won't get rich quick, but you also won't lose everything if one sector implodes. I learned this the hard way during my early trading days lol. Mix up asset classes first, then diversify within each one. Won't eliminate risk completely, but it definitely smooths out those crazy ups and downs.
So there's basically three ways to handle this. Calendar rebalancing is super straightforward - just reset everything quarterly or yearly no matter what's going on. Threshold rebalancing is what I'd probably do though - you only rebalance when something drifts like 5-10% off target. It's honestly pretty smart since you're automatically buying low and selling high. There's also tactical rebalancing where you make small tweaks based on market stuff, but don't overthink it. Just set some clear rules for when you'll actually pull the trigger.
Mix your hard data with the story stuff - returns, Sharpe ratios, volatility give you the foundation. But then add in management quality, competitive advantages, industry trends, maybe some ESG factors. I'm personally a fan of 60/40 or 70/30 weighting systems, depending on what feels right. The numbers show what already happened. Qualitative analysis helps you guess what's coming next, which honestly is the harder part. Build yourself a simple dashboard tracking both sides - way better than just looking at spreadsheets all day. You'll get a much clearer picture that way.
So asset allocation is huge - like 90% of your returns come from how you split things up between stocks, bonds, real estate, whatever. Don't dump everything in one place because that's just asking for trouble when markets get weird. Your age matters a ton here. If you're 30, go heavy on stocks since you've got time to ride out the crazy swings. But if you're close to retirement? Bonds are your friend for keeping things steady. Figure out your target percentages first, then rebalance every few months. Honestly, most people overthink this part, but the basics work.
Honestly, macro stuff controls way more than people think. Fed changes interest rates? Growth stocks tank immediately while bonds go crazy. GDP numbers, inflation, employment data - they all mess with how assets get priced. I learned this the hard way watching my tech holdings last year lol. Currency swings make international investing even trickier. You've got to bake these trends into your risk models somehow. Run stress tests on different scenarios too. Geopolitical drama is another wildcard that can flip everything overnight. It's all connected.
Honestly, Excel's still king for most people - everyone knows it and you can build some pretty solid models. Bloomberg Terminal is amazing if your company pays for it, but good luck with that price tag. Morningstar Direct and FactSet are great too for the heavy-duty stuff. YCharts is decent if you need something in between. Oh, and don't sleep on Yahoo Finance or Google Sheets for basic analysis - they're free and work fine for a lot of things. I'd just start with whatever you can get your hands on and see where you get stuck. No point overthinking it until you know what you actually need.
Honestly, just pull up your accounts and see where you actually stand vs where you planned to be. Like if you wanted 60% stocks but you're sitting at 80%, that's a problem. Markets move stuff around constantly, so I check mine every few months or so. Think about how you'd really feel if everything dropped 30% tomorrow - not what you think you *should* feel, but how you'd actually react. That's your real risk tolerance right there. If there's a gap, don't panic and rebalance everything at once. Most brokers have decent tools for this stuff, or just throw it in a spreadsheet.
Don't cherry-pick time periods that make you look good - that's the biggest trap. Also, match your benchmark to what you actually own. Like, if you're heavy in tech stocks, don't compare against the S&P 500 when there's a tech index that makes way more sense. Factor in fees and taxes too, obviously. But here's what really gets people: focusing just on returns without thinking about risk. Sure, 15% sounds amazing until you realize you could've gotten 12% with way less stress and volatility. Honestly, those risk-adjusted numbers tell the real story about whether you're actually good at this.
So basically, we're all terrible at investing because our brains work against us. Like, you'll hang onto losing stocks forever because admitting you screwed up feels awful. Or jump into whatever's trending because FOMO is real. I do this stuff too - it's wild how predictable we are. These mental tricks mess with diversification and timing decisions big time. Honestly, the only thing that works is setting up rules ahead of time for when to buy/sell and actually following them. Your emotions will tell you to do the opposite, but that's exactly when you need to ignore your gut.
So basically, a benchmark gives you a reality check on whether you're actually beating the market or just getting lucky during good times. I compare my picks against an index that matches my style - like if I'm doing growth stocks, I'll use a growth index. Pretty eye-opening honestly, especially when you think you're crushing it but turns out the whole market's just up 20%. It also shows if you're taking crazy risks for mediocre returns. Short version: helps you see if your strategy's working or if you should've just bought an index fund and called it a day.
I'd check your whole portfolio every quarter - that's frequent enough to catch real trends without obsessing over daily swings. Monthly quick looks work great for rebalancing stuff. Though honestly, if something crazy happens like a major market crash, don't just sit there waiting for your next scheduled review. Major life changes too - new job, kid, whatever. The quarterly thing gives you actual data to work with instead of panicking over random market noise. Set those calendar reminders now or you'll definitely forget.
Honestly, you should probably look at three main things with your portfolio right now. ESG stuff isn't going anywhere - it's basically required if you want institutional money to take you seriously. AI is wreaking havoc on some sectors while others are absolutely crushing it, so figure out where your stocks fall. Real assets and TIPS are solid for inflation protection too. Oh, and the Fed's moves are creating some weird opportunities in bonds if you're into that. Things are moving so fast lately that I'd maybe rebalance quarterly instead of once a year. Just stress-test everything against these scenarios first.
-
Easily Understandable slides.