


Product features comparison chart powerpoint slide designs





Try Before you Buy Download Free Sample Product
 Impress Your
Audience
 100%
Editable
 Save Hours
of Time


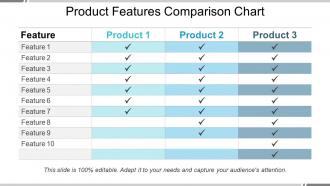
Comparison charts to compare various products specifications have become quite popular nowadays. Making compare and contrast charts in PowerPoint can be very challenging. You may have to spend a lot of time and efforts perfecting the overall appearance of the product features comparison table. To come up with the solution, we are glad to offer our product features comparison chart PowerPoint slide designs template. Design template includes the use of matrix showing performance comparison across products in business firm. You can analyze different product’s behaviour, features and focus on lagging areas so that you can work accordingly. This comparison chart presentation is mainly used by product or process managers, entrepreneurs, sales professionals etc. It is very much useful in developing future business strategies to achieve business goals successfully. So, keeping all these aspects in mind, download this product comparison PowerPoint on a single click on the download button and take as many benefits of this design as possible. Be direct and forthright with our Product Features Comparison Chart Powerpoint Slide Designs. It allows you to express yourself candidly.
People who downloaded this PowerPoint presentation also viewed the following :
Product features comparison chart powerpoint slide designs with all 5 slides:
Facilitate a jolly approach with our Product Features Comparison Chart Powerpoint Slide Designs. Improve the chances of folks being in good humor.


FAQs for Product features comparison chart
Honestly, comparison charts are a game changer when people need to pick between products. You can lay everything out side-by-side instead of making them wade through endless bullet points - which nobody has time for anyway. Your stakeholders will love you for it since they get the info fast without having to mentally juggle a million details. Visual format just clicks better, you know? People spot what's missing and figure out their must-haves way quicker. Oh, and stick with simple stuff like checkmarks or colors rather than walls of text. Trust me on that one.
Honestly, comparison charts are lifesavers when you're stuck between options. You get all the specs right there instead of bouncing between tabs like a maniac. Think of it as a spreadsheet that doesn't make you want to cry. The best part? You'll spot dealbreakers fast and figure out what actually matters to you. Price comparisons become super obvious too. Just make sure the chart focuses on stuff you care about - not whatever flashy features they're pushing this week. I've definitely fallen for the marketing nonsense before.
Set up your product names across the top as columns. Then down the left side, list the key stuff - pricing, main features, integrations, user limits, whatever matters most to your buyers. Keep it simple though, don't dump every single feature in there or people's eyes will glaze over. Stick to checkmarks and X's instead of writing paragraphs. Make sure you're actually comparing similar things too - I've seen tables where they compare a basic plan to premium features which is just confusing. The whole point is making the important differences pop out right away.
Your chart's design can make or break whether people actually read the thing. Messy layouts = instant bounce. I learned this the hard way on my first project lol. Clean formatting with good visual hierarchy keeps them hooked though. Most folks just scan anyway, so checkmarks and icons are your best friends. Readable fonts matter too - don't get fancy here. Color should highlight the big differences between products. Strategic white space guides their eyes where you want them to go. Honestly? Test a few versions and see what sticks. The data doesn't lie about engagement.
Honestly, the biggest mistake is cramming way too many features in there - it just overwhelms people. Don't hide your product's weak spots either, because that's sketchy and everyone knows it. Skip the technical jargon and focus on what actually matters to customers. Your comparison shouldn't scream "BUY MY STUFF!" People have good BS detectors. Also check that your competitor info isn't ancient - nothing worse than getting called out for outdated facts. I'd say stick to 3-5 key differences that your audience genuinely cares about. Maybe start by figuring out what frustrates them most when they're trying to choose?
Dude, color coding is a game changer for comparison charts. I usually go with green for "best value" and red for deal-breakers - you know, the obvious stuff. Yellow works for anything that needs a closer look. The trick is staying consistent so people don't get confused halfway through. Honestly, I've seen too many charts that go overboard with like 7 different colors. Stick to 2-3 max. It's such a simple thing but makes everything so much easier to scan. Your eyes just naturally follow the patterns.
Google Sheets is honestly my go-to for most comparison stuff - super fast to throw together and gets the job done. Excel works too if you're already in that ecosystem. Want something prettier? Canva's templates are decent, or Figma if you're feeling fancy. Oh, and if you need your whole team collaborating on it, Miro's pretty solid. I always forget about PowerPoint's SmartArt but it's not awful for basic charts either. My usual process: start in Sheets to organize everything, then if it needs to look professional for clients or whatever, I'll move it into a design tool. Really depends how polished you need it.
Side-by-side comparisons are perfect when people have already narrowed things down to like 2-4 options and just need to pick one. You know that feeling when you're stuck between the final contenders? That's when these really shine. They work great for stuff with tons of specs or features that aren't super obvious at first glance. But honestly, don't bother if you've got 10+ products - it gets messy fast. The trick is focusing on differences that actually matter to your users, not every single feature under the sun. Makes the decision way easier for them.
Honestly, visuals are a game-changer for comparison charts. People scan way faster when they see icons and color coding instead of walls of text. Your brain just processes that stuff quicker - like, who wants to read paragraphs when you're trying to compare features? Some folks are visual learners anyway, so checkmarks and simple graphics work better for them. I've noticed conversion rates usually go up too since people aren't getting overwhelmed trying to decode everything. Start with basic icons and maybe a consistent color scheme. Nothing fancy at first.
Comparison tables are your best bet here - they're super clear for showing what each product does. Bar charts work well for performance stuff, and I like using icon grids for simple yes/no features. Side-by-side layouts are solid too, especially with specs and ratings. Honestly, I've watched people get way too creative with those circular chart things and it just makes everything harder to read. Why complicate it? Basic tables are usually perfect. Your readers just want to scan quickly and figure out which option fits their needs. Only add fancy elements if they actually make things clearer, not just prettier.
Honestly, I'd say every 2-3 months minimum. Tech and SaaS moves crazy fast though - you might need monthly updates since everyone's constantly shipping new stuff. Slower industries can probably get away with quarterly. Here's the thing - when a competitor drops something big, forget your schedule and update immediately. Nothing screams "we don't pay attention" like outdated comparison charts. Your prospects will notice, trust me. Set some calendar reminders and make sure someone actually owns this. Otherwise it just won't happen.
Your customers are literally telling you what to put in those comparison charts - you just gotta listen. Look through support tickets and reviews to see what features they actually care about. Pain points they mention repeatedly? Those are your key differentiators. I learned this the hard way when I was obsessing over technical specs that nobody even asked about. Focus your charts around what drives their buying decisions, not just whatever sounds impressive. Short comparison beats long feature dump every time. Start by checking if your current chart matches what customers have been saying lately.
Just match it to your existing brand stuff - colors, fonts, the whole vibe. Companies screw this up constantly by grabbing some random template that looks totally different from their website. Pretty annoying tbh. Position your product as the obvious winner and hammer home whatever makes you special. If you're the fancy option, show off those premium features front and center. Oh and make sure it reinforces the same messaging customers already know you for. Treat it like you would any other marketing piece - don't just phone it in.
Track your engagement stuff first - time on page, click-through rates to product pages, actual conversions from people who saw the chart. Heat mapping is honestly a game changer here because you'll see exactly which features people compare and where they look first. Bounce rates matter too. If everyone's bouncing immediately, your chart's probably too overwhelming or just confusing. I'd start simple with these metrics. You don't need to go crazy with analytics right away - just focus on what's actually working versus what needs fixing.
So here's what I'd do - turn each feature into a mini story about someone's actual problem. Like instead of just saying "advanced analytics," paint the picture of Sarah in marketing trying to prove her campaign worked to her demanding boss. Way more interesting than boring bullet points, right? Start with a quick scenario showing your target customer struggling with something real. Then show how each feature swoops in to save the day. I always think about what my audience can actually picture happening in their own lives. Features are cool but outcomes are what people really care about. Makes those comparison charts actually readable for once!
-
Perfect template with attractive color combination.
-
Designs have enough space to add content.